Chapter 15 showed five charts from an estimated model, and could not redraw them
\(-0.20 \to -0.35\) GDP after a 1-point rise in the funds rate, in percent: at once, and a year later. Jones (2024) reads about \(-0.2\) and \(-0.33\) off the Smets–Wouters chart.
This deck solves the Smets–Wouters (2007) model in Python and recomputes those charts: same shapes, almost the same numbers. Getting there takes a solver that does not lie, a model file read with care, and the right units.
Four questions, from equations to experiments
- I. The model, read with care: what do the 14 equations say, and what does the model file get wrong?
- II. Solving and checking: how do we solve it, and how do we know the solution is right?
- III. Chapter 15’s figures recomputed: monetary policy, TFP, government purchases, a financial friction
- IV. Which frictions matter? switch frictions off one at a time and see what changes
Each block of the model: intuition → equation → its line in the model file → its link to Chapter 15.
Appendix G built the tools; this appendix uses them on the model central banks use
From Appendix G
- a model file in YAML: symbols, equations, values
- solving = finding decision rules; Blanchard–Kahn
- Snowdrop:
importModel,run,checkSolution - check every result
New in Appendix H
- a research model with 14 equations and 7 shocks
- a model file that differs from its paper
- a solver that returns a wrong answer
- shock units to translate before comparing
Setup: Snowdrop at a fixed version, and the model file that ships with it
# Snowdrop at the commit of 3 October 2026, without its old NumPy/SciPy pins
%pip install -q --no-deps "https://github.com/gumilevskij/Framework/archive/47a63b2b780e1876898229c09f7f1e8644462692.tar.gz"
%pip install -q --no-deps particles==0.4 "ruamel.yaml==0.17.21" ruamel.yaml.clib

SUPP = os.path.abspath(os.path.join(os.path.dirname(snowdrop.src.__file__), "..", "..", "supplements"))
SW_FILE = os.path.join(SUPP, "models", "COVID19", "sw_model.yaml")
shutil.copy(SW_FILE, WORK)
Size: 19421 bytes, 432 linesThe model, read with care
Act I
Smets and Wouters put all of Chapter 15’s pieces into one estimated model
Households
like consumption with habits (they compare it with last quarter’s), dislike work, and set wages that are sticky
Firms
rent capital, choose how hard to run it (utilization), pay to change investment fast (adjustment costs), set sticky prices
Central bank
sets the interest rate with a Taylor rule that looks at inflation and the output gap
Seven shocks
TFP, risk premium, government purchases, investment efficiency, monetary policy, price and wage markups
Estimated on seven U.S. series, 1966–2004, with the Bayesian method of Appendix G.12.
Every variable is a percent deviation from the growth path
- \(y_t = 0.5\): GDP is 0.5 percent above its trend in quarter \(t\) (the balanced growth path of Ch. 5)
- inflation \(\pi_t\) and the interest rate \(r_t\): percentage points per quarter; × 4 for annual rates
- \(E_t x_{t+1}\): what people expect today for next quarter, a rational (model-consistent) forecast
- each equation: a weighted average of a few variables, weights built from deep parameters
Log-linear means: first-order conditions approximated around the growth path, with the growth rules of Appendix C.5.
How to read an impulse response
- the horizontal axis: quarters after the shock; the shock hits in quarter 1, nothing else ever happens
- the vertical axis: the difference from the path without the shock (percent, or points at an annual rate)
- the zero line is “no effect”; a line that returns to zero means the effect has died out
- read three things: the sign, the timing of the largest effect, and how long it lasts
Every chart in Acts III and IV is read this way: sign, peak, persistence.
Sixteen deep parameters, with Smets and Wouters’ estimates
| Symbol | Meaning | File name | Estimate |
|---|---|---|---|
| \(\varphi\) | investment adjustment cost | csadjcost |
5.49 |
| \(\sigma_c\) | risk aversion (\(1/\sigma_c\): intertemporal substitution) | csigma |
1.40 |
| \(h\) | habit: weight of last quarter’s consumption | chabb |
0.71 |
| \(\xi_w\), \(\xi_p\) | Calvo: share of wages / prices not reset in a quarter | cprobw, cprobp |
0.74, 0.66 |
| \(\sigma_l\) | inverse Frisch elasticity of labor supply | csigl |
1.92 |
| \(\iota_w\), \(\iota_p\) | indexation of wages / prices to past inflation | cindw, cindp |
0.59, 0.23 |
| \(\psi\) | cost of changing utilization (0 to 1) | czcap |
0.55 |
| \(\Phi\) | fixed costs: 1 + their share of output | cfc |
1.61 |
| \(r_\pi\), \(r_y\), \(r_{\Delta y}\) | Taylor rule: inflation, output gap, its change | crpi, cry, crdy |
2.03, 0.08, 0.22 |
| \(\rho\) | interest-rate smoothing | crr |
0.82 |
| \(\alpha\) | capital share | calfa |
0.19 |
Calvo in one number: how long does a price or a wage last?
\[\text{average duration} = \frac{1}{1-\xi} \text{ quarters}\]
| Share not reset each quarter | Average duration | |
|---|---|---|
| prices, \(\xi_p = 0.66\) | two thirds | about 3 quarters |
| wages, \(\xi_w = 0.74\) | three quarters | about 4 quarters |
The estimates were chosen by the data: wages are stickier than prices.
Five blocks, fourteen equations
| Block | Equations | What it decides | Chapter 15 link |
|---|---|---|---|
| Demand | resource constraint, consumption, investment, value of capital | how GDP is spent | \(Y = C + I + G\), Euler (Ch. 16) |
| Supply | production, utilization, capital accumulation, demand for capital | how GDP is produced | Cobb–Douglas, Solow |
| Prices | marginal cost, Phillips curve | inflation | sticky prices |
| Wages | marginal rate of substitution, wage Phillips curve | the real wage | labor supply, sticky wages |
| Policy | Taylor rule on the output gap | the interest rate | Ch. 12 rule |
Plus seven shock processes and a flexible-price copy of the real side, used to measure potential output.
Demand (1): GDP is consumption, investment, purchases and the cost of utilization
\[y_t = c_y\,c_t + i_y\,i_t + z_y\,z_t + \varepsilon^g_t \tag{H.1}\]
- the national income identity \(Y = C + I + G\) in percent deviations: each part weighted by its share of GDP
- \(c_y \approx 0.65\), \(i_y \approx 0.17\); \(z_y z_t\): what it costs to run capital harder
- the spending shock \(\varepsilon^g_t\) is measured in percent of GDP
Demand (2): consumption leans on last quarter’s, next quarter’s, and the real rate
\[c_t = c_1\,c_{t-1} + (1-c_1)\,E_t c_{t+1} + c_2\,(l_t - E_t l_{t+1}) - c_3\,(r_t - E_t\pi_{t+1} + \varepsilon^b_t) \tag{H.2}\]
\[c_1 = \frac{h/\gamma}{1+h/\gamma} = 0.415 \qquad\qquad c_3 = \frac{1-h/\gamma}{\sigma_c\,(1+h/\gamma)} = 0.122\]
A higher real rate \(r_t - E_t\pi_{t+1}\) makes saving more attractive, so people consume less today.
Habits make consumption sluggish, and less sensitive to the interest rate
Without habits (\(h = 0\))
- \(c_1 = 0\): no pull from the past
- \(c_3 = 1/\sigma_c = 0.72\)
- consumption jumps at once when rates move
With \(h = 0.71\)
- \(c_1 = 0.415\): the past pulls
- \(c_3 = 0.122\)
- consumption moves slowly and in a hump
Act IV tests this: with weaker habits, consumption falls more, and sooner, after a monetary tightening.
The risk premium: a wedge between the funds rate and the rate households face
- \(\varepsilon^b_t\) is added to the real rate in (H.2): households borrow and save at more than the funds rate
- it is the financial friction of the textbook’s last Smets–Wouters chart
- the file writes it as \(b_t = -c_3\,\varepsilon^b_t\), with a plus sign: a rise in the premium is a negative
b
Demand (3): investment rises with the value of capital, slowly
\[i_t = \frac{1}{1+\bar{\beta}\gamma}\left(i_{t-1} + \bar{\beta}\gamma\,E_t i_{t+1} + \frac{1}{\gamma^2\varphi}\,q_t\right) + \varepsilon^i_t \tag{H.3}\]
- \(q_t\): the value of installed capital (Tobin’s \(q\), Ch. 17)
- adjustment cost \(\varphi = 5.49\): the larger it is, the less investment reacts to \(q_t\)
- \(i_{t-1}\) and \(E_t i_{t+1}\): firms spread changes in investment over time
- \(\varepsilon^i_t\): the investment-specific shock (how efficiently investment goods become capital)
Demand (4): the value of capital falls when the real rate rises
\[q_t = -(r_t - E_t\pi_{t+1} + \varepsilon^b_t) + q_1\,E_t r^k_{t+1} + (1-q_1)\,E_t q_{t+1} \tag{H.4}\]
- owning capital pays its rental rate \(r^k\) and its resale value; a bond pays the real rate
- arbitrage: the two must pay the same, so a higher real rate lowers \(q_t\)
- \(q_1 = r^k_*/(r^k_* + 1 - \delta)\): the share of rent in the return on capital
Real rate ↑ → value of capital ↓ → investment ↓ through (H.3): the investment channel of the IS curve (Ch. 11).
Supply (1): Cobb–Douglas production with fixed costs
\[y_t = \Phi\left(\alpha\,k^s_t + (1-\alpha)\,l_t + \varepsilon^a_t\right) \tag{H.5}\]
- capital services \(k^s_t\) and hours \(l_t\), with the capital share \(\alpha = 0.19\), as in Chapters 4 and 15
- \(\varepsilon^a_t\): TFP, Chapter 15’s \(\bar{A}\), in percent
- \(\Phi = 1.61 > 1\): output must also cover fixed costs, so 1 percent more inputs give more than 1 percent more output
Supply (2): firms can run their capital harder before they have more of it
\[k^s_t = k_{t-1} + z_t \qquad\qquad z_t = \frac{1-\psi}{\psi}\,r^k_t \qquad\qquad r^k_t = w_t + l_t - k^s_t\]
- capital services = installed stock × how intensively it runs (utilization \(z_t\))
- firms run capital harder when renting it pays more; \(\psi = 0.55\) sets how costly that is
- cost minimization fixes what firms spend on capital relative to labor
Utilization lets output respond to shocks before the capital stock moves.
Supply (3): capital accumulates as in the Solow model
\[k_t = (1-i_k)\,k_{t-1} + i_k\,i_t + i_k\,(1+\bar{\beta}\gamma)\,\gamma^2\varphi\,\varepsilon^i_t \tag{H.6}\]
- \(i_k = 1 - (1-\delta)/\gamma = 0.029\): the investment–capital ratio per quarter
- the law of motion of capital of Chapter 5, in percent deviations
- the last term adds the investment-specific shock
The paper has the factor \((1+\bar{\beta}\gamma)\); the file does not. More on that in two slides.
Prices: the New Keynesian Phillips curve
\[mc_t = \alpha\,r^k_t + (1-\alpha)\,w_t - \varepsilon^a_t \tag{H.7}\]
\[\pi_t = \frac{1}{1+\bar{\beta}\gamma\iota_p}\left(\bar{\beta}\gamma\,E_t\pi_{t+1} + \iota_p\,\pi_{t-1} + \kappa_p\,mc_t\right) + \varepsilon^p_t \tag{H.8}\]
- marginal cost: a weighted average of the rental rate and the real wage, less TFP
- each quarter a firm resets its price with probability \(1-\xi_p\); the others index to past inflation (\(\iota_p\))
- \(\varepsilon^p_t\): the price markup shock
The same Phillips curve as Chapter 13, with expectations and a slope set by stickiness
Chapter 13
\[\pi_t = \pi_{t-1} + \bar{\nu}\,\widetilde{Y}_t + \bar{o}\]
- past inflation
- the output gap
- a shock \(\bar{o}\)
Smets–Wouters
\[\kappa_p = \frac{(1-\xi_p)(1-\bar{\beta}\gamma\xi_p)}{\xi_p\left((\Phi-1)\varepsilon_p + 1\right)}\]
- past inflation (indexation)
- marginal cost
- the markup shock \(\varepsilon^p\)
- and expected inflation
Sticky prices (\(\xi_p\) near 1) make \(\kappa_p\) small: marginal cost moves prices only slowly.
Wages (1): the marginal rate of substitution is Chapter 15’s labor supply curve
\[mrs_t = \sigma_l\,l_t + \frac{1}{1-h/\gamma}\left(c_t - \frac{h}{\gamma}\,c_{t-1}\right) \tag{H.9}\]
- the wage at which a household is just willing to work one more hour
- more hours → leisure is more valuable (\(\sigma_l l_t\))
- more consumption → extra income is less valuable: labor supply shifts in when consumption rises
The wealth effect on labor supply of Chapter 15, written as one equation.
Wages (2): sticky wages close the gap to the MRS only slowly
\[\begin{aligned} w_t = {} & w_1\,w_{t-1} + (1-w_1)\left(E_t w_{t+1} + E_t\pi_{t+1}\right) - w_2\,\pi_t + w_3\,\pi_{t-1} \\ & + \kappa_w\,(mrs_t - w_t) + \varepsilon^w_t \end{aligned} \tag{H.10}\]
- \(-w_2\,\pi_t\): the nominal wage moves slowly, so the real wage falls when inflation rises
- \(\kappa_w(mrs_t - w_t)\): the labor market is off its labor supply curve for a while
- \(\xi_w \to 0\): \(\kappa_w\) becomes very large and the real wage stays on the labor supply curve
- \(\varepsilon^w_t\): the wage markup shock
Policy: a Taylor rule on the output gap, with smoothing
\[\begin{aligned} r_t = {} & \rho\,r_{t-1} + (1-\rho)\left(r_\pi\,\pi_t + r_y\,(y_t - y^p_t)\right) \\ & + r_{\Delta y}\left[(y_t - y^p_t) - (y_{t-1} - y^p_{t-1})\right] + \varepsilon^r_t \end{aligned} \tag{H.11}\]
- smoothing \(\rho = 0.82\): the rate moves only partway toward its target each quarter
- the output gap compares GDP with \(y^p_t\): GDP of the same economy with flexible prices and wages
- it also responds to the change in the gap (\(r_{\Delta y} = 0.22\))
- \(\varepsilon^r_t\): the monetary policy shock, the part of the rate the rule does not explain
Potential output is GDP in a flexible-price copy of the same economy
The flexible economy
- equations (H.1)–(H.6) again, for
yf,cf,labf,wf, … - marginal cost fixed; the real wage equals the MRS
- the same seven shocks
What it keeps
- habits
- investment adjustment costs
- variable utilization
It removes the nominal frictions only, which makes it a ready-made experiment for Act IV.
“Potential output is a smooth trend”
“Potential output is a smooth trend line through GDP.”
In this model, potential output is GDP of the flexible economy, and it moves with every real shock: after a TFP shock it rises at once. The output gap \(y_t - y^p_t\) can shrink while GDP rises.
Shocks: seven AR(1) processes, two with a moving-average twist
\[\varepsilon^x_t = \rho_x\,\varepsilon^x_{t-1} + \eta^x_t \tag{H.12}\]
| Shock | Persistence | Note |
|---|---|---|
| TFP | \(\rho_a = 0.96\) | half-life 16.5 quarters: Chapter 15’s “4 years” |
| Government purchases | \(\rho_g = 0.98\) | also moves with TFP surprises, \(\rho_{ga} = 0.53\) |
| Risk premium | \(\rho_b = 0.18\) | dies out fast |
| Monetary policy | \(\rho_r = 0.13\) | dies out fast |
| Price / wage markups | \(0.90\) / \(0.97\) | plus a moving-average term: \(-\mu\,\eta_{t-1}\) |
Act I in one table: the equations to know
| Block | Equation | Key parameter (estimate) |
|---|---|---|
| Resource constraint | \(y = c_y c + i_y i + z_y z + \varepsilon^g\) | \(c_y = 0.65\), \(i_y = 0.17\) |
| Consumption | \(c_t\) from \(c_{t-1}\), \(E_t c_{t+1}\) and the real rate + premium | habit \(h = 0.71\) |
| Investment | \(i_t\) from \(i_{t-1}\), \(E_t i_{t+1}\) and \(q_t\) | adjustment cost \(\varphi = 5.49\) |
| Value of capital | \(q_t\): future rents less real rates | \(\delta = 0.025\) |
| Production | \(y = \Phi(\alpha k^s + (1-\alpha) l + \varepsilon^a)\) | \(\Phi = 1.61\), \(\alpha = 0.19\) |
| Price Phillips curve | \(\pi_t\) from \(E_t\pi_{t+1}\), \(\pi_{t-1}\), marginal cost | Calvo \(\xi_p = 0.66\) |
| Wage Phillips curve | \(w_t\) closes the gap to the MRS slowly | Calvo \(\xi_w = 0.74\) |
| Taylor rule | \(r_t\) from \(r_{t-1}\), \(\pi_t\), \(y_t - y^p_t\) | \(\rho = 0.82\), \(r_\pi = 2.03\) |
The model file comes from a COVID-19 project, not from the paper
A model file in a package is research software: written for one project, shared, and not checked against your purposes. Read it before you trust it.
- its header: it follows the published replication files, updated by Pfeifer
- it rescales the risk premium (\(b = c_3 \times\) the paper’s shock, with a flipped sign)
- it notes that equation (8) of the paper is coded without the factor \((1+\bar{\beta}\gamma)\)
- some priors in the code differ from the paper’s tables
Every one of its 29 values differs from the published estimates
| Parameter | In the file | Smets–Wouters estimate |
|---|---|---|
csadjcost (\(\varphi\)) |
6.01 | 5.49 |
chabb (\(h\)) |
0.64 | 0.71 |
cprobp (\(\xi_p\)) |
0.60 | 0.66 |
cindp (\(\iota_p\)) |
0.47 | 0.23 |
crpi (\(r_\pi\)) |
1.49 | 2.03 |
constebeta (\(\bar{\beta}\)) |
0.742 | 0.161 |
crhoa (\(\rho_a\)) |
0.998 | 0.959 |
crhob (\(\rho_b\)) |
0.58 | 0.18 |
crhoms, crhopinf, crhow, cmap, cmaw |
0 | 0.13, 0.90, 0.97, 0.74, 0.89 |
29 of 29 differ: the file is the starting point of another project, not a copy of the paper.
Three more things to know before using the file
- The discount factor is set twice.
constebeta= 0.742 gives \(\beta = 0.9926\), but the file also setscbeta: 0.9995 - The growth rates start at the trend, although they are deviations: residuals of 0.398 in four equations
- The estimation block does not load: no starting-value column, a typo
BETA_PD, soimportModelstops
cbeta in the file: 0.9995   1/(1+constebeta/100) = 0.9926
A line of the estimation block: crhoms, 0.01,.9999,BETA_PD.5,0.20The missing factor: what Del Negro and Schorfheide found
The paper, equation (8)
\[\ldots + i_k\,(1+\bar{\beta}\gamma)\,\gamma^2\varphi\,\varepsilon^i_t\]
The file (and the published code)
\[\ldots + i_k\,\gamma^2\varphi\,\varepsilon^i_t\]
We restore the factor in both economies. It multiplies only the investment-specific shock, so only that shock’s responses change, by about 2 percent.
Our corrected copy: write the file from a dictionary, for any parameter values
def write_sw(values=None, fixed=True, file="sw_ours.yaml"):
    d = yaml.safe_load(text)
    d.pop("estimated_parameters")                      # Snowdrop cannot read it
    d["calibration"].update(SW_MODE)                   # the published estimates
    d["calibration"]["cbeta"] = "1/(1+constebeta/100)" # beta follows constebeta
    for name in ["dy", "dc", "dinve", "dw"]:
        d["calibration"][name] = 0                     # deviations start at 0
    d["calibration"].update(values or {})              # our own changes, if any
    if fixed:                                          # restore (1 + beta*gamma) in (H.6)
        ...
    yaml.safe_dump(d, open(os.path.join(WORK, file), "w"), sort_keys=False, width=10_000)

def load_sw(values=None, fixed=True, solver="AndersonMoore", file="sw_ours.yaml"):
    model, report = quietly(driver.importModel, fname=write_sw(values, fixed, file), Solver=solver)
return modelChange a parameter by writing the file again, not by editing the loaded model
Snowdrop computes the derived values (cbetabar, ccy, ciy, crkky, cikbar) once, when it reads the file.
37 variables, 7 shocks, 41 parameters
Derived values: {'cbetabar': 0.9924, 'ccy': 0.6469, 'ciy': 0.1731, 'crkky': 0.1928, 'cikbar': 0.0292}
“I changed chabb in the loaded model, so habits changed everywhere.”
The weights \(c_1\), \(c_3\) and the steady-state shares were computed from the old value. Write the file again: load_sw({"chabb": 0.4}).
Solving and checking
Act II
Solving the model means finding its decision rules
Every variable today as a linear function of the state (last quarter’s variables) and today’s shocks, with the Blanchard–Kahn condition checking that exactly one stable solution exists.
\[\underset{\text{37 variables today}}{x_t} \;=\; \underset{\text{decision rules}}{F}\; \underset{\text{last quarter}}{x_{t-1}} \;+\; \underset{\text{impact}}{G}\; \underset{\text{7 shocks}}{\eta_t}\]
Snowdrop finds \(F\) and \(G\) for a linear model in a fraction of a second. It has several solvers, and they do not all agree.
From decision rules to an impulse response, step by step
Step 1. The shock hits in quarter 1: \(x_1 = G\,\eta\) (one entry of \(\eta\) is the shock, the others are 0).
Step 2. No more shocks: \(x_2 = F\,x_1\), \(\;x_3 = F\,x_2\), …
Step 3. Read one entry of \(x_t\), quarter by quarter: that is the impulse response of one variable.
\[x_t = F^{\,t-1}\,G\,\eta\]
Stable solution: every root of \(F\) inside the unit circle, so \(F^{\,t-1} \to 0\) and every response returns to zero.
Four solvers, one model: which answer do you trust?
We solve the same model, with the same parameters, with Klein’s solver (Appendix G’s choice for Ireland) and with Anderson–Moore’s. Both return a solution without an error message.
Both charts of consumption after a monetary tightening look smooth and plausible. How would you decide which one is right, without knowing the answer?
Put the solution back into every equation: only one solver passes
                largest residual  consumption, quarter 4
Anderson-Moore      1.249001e-15               -0.349709
Klein 2.061187e-02 -0.030078- Anderson–Moore: residuals of \(10^{-15}\), rounding error
- Klein: residuals of 0.02, and a consumption response a tenth of the right one
- Binder–Pesaran agrees with Anderson–Moore; Villemot’s solver finds no solution here
The Klein chart looks fine. Only the residuals show that it is wrong.
The residual check in code
def max_residual(model, shock, size):
    """The largest equation residual along a simulated path."""
    shocks = model.symbols["shocks"]
    values = [0.0] * len(shocks); values[shocks.index(shock)] = size
    model.options["periods"] = [1]; model.options["shock_values"] = [values]
    (y, dates), report = quietly(driver.run, model=model, Plot=False)
    errors = checkSolution(model, periods=model.options["periods"], y=np.asarray(y))
    return float(np.max(np.abs(np.asarray(errors))))

sw_klein = load_sw(solver="Klein", file="sw_klein.yaml")“Every solver solves the model; they differ only in speed”
“Every solver solves the model; they differ only in speed.”
A solver can return a wrong answer with no warning. Check the residuals of every new model, and compare with a published number when you have one.
Units: rates are quarterly in the model, annual in the textbook
In the model
- \(\pi_t\), \(r_t\): points per quarter
- a shock \(\eta^r = 0.25\) raises the rate by 0.25 points a quarter
In the textbook
- inflation and the funds rate at an annual rate
- “a 1 percentage point rise in the funds rate”
1 point a year = 0.25 a quarter. So the textbook’s monetary shock is \(\eta^r = 0.25\), and we report \(\pi\) and \(r\) × 4.
An impulse response, in the textbook’s units
ANNUAL = ["pinf", "r"]                                  # quarterly rates: multiply by 4

def irf(model, shock, size, T=40):
    """Response to a shock of `size` in quarter 1, for T quarters, in the textbook's units."""
    shocks = model.symbols["shocks"]
    values = [0.0] * len(shocks)
    values[shocks.index(shock)] = size
    model.options["periods"] = [1]                     # the shock hits in period 1 only
    model.options["shock_values"] = [values]
    (y, dates), report = quietly(driver.run, model=model, Plot=False)
    table = pd.DataFrame(np.asarray(y)[1:T + 1], columns=model.symbols["variables"])
    for name in ANNUAL:
        table[name] = 4 * table[name]
    ...
    return table

mp = irf(sw, "em", 0.25)The first impulse response, as a table
           GDP  consumption  investment  hours  real wage  inflation  interest rate  utilization
quarter
1       -0.195       -0.197      -0.308 -0.132     -0.036     -0.165          0.752       -0.076
2       -0.303       -0.303      -0.481 -0.201     -0.073     -0.198          0.551       -0.120
3       -0.348       -0.346      -0.561 -0.228     -0.103     -0.197          0.329       -0.140
4       -0.354       -0.350      -0.580 -0.228     -0.123     -0.186          0.173       -0.142
8       -0.234       -0.229      -0.406 -0.138     -0.134     -0.118         -0.049       -0.081
20      -0.009       -0.027       0.003  0.010     -0.034     -0.004         -0.006        0.039
Read a column down: one variable, quarter by quarter. That column is the impulse response.
“A 1-point policy shock raises the funds rate by 1 point”
“A 1-point policy shock raises the funds rate by 1 point.”
The rule is part of the model: inflation and the output gap fall at once, and the rule offsets part of the shock. The rate rises by 0.75 points in quarter 1 and 0.33 in quarter 3.
Act II in one table: solving and checking
| Idea | What it means here |
|---|---|
| Decision rules | \(x_t = F x_{t-1} + G \eta_t\): no expectations left |
| Solver | Anderson–Moore (residuals \(10^{-15}\)); not Klein (0.02) for this model |
| Residual check | checkSolution: put the path back into every equation |
| Monetary shock | \(\eta^r = 0.25\) = 1 point at an annual rate |
| Annual rates | inflation and the funds rate × 4 |
| TFP, purchases | \(\eta^a = 1\) (1 percent); \(\eta^g = 1\) (1 percent of GDP) |
| Risk premium | file’s b \(= -c_3\,\varepsilon^b\) |
| Impulse response | irf(model, shock, size): one shock in quarter 1, a table by quarter |
Chapter 15’s figures recomputed
Act III
What does a 1-point rise in the funds rate do to GDP?
The funds rate rises by 1 percentage point (annual rate) in quarter 1, and the surprise dies out fast (\(\rho_r = 0.13\)). The rule keeps the rate high through smoothing.
Sketch GDP over 20 quarters. Does it fall most at once or later? By roughly how much? When is it back to normal?
GDP falls 0.20 percent at once and 0.35 percent a year later
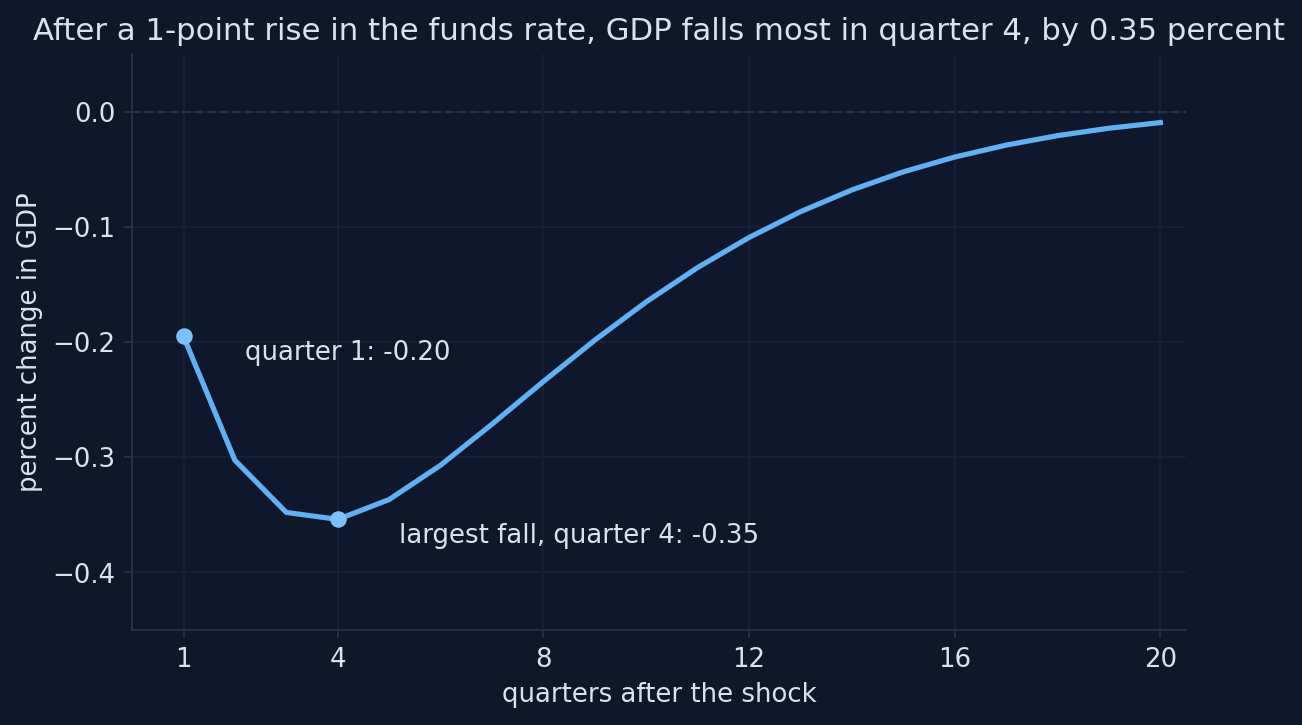
Adapted from Fig. 15.9 in Jones (2024), based on Smets and Wouters (2007); computed with Snowdrop’s model file and the published estimates. Appendix H, Section H.6.
The model reproduces the textbook’s three numbers
| Jones (2024) | This model | |
|---|---|---|
| GDP in quarter 1 (%) | about −0.2 | −0.20 |
| largest fall (%) | about −0.33 | −0.35 |
| quarter of the largest fall | 3 to 4 | 4 |
| after 5 years | mostly gone | −0.01 (quarter 20) |
Three sources of the delayed trough: habits slow consumption, adjustment costs slow investment, and smoothing keeps the rate high for several quarters.
Predict the other three: consumption, hours, inflation
Same shock. GDP falls 0.35 percent at the trough.
Does consumption fall more or less than GDP? Hours more or less than GDP? How large is the fall in inflation, and how long does it last?
Consumption falls as much as GDP; hours less; inflation by 0.2 points
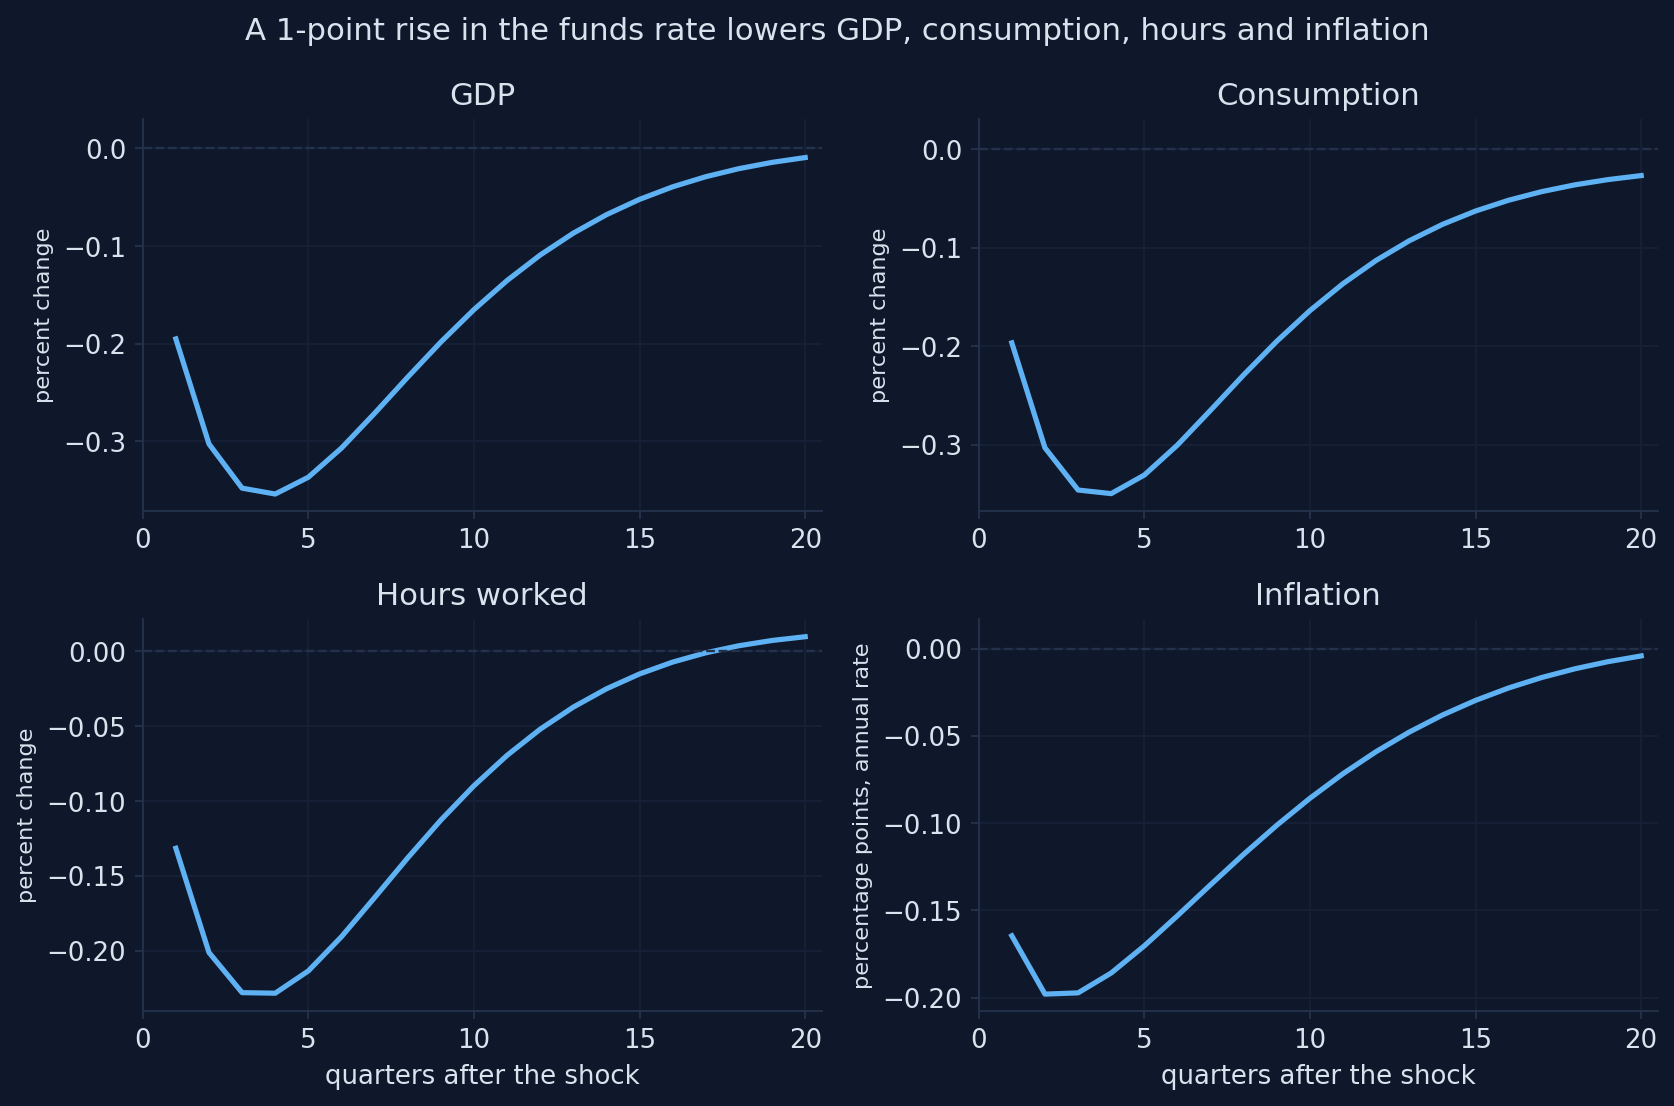
Adapted from Fig. 15.10 in Jones (2024), based on Smets and Wouters (2007); computed with Snowdrop’s model file and the published estimates. Appendix H, Section H.6.
Reading the monetary shock
- consumption: −0.35 at the trough, the same as GDP
- hours: −0.23: part of the fall in output comes from lower utilization
- inflation: −0.20 points, below −0.15 for six quarters (the textbook: about two years)
- the funds rate rises by only 0.75 points: the rule offsets part of the shock
Jones explains the large consumption response by adjustment costs. Act IV finds that, in this model, habits matter more.
A more persistent surprise almost doubles the fall in GDP
Raise the persistence of the policy surprise from 0.13 to 0.5: load_sw({"crhoms": 0.5}).
- the largest fall in GDP: about −0.65 percent, still in quarter 4
- people expect the tightening to last, so long-term real rates rise more
- (H.2) and (H.4) look at the whole expected path of rates
This is why central banks care about forward guidance (Ch. 13): the expected path of rates moves spending, not just today’s rate.
What does a 1 percent rise in TFP do to GDP and hours?
TFP rises 1 percent in quarter 1 and fades slowly (\(\rho_a = 0.96\), a half-life of 16.5 quarters).
Does GDP rise by more or less than 1 percent? Do hours rise or fall at first? Does inflation rise or fall?
GDP rises more than TFP, but hours fall at first
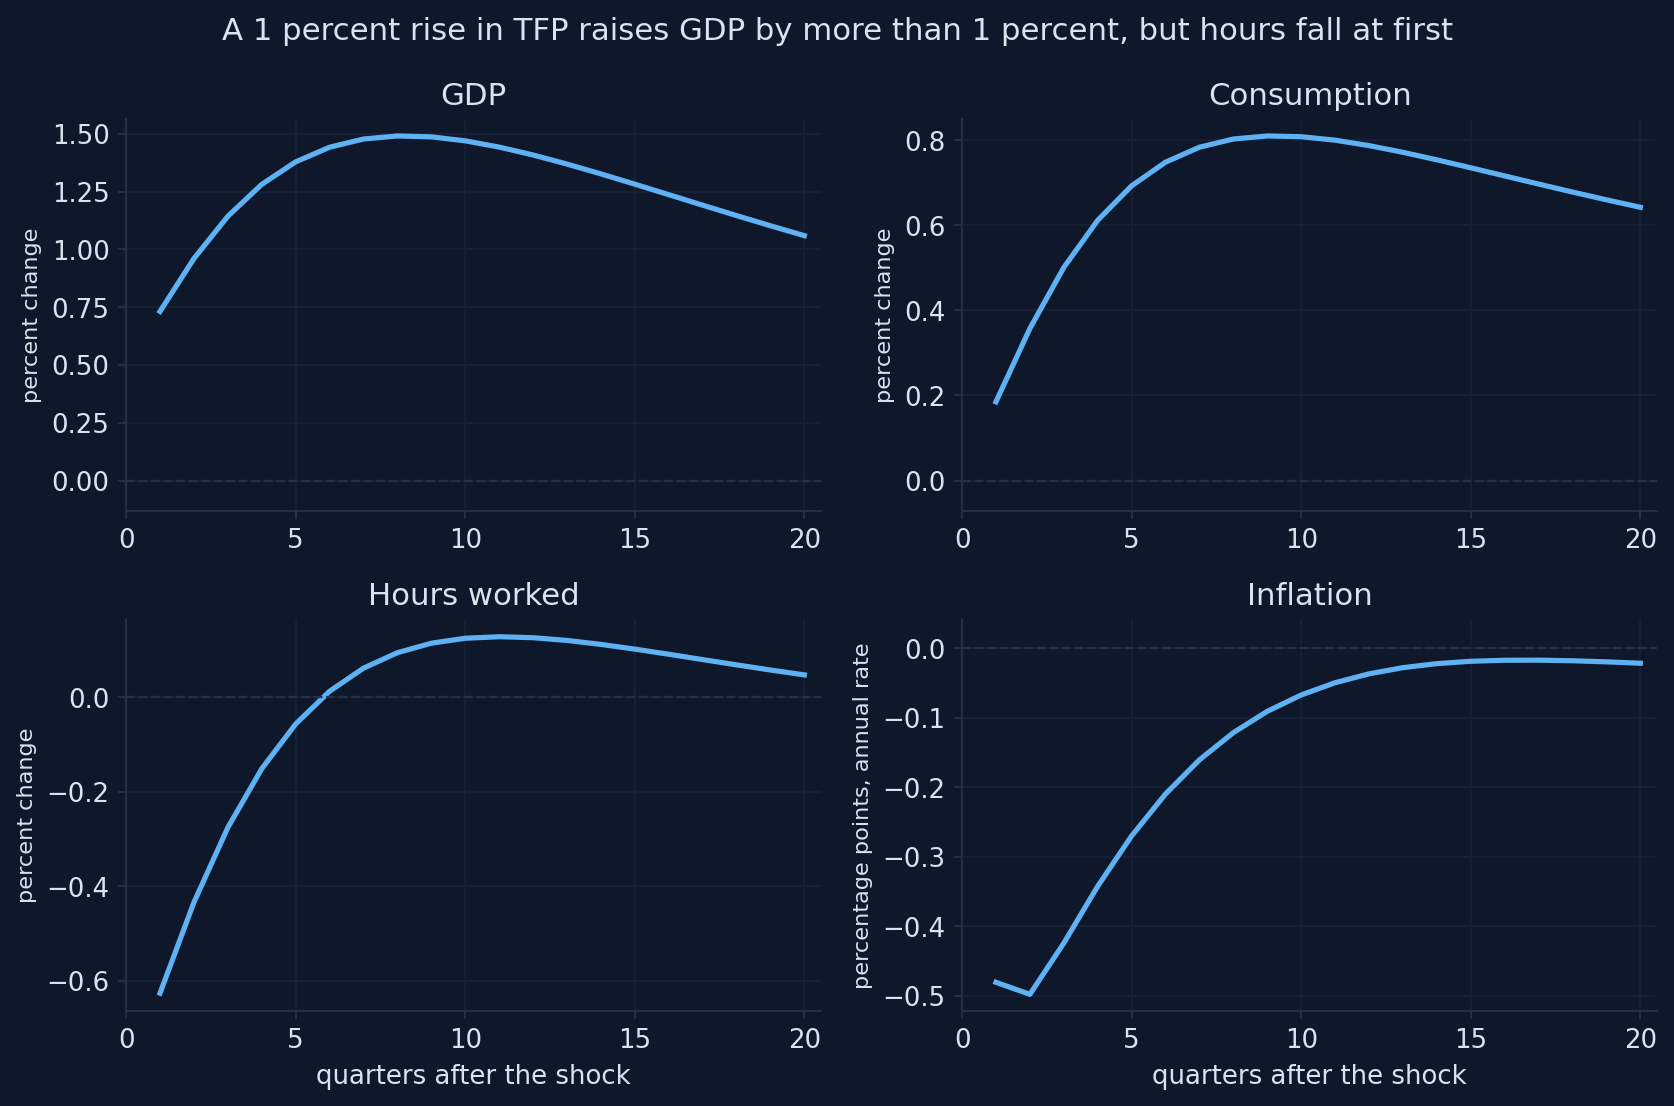
Adapted from Fig. 15.11 in Jones (2024), based on Smets and Wouters (2007); computed with Snowdrop’s model file and the published estimates. Appendix H, Section H.7.
Every pattern of the textbook, with the same sizes
- GDP peaks at 1.49 percent in quarter 8: more than the 1 percent rise in TFP, because capital accumulates
- consumption rises about half as much (peak 0.81): households smooth it
- hours fall by 0.63 percent at first, and turn positive only in quarter 6
- inflation falls by 0.48 points: higher TFP lowers marginal cost (H.7)
The fall in hours is the puzzle of Chapter 15. Act IV asks how much of it is due to sticky prices.
Over ten years, capital keeps GDP up while TFP fades
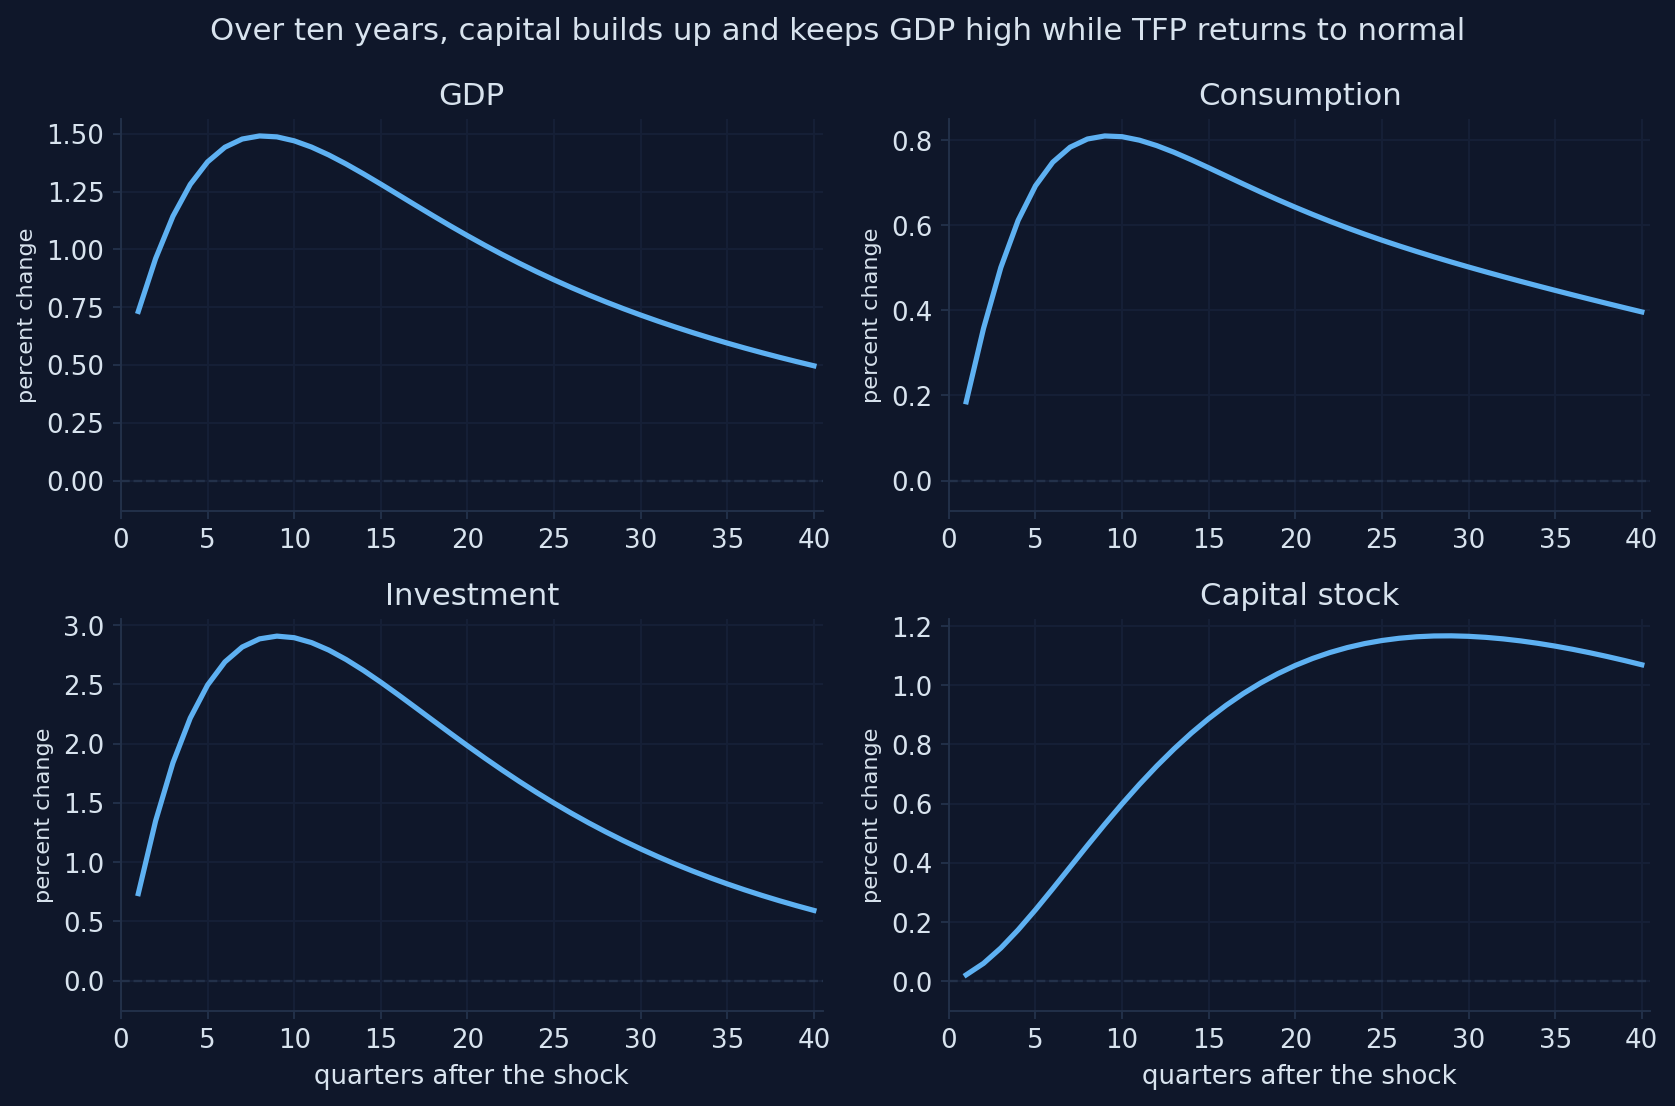
Computed with Snowdrop’s model file and the estimates of Smets and Wouters (2007); related to Chapter 15 of Jones (2024). Appendix H, Section H.7.
A nearly permanent TFP rise still lowers hours at first
Set crhoa = 0.99: the gain in TFP almost never fades.
- hours still fall by almost 0.6 percent at first, and stay close to zero for years
- households are richer, so they want to consume more and work less (the wealth effect, H.9)
- with habits, adjustment costs and sticky prices, demand still rises slowly
- consumption now rises much more: the gain in income is more permanent
What does a rise in government purchases do to consumption?
Purchases rise by 1 percent of GDP in quarter 1 and fade very slowly (\(\rho_g = 0.98\)).
Is the multiplier above or below 1? Does consumption rise (more income) or fall? Do hours rise or fall?
Purchases raise GDP and hours, and crowd out consumption
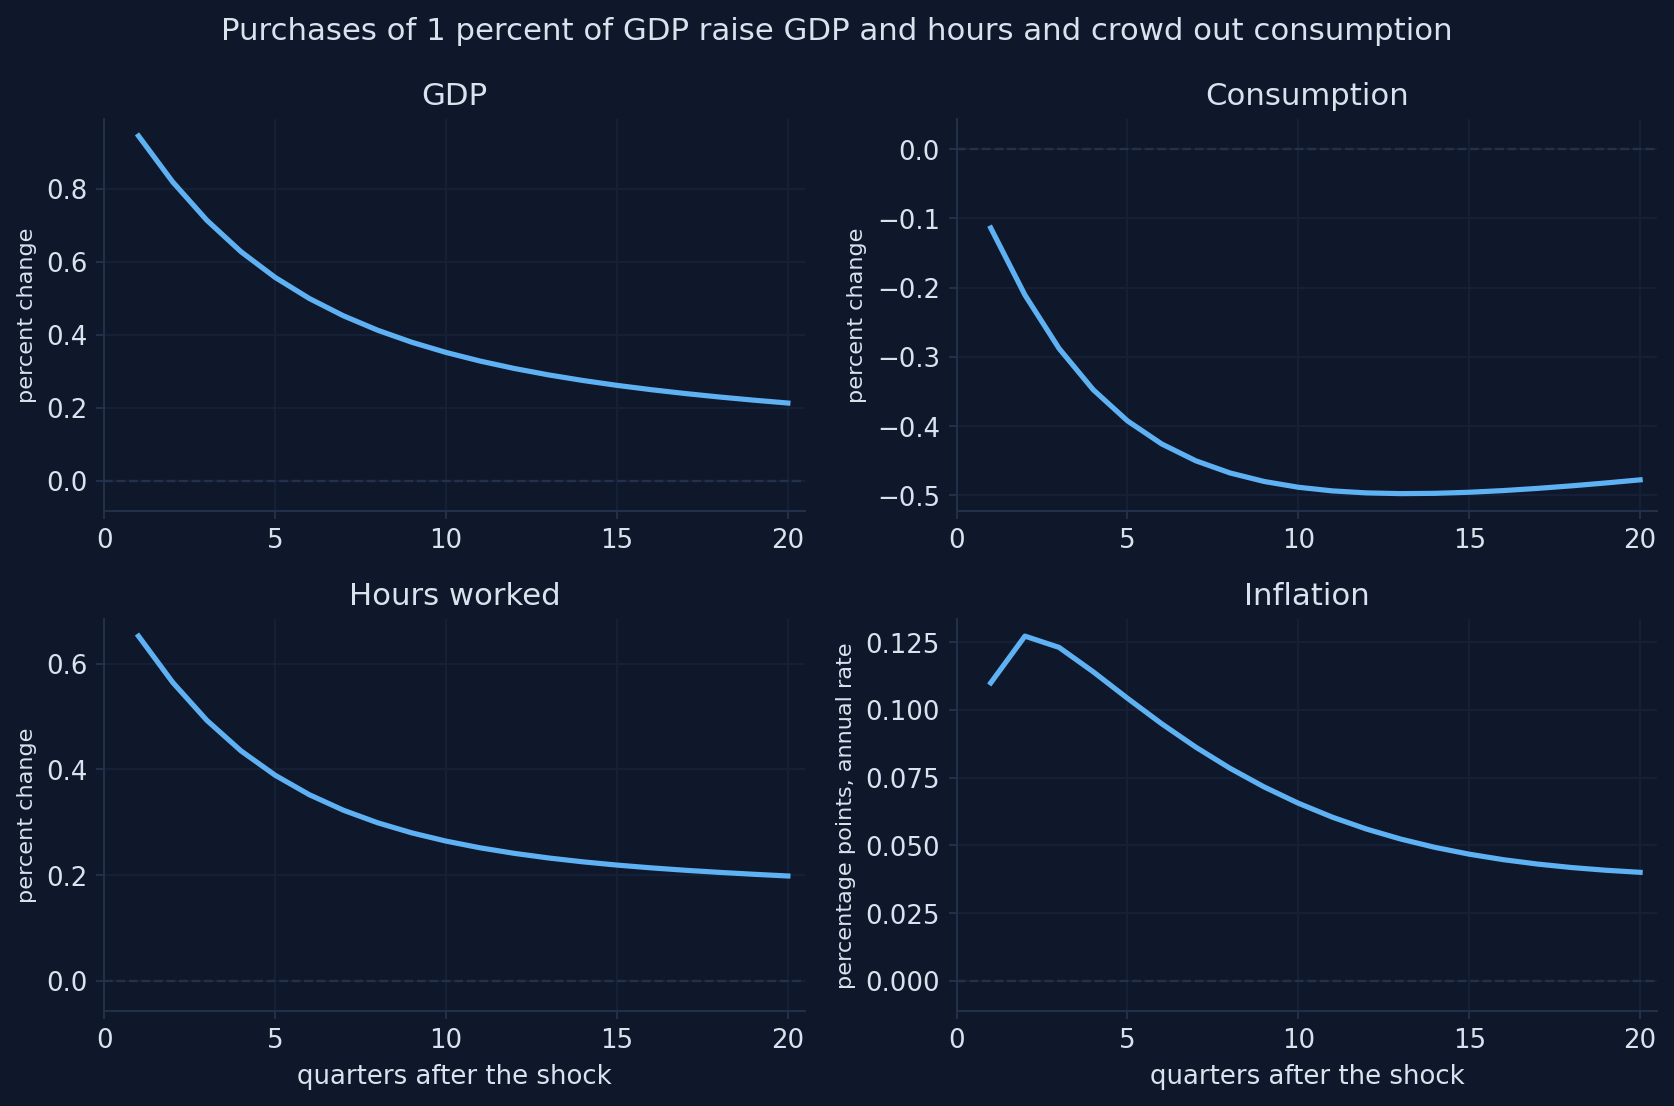
Adapted from Fig. 15.12 in Jones (2024), based on Smets and Wouters (2007); computed with Snowdrop’s model file and the published estimates. Appendix H, Section H.8.
The multiplier is 0.94 on impact, and falls as consumption is crowded out
Multiplier over  1 quarters: 0.94
Multiplier over  4 quarters: 0.80
Multiplier over  8 quarters: 0.68
Multiplier over 20 quarters: 0.52- close to the textbook’s “around 1” in the short run
- cumulative multipliers add up GDP and purchases over several quarters
- consumption falls: future taxes make households poorer (Ch. 15)
- hours rise: poorer households work more
“More government purchases mean more consumption”
“Government purchases raise consumption, so the multiplier must be above 1.”
Here consumption falls (to −0.50 percent): the wealth effect of future taxes crowds it out, and the multiplier stays below 1.
Short-lived spending crowds out less
Make the spending rise short-lived: crhog = 0.5 instead of 0.98.
- a short rise costs little in lifetime taxes, so the wealth effect is small
- consumption no longer falls: it even rises a little with the extra income from work
- the impact multiplier rises to about 1.1
What matters for consumption is lifetime wealth (Ch. 16): persistent spending crowds out more.
What does a rise in the risk premium do?
Households now borrow and save at a rate above the funds rate: the financial friction of the textbook’s last Smets–Wouters chart. The wedge dies out fast (\(\rho_b = 0.18\)).
Which variable falls most: GDP, consumption, hours or inflation? Compared with a monetary tightening, are the effects larger at once or later?
A higher risk premium lowers consumption most
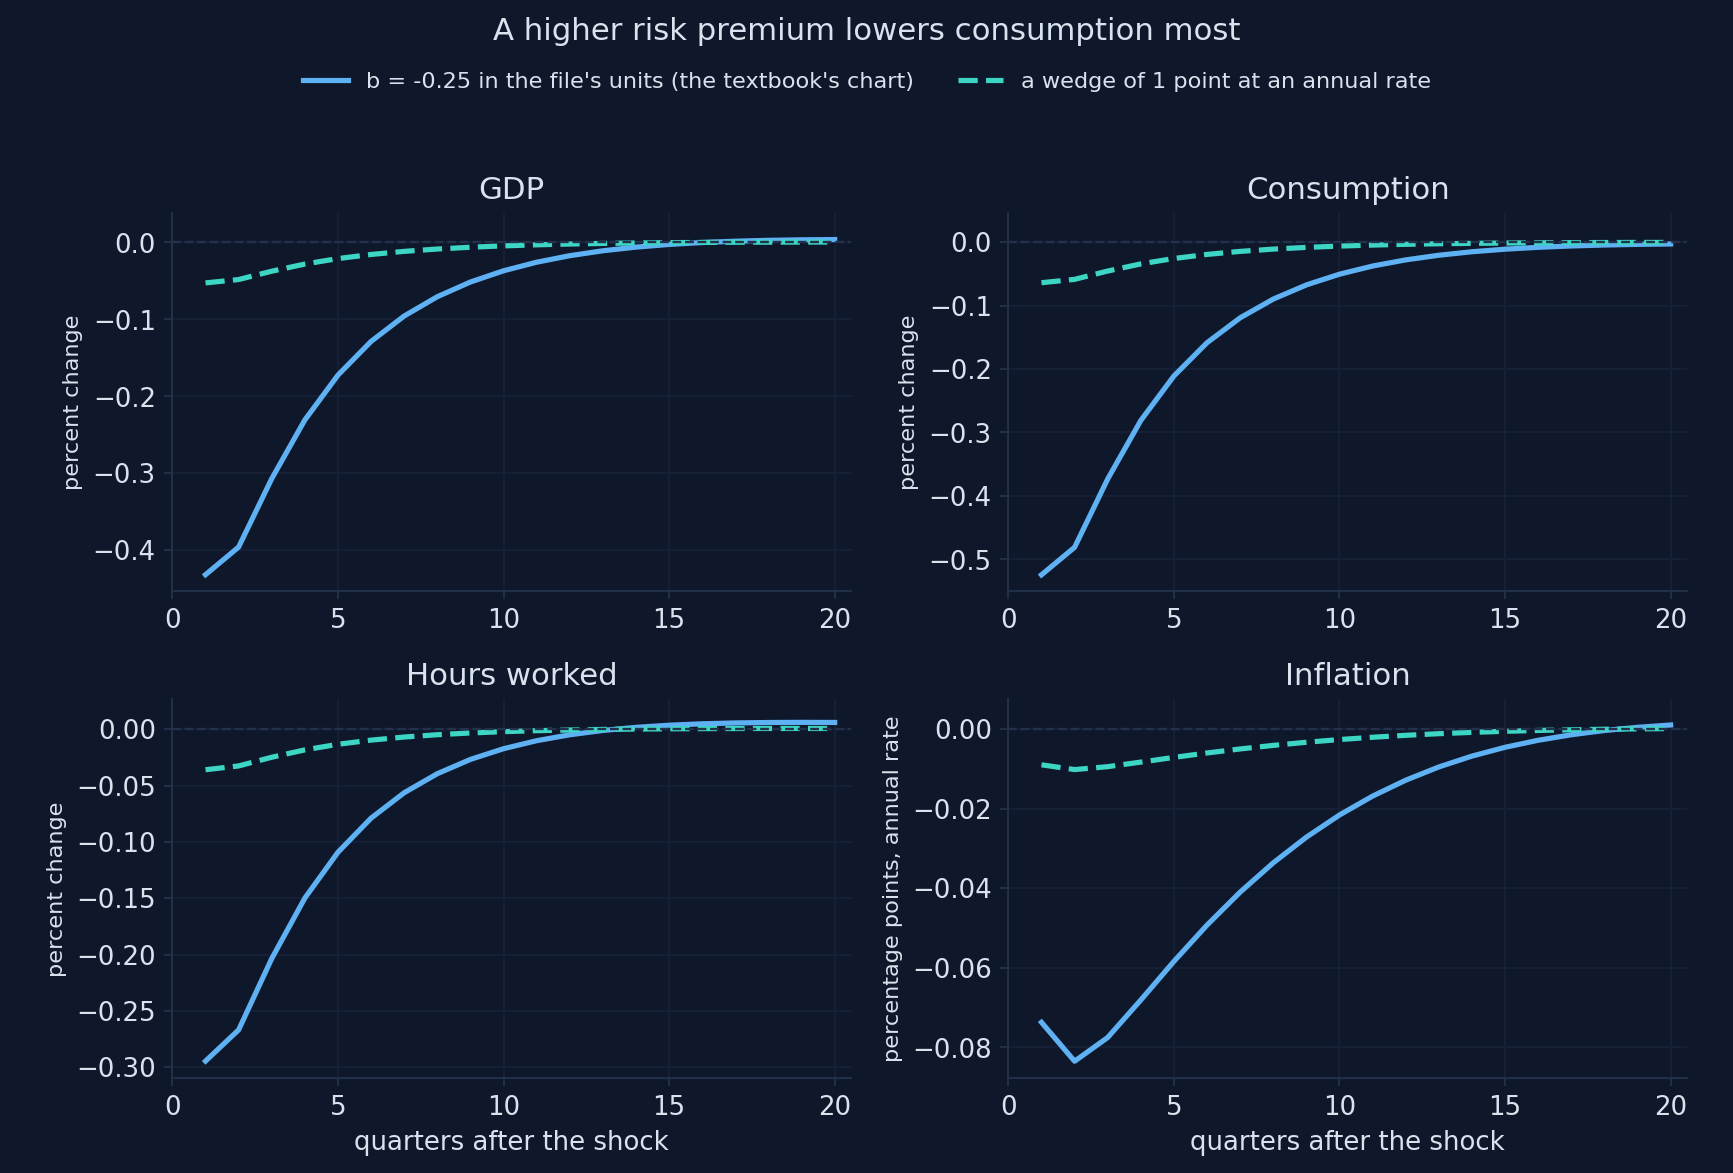
Adapted from Fig. 15.13 in Jones (2024), based on Smets and Wouters (2007); computed with Snowdrop’s model file and the published estimates. Appendix H, Section H.9.
Units matter: the textbook’s chart is a wedge of 8 points a year, not 1
| Jones (2024), read off the chart | \(b = -0.25\) (solid) | 1-point wedge (dashed) | |
|---|---|---|---|
| GDP (%) | −0.47 | −0.43 | −0.05 |
| consumption (%) | −0.55 | −0.52 | −0.06 |
| hours (%) | −0.31 | −0.29 | −0.04 |
| inflation (points) | −0.12 | −0.07 | −0.01 |
\(b = -0.25\) is a wedge of \(0.25/c_3 = 2.05\) points per quarter, 8.2 at an annual rate. The shape matches; the caption’s “1 point” does not.
A persistent wedge turns a small premium into a recession
Give the 1-point wedge again, but let it last: crhob = 0.7 instead of 0.18.
- GDP now falls by about 0.19 percent, with a trough in quarter 3
- almost four times more than with the estimated persistence
- about half the effect of a monetary surprise of the same size
Financial crises are not short-lived: the reason models built after 2008 (Ch. 14) put financial frictions at their center.
The same direction as a monetary shock, a different timing
Risk premium
- hits consumption directly
- dies out fast (\(\rho_b = 0.18\))
- effects largest at once
Monetary policy
- works through a smoothed policy rate
- the rate stays high for a year
- effects build up to a trough in quarter 4
Both raise the rate households face, so both lower consumption, GDP, hours and inflation.
A shock the textbook does not show: investment becomes more efficient
An investment-specific shock: each unit of investment goods turns into more capital (a typical, 1 s.d. surprise).
Does it look like a supply shock (output up, inflation down) or a demand shock (output up, inflation up)? What happens to consumption at first?
More efficient investment raises investment and GDP
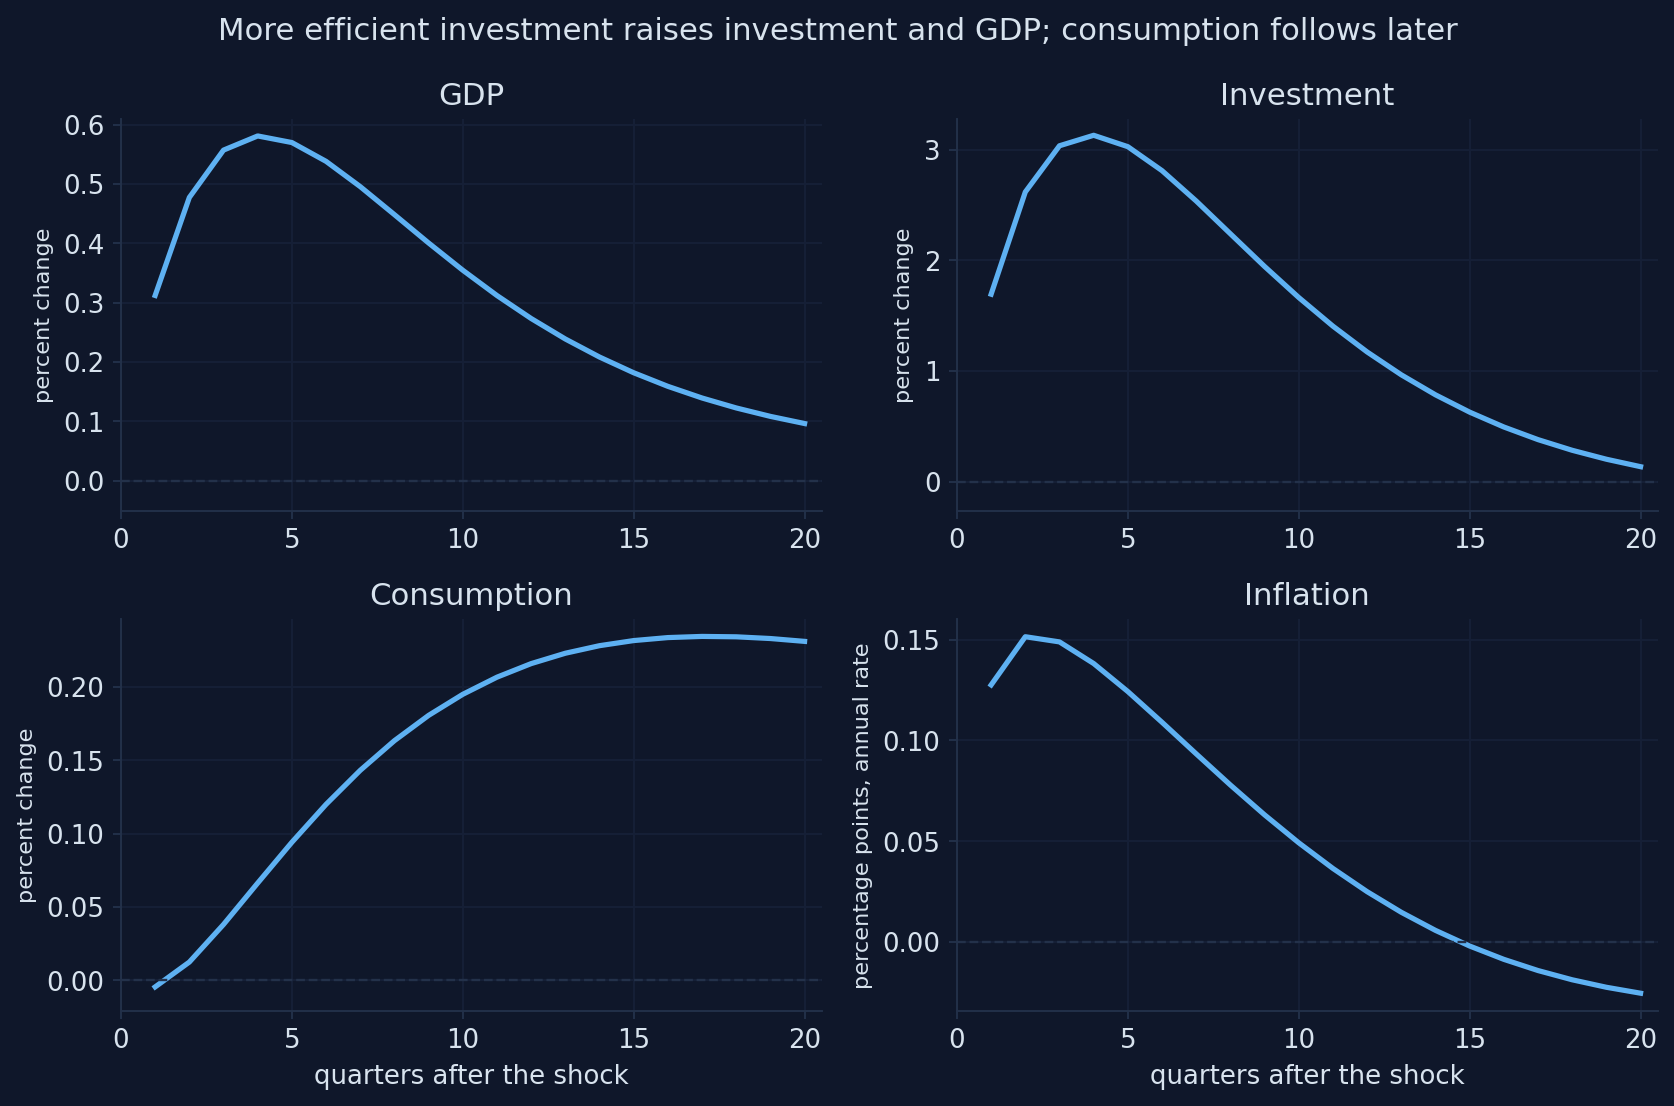
Computed with Snowdrop’s model file and the estimates of Smets and Wouters (2007); a typical (1 s.d.) shock; related to Chapter 15 of Jones (2024). Appendix H, Section H.10.
Seven shocks, one menu: compare their shapes
Computed for this deck with the notebook’s model file, the estimates of Smets and Wouters (2007) and its functions load_sw and irf (20 quarters; the book’s units). Appendix H.
Demand-like and supply-like shocks, from the first quarter
| Shock | GDP, quarter 1 | Inflation, quarter 1 | Type |
|---|---|---|---|
| monetary tightening | −0.20 | −0.16 | demand |
| government purchases | +0.94 | +0.11 | demand |
| risk premium (the textbook’s chart) | −0.43 | −0.07 | demand |
| investment-specific (1 s.d.) | +0.31 | +0.13 | demand |
| TFP | +0.73 | −0.48 | supply |
| price markup (1 s.d.) | −0.11 | +0.97 | supply |
| wage markup (1 s.d.) | −0.04 | +0.51 | supply |
Demand shocks move output and inflation together; supply shocks move them apart and force the central bank to choose.
Act III in one table: Chapter 15’s charts, recomputed
| Shock (textbook size) | Model shock | Key numbers | Jones (2024) |
|---|---|---|---|
| Funds rate +1 point | \(\eta^r = 0.25\) | GDP −0.20 → −0.35 (q4); inflation −0.20 | −0.2 → −0.33 (q3–4) |
| TFP +1 percent | \(\eta^a = 1\) | GDP peak 1.49 (q8); hours −0.63 at first | GDP peak above 1; hours fall |
| Purchases +1 percent | \(\eta^g = 1\) (of GDP) | multiplier 0.94; consumption to −0.50 | multiplier around 1 |
| Financial friction | \(b = -0.25\) | consumption −0.52, GDP −0.43 | −0.55, −0.47 |
| Investment-specific | 1 s.d. | investment +3, GDP +0.6 | not shown |
Which frictions matter?
Act IV
An experiment: change one parameter, solve again, compare
def experiment(parameter, values, shock, size):
    """Impulse responses to one shock for several values of one parameter."""
    runs = []
    for j, value in enumerate(values):
        model = load_sw({parameter: value}, file="sw_experiment.yaml")
        label = f"{parameter} = {value}"
        runs.append((label, irf(model, shock, size)))
    return runs

runs = experiment("cprobp", [0.6563, 0.5, 0.3, 0.1], "ea", 1.0)
Chapter 15 explained each pattern with one friction. In a model with all frictions at once, we can test those explanations.
If prices were less sticky, would hours still fall after a TFP shock?
The Calvo parameter \(\xi_p\) falls from its estimate, 0.66 (a price lasts about 3 quarters), to 0.1 (prices reset almost every quarter).
Chapter 15 blames the fall in hours on sticky prices. With \(\xi_p = 0.1\), do hours rise at once, fall less, or fall as much?
Less sticky prices raise GDP faster, but hours still fall at first
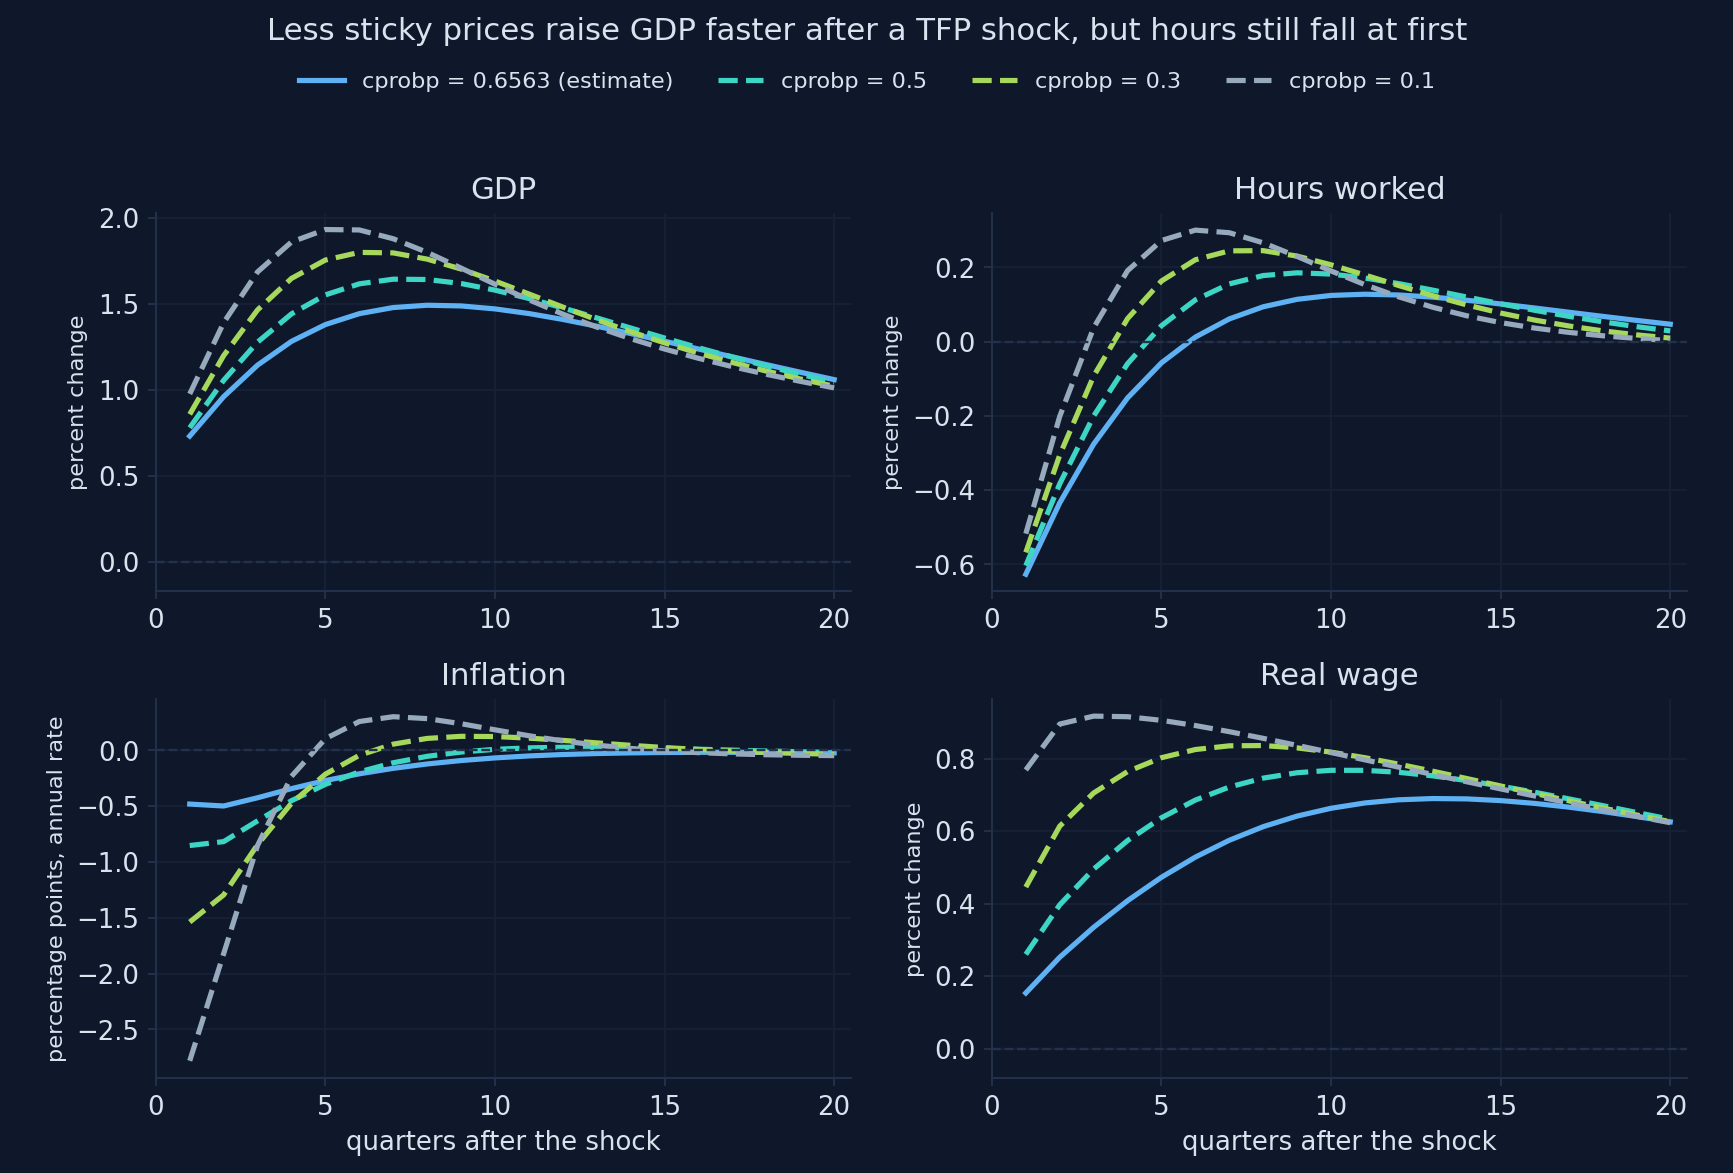
Computed with Snowdrop’s model file and the estimates of Smets and Wouters (2007); related to Fig. 10 of Chapter 15. Appendix H, Section H.11.
Hours fall even in the model’s flexible economy
| Largest GDP | Hours in quarter 1 | |
|---|---|---|
| \(\xi_p = 0.66\) (estimate) | 1.49 | −0.63 |
| \(\xi_p = 0.5\) | 1.64 | −0.60 |
| \(\xi_p = 0.3\) | 1.80 | −0.57 |
| \(\xi_p = 0.1\) | 1.93 | −0.52 |
| flexible prices and wages | 1.59 | −0.43 |
Sticky prices make the fall in hours larger, but they are not its only cause.
Move the Calvo parameter yourself
Computed for this deck with the notebook’s model file, the estimates of Smets and Wouters (2007) and its functions load_sw and irf (a TFP shock of 1 percent; dotted: the model’s flexible economy). Appendix H.
Hours stop falling only when the real frictions are weak too
| Largest GDP | Hours, quarter 1 | Hours, quarter 2 | |
|---|---|---|---|
| estimated model | 1.49 | −0.63 | −0.43 |
| flexible prices and wages | 1.65 | −0.54 | −0.27 |
| … and weak habits and adjustment costs | 1.83 | −0.15 | +0.07 |
The textbook’s simple labor market, with no habits and no adjustment costs, is close to the last row.
One friction at a time: none removes the fall in hours on its own
| Change (TFP shock) | Hours in quarter 1 |
|---|---|
| estimated model | −0.63 |
| weak habits only (\(h = 0.1\)) | about −0.3: the most |
| flexible prices only (\(\xi_p = 0.1\)) | −0.52 |
| low adjustment costs only (\(\varphi = 2\)) | almost unchanged |
| all of them weak | −0.15, positive from quarter 2 |
The frictions reinforce each other: demand rises slowly when any of them is strong.
Sticky prices are not the whole story behind the fall in hours
“Hours fall after a TFP shock because prices are sticky; with flexible prices they would rise.”
In the estimated model, hours fall with flexible prices and wages too (−0.43). Habits and adjustment costs slow demand, and the wealth effect lowers labor supply.
If wages were less sticky, what would a tightening do to the real wage?
The Calvo wage parameter \(\xi_w\) falls from 0.74 to 0.5 and 0.3. The shock is a monetary tightening.
Does the real wage fall more or less? Do GDP and hours fall more or less?
Flexible wages: inflation and the real wage fall more
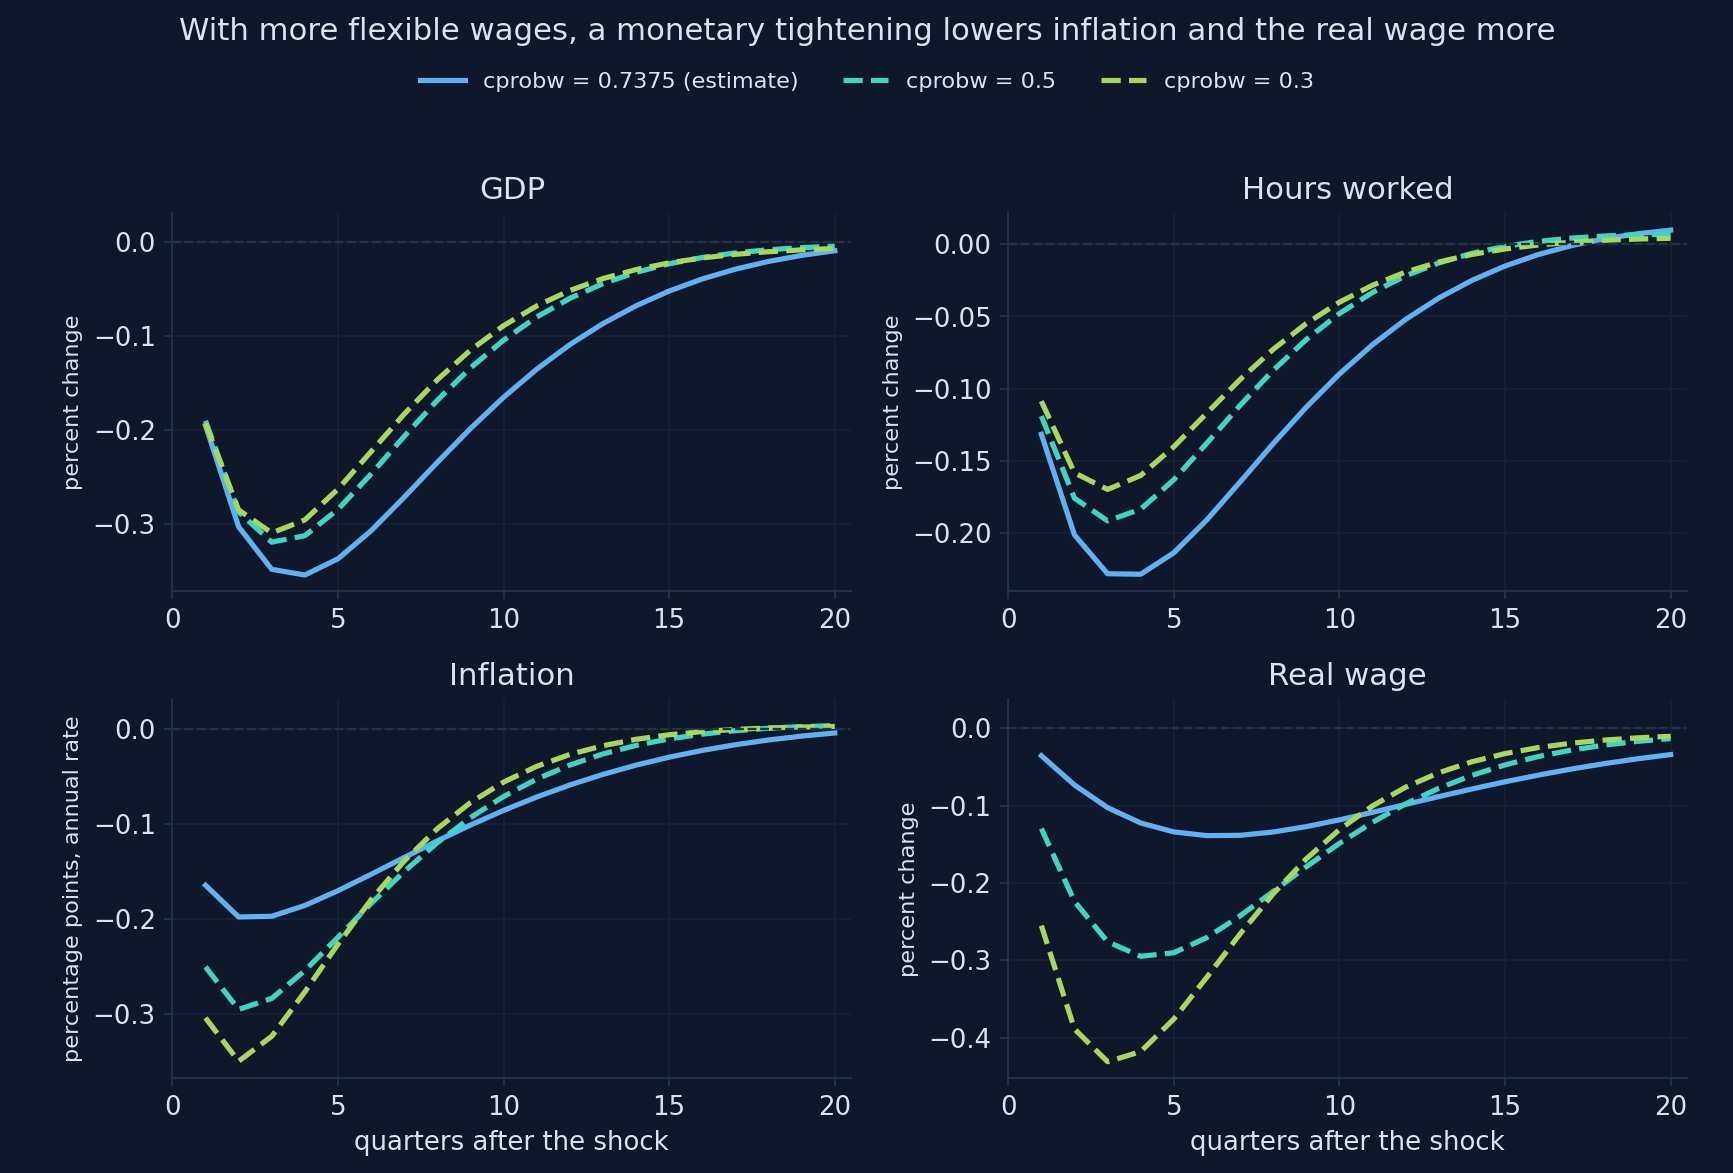
Computed with Snowdrop’s model file and the estimates of Smets and Wouters (2007); related to Figs. 6 and 7 of Chapter 15. Appendix H, Section H.11.
Flexible wages move prices; sticky wages move quantities
| GDP | Hours | Inflation | Real wage | |
|---|---|---|---|---|
| \(\xi_w = 0.74\) (estimate) | −0.35 | −0.23 | −0.20 | −0.14 |
| \(\xi_w = 0.5\) | −0.32 | −0.19 | −0.30 | −0.29 |
| \(\xi_w = 0.3\) | −0.31 | −0.17 | −0.35 | −0.43 |
With prices sticky too, the real wage falls with employment here, unlike Chapter 15’s sticky-wage-only case: both nominal frictions together decide its sign.
Which friction drives the fall in consumption after a tightening?
Jones (2024) points to investment adjustment costs. We lower the adjustment cost \(\varphi\) from 5.49 to 2, and the habit \(h\) from 0.71 to 0.1, one at a time.
Which change moves the consumption response more: weaker adjustment costs or weaker habits? Which moves investment more?
Weaker habits make consumption fall more, and sooner
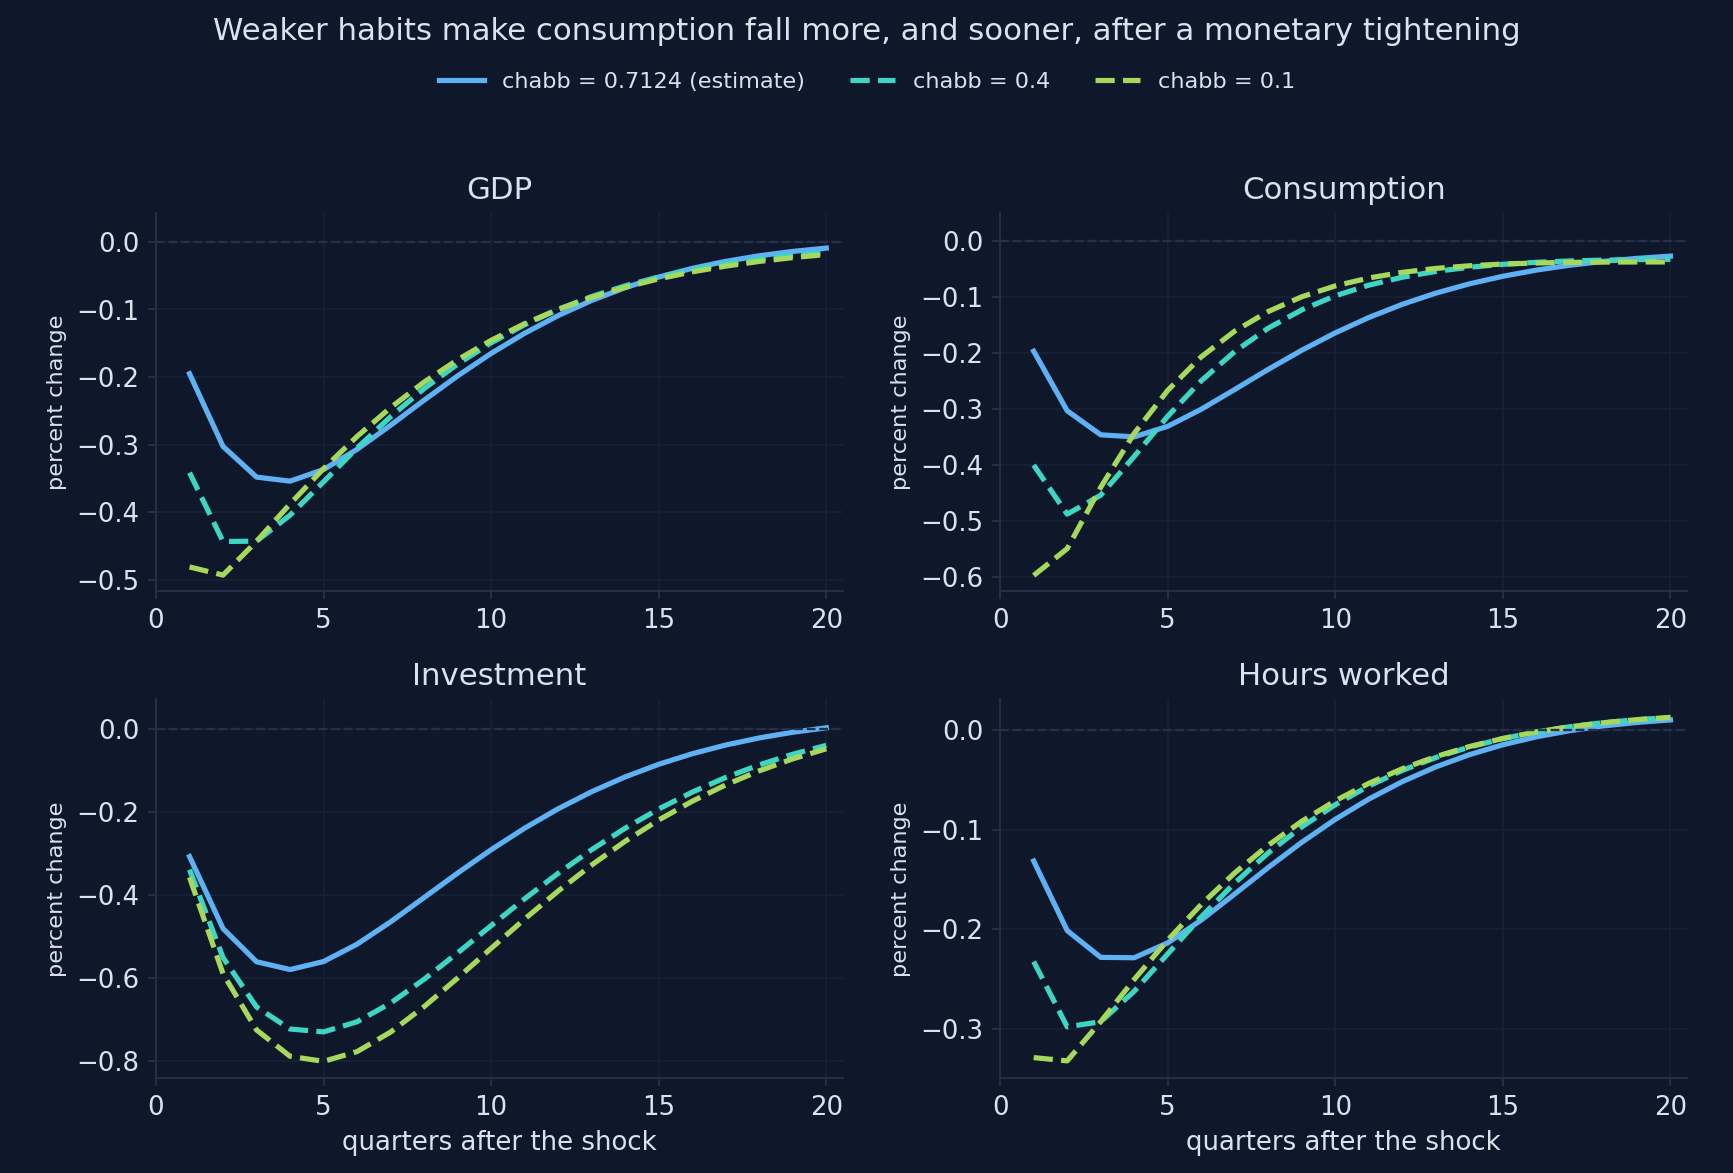
Computed with Snowdrop’s model file and the estimates of Smets and Wouters (2007); related to Chapter 15 of Jones (2024). Appendix H, Section H.11.
Move the habit parameter
Computed for this deck with the notebook’s model file, the estimates of Smets and Wouters (2007) and its functions load_sw and irf (a monetary shock of 1 point at an annual rate). Appendix H.
Move the adjustment cost
Computed for this deck with the notebook’s model file, the estimates of Smets and Wouters (2007) and its functions load_sw and irf (a monetary shock of 1 point at an annual rate). Appendix H.
Habits shape consumption; adjustment costs shape investment
| GDP | Consumption | Investment | |
|---|---|---|---|
| estimate (\(\varphi = 5.49\), \(h = 0.71\)) | −0.35 | −0.35 | −0.58 |
| \(\varphi = 2\) | −0.45 | −0.35 | −1.08 |
| \(\varphi = 10\) | −0.32 | −0.35 | −0.38 |
| \(h = 0.4\) | −0.44 | −0.49 | −0.73 |
| \(h = 0.1\) | −0.49 | −0.60 | −0.80 |
Consumption falls about as much as GDP because GDP falls less: investment is held back by its costs, and utilization absorbs part of the shock.
Why does a short-lived policy surprise move GDP for two years?
The monetary surprise dies out in a quarter (\(\rho_r = 0.13\)), yet GDP is lowest after a year. The Taylor rule smooths the rate with \(\rho = 0.82\).
Without smoothing (\(\rho = 0\)), how large would the fall in GDP be: about the same, half, or much smaller?
Without smoothing, a policy surprise is over in a quarter
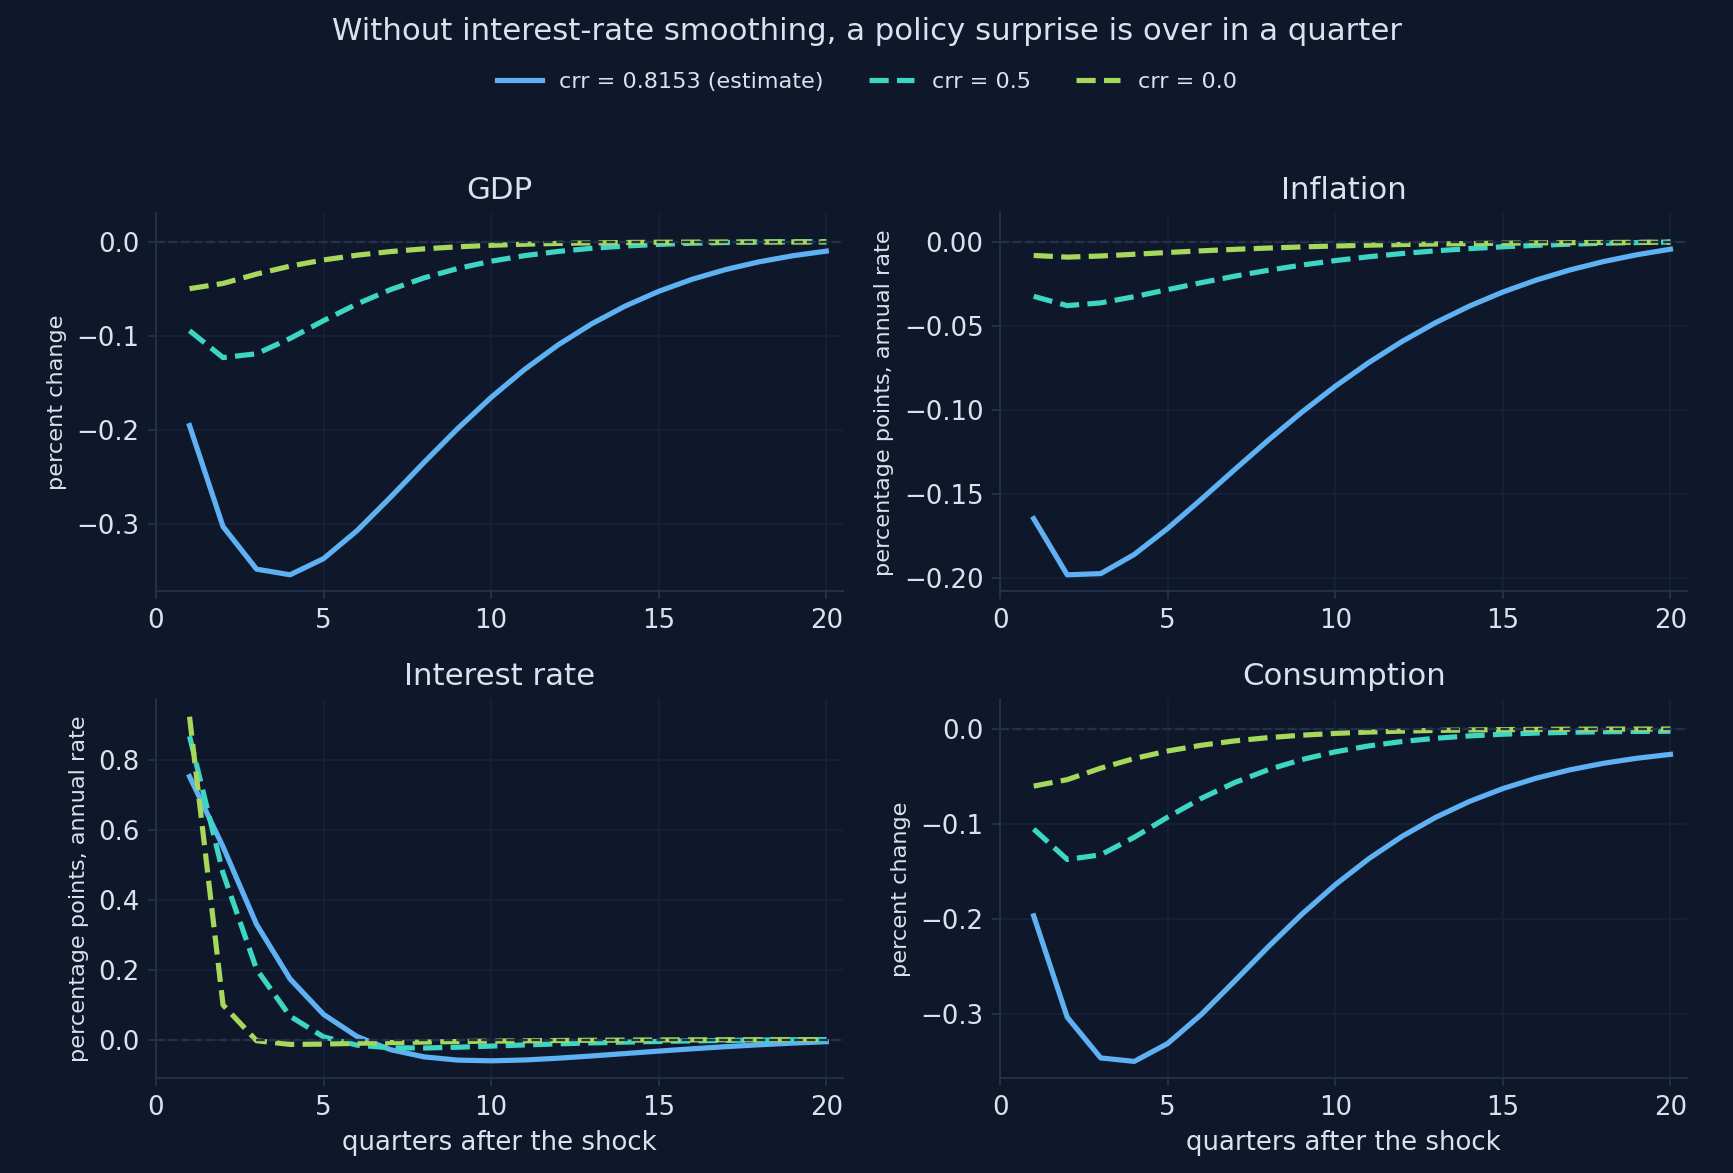
Computed with Snowdrop’s model file and the estimates of Smets and Wouters (2007); related to Chapters 12 and 13 of Jones (2024). Appendix H, Section H.11.
Move the smoothing parameter
Computed for this deck with the notebook’s model file, the estimates of Smets and Wouters (2007) and its functions load_sw and irf (a monetary shock of 1 point at an annual rate). Appendix H.
Smoothing carries the policy surprise; a stronger inflation response dampens it
| Largest fall in GDP | Largest fall in inflation | |
|---|---|---|
| estimate (\(\rho = 0.82\), \(r_\pi = 2.03\)) | −0.35 | −0.20 |
| \(\rho = 0.5\) | −0.12 | −0.04 |
| \(\rho = 0\) | −0.05 | −0.01 |
| \(r_\pi = 1.5\) | −0.41 | −0.26 |
| \(r_\pi = 3\) | −0.30 | −0.14 |
It is the expected path of rates, not one quarter’s rate, that moves consumption and investment.
What does a rise in firms’ markups do?
A typical price markup surprise, and a typical wage markup surprise (1 s.d. each). The central bank follows its Taylor rule.
What happens to inflation and to GDP? Which of the two shocks lasts longer, given \(\rho_p = 0.90\) with a large moving-average term and \(\rho_w = 0.97\)?
Markup shocks raise inflation and lower output: Chapter 13’s cost shocks
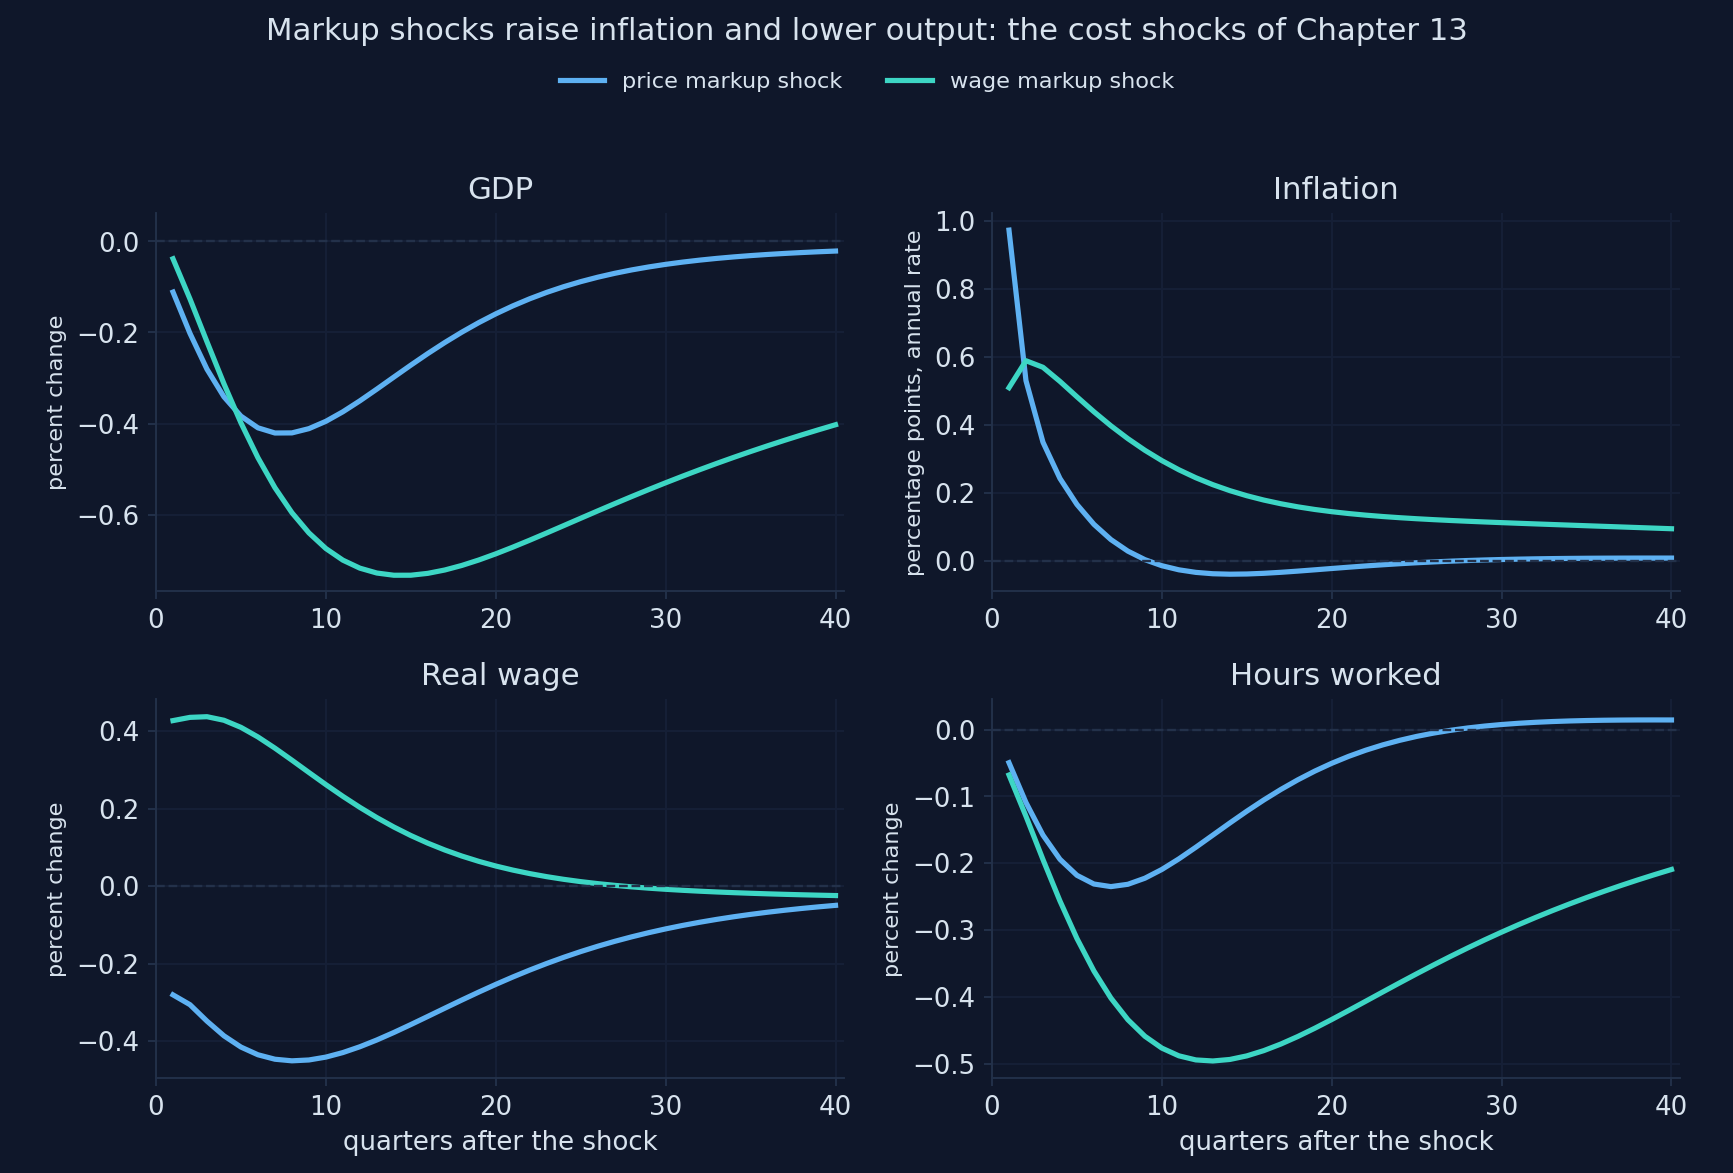
Computed with Snowdrop’s model file and the estimates of Smets and Wouters (2007); typical (1 s.d.) shocks; related to Chapter 13 of Jones (2024). Appendix H, Section H.10.
Two supply shocks with different lives
Price markup
- inflation up about 1 point at once
- back to normal within two years
- the real wage falls: prices rise faster than wages
Wage markup
- raises the real wage
- lasts much longer (\(\rho_w = 0.97\))
- lowers GDP and hours for years
In Smets and Wouters’ variance decompositions, markup shocks explain most movements of inflation, and the wage markup a large part of output at long horizons.
Fighting a markup shock: a stronger response lowers inflation and costs output
The central bank chooses how hard to fight the inflation of a price markup shock: crpi = 1.5 or 3.
- a stronger response lowers inflation a little
- and costs more output
- with a supply shock, the central bank cannot stabilize both
The trade-off of Chapter 13’s Phillips curve, inside an estimated model.
The file’s own numbers make a monetary shock almost twice as strong
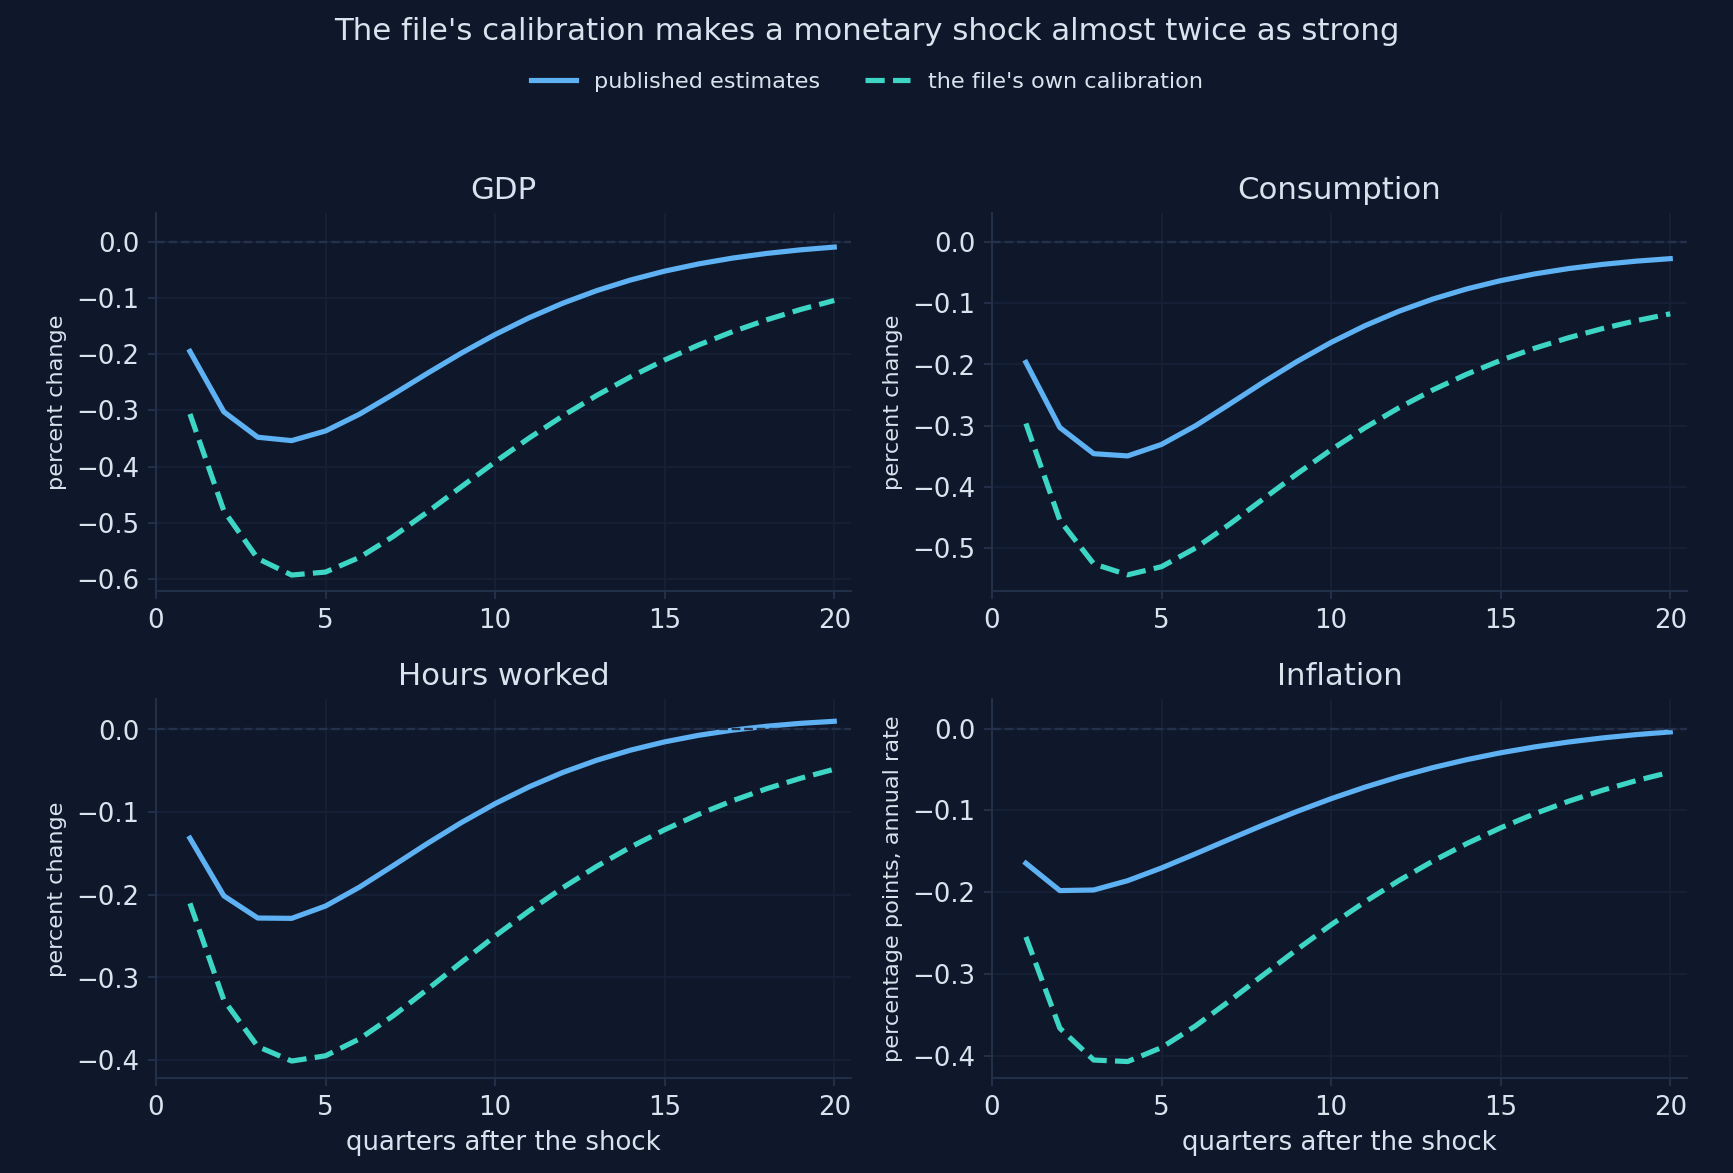
Computed with Snowdrop’s model file, its own calibration and the estimates of Smets and Wouters (2007); related to Chapter 15 of Jones (2024). Appendix H, Section H.12.
The corrected equation barely matters; the numbers matter a lot
| GDP after monetary | Inflation after monetary | Investment after investment shock | |
|---|---|---|---|
| estimates, corrected (H.6) | −0.354 | −0.198 | 3.129 |
| estimates, as published | −0.354 | −0.198 | 3.169 |
| file’s calibration, corrected | −0.593 | −0.407 | 3.391 |
A file with the right equations and the wrong numbers gives confident, wrong answers. Compare its numbers with the source it claims to follow.
The frictions work together
Hours after TFP
fall with sticky prices, fall less with flexible prices, stop falling only when habits and adjustment costs are weak too
Consumption after a tightening
shaped by habits; adjustment costs move investment instead
The size of a policy surprise
carried by smoothing: without it, GDP falls 0.05, not 0.35
Supply shocks
markups raise inflation and lower output; the rule trades one off against the other
No single friction explains the patterns of Chapter 15.
Act IV in one table: the experiments
| Experiment | Change | Result |
|---|---|---|
| Sticky prices, TFP shock | \(\xi_p\): 0.66 → 0.1 | hours −0.63 → −0.52; flexible economy −0.43 |
| All frictions weak, TFP | + \(h = 0.1\), \(\varphi = 2\) | hours −0.15 at first, positive from quarter 2 |
| Sticky wages, monetary | \(\xi_w\): 0.74 → 0.3 | real wage −0.14 → −0.43; inflation −0.20 → −0.35 |
| Habits, monetary | \(h\): 0.71 → 0.1 | consumption −0.35 → −0.60, at once |
| Adjustment costs, monetary | \(\varphi\): 5.49 → 2 | investment −0.58 → −1.08; consumption unchanged |
| Smoothing, monetary | \(\rho\): 0.82 → 0 | GDP −0.35 → −0.05 |
| File’s calibration, monetary | all 29 values | GDP −0.35 → −0.59 |
“With seven shocks and dozens of frictions, the model can fit anything”
A skeptic says: “Smets and Wouters let the data choose seven shocks and many frictions. Of course the model fits. But some ‘shocks’, like the wage markup shock that drives output at long horizons, have no clear meaning, so the model’s stories about causes cannot be trusted for policy.”
Reply: the criticism is serious and contested. Chari, Kehoe and McGrattan (2009) argue that several shocks are not structural, so policy conclusions are fragile. Del Negro, Schorfheide, Smets and Wouters (2007) test the model against less restricted versions and find its fit good but not perfect, with clear signs of misspecification. Defenders reply that each friction is disciplined by evidence (Christiano, Eichenbaum and Trabandt, 2018). What this deck practiced (switching frictions off and watching what changes) is how you find out which conclusions depend on which assumptions.
Common errors, and how to fix them
| What you see | Why | What to do |
|---|---|---|
could not convert string to float: 'inv_gamma_pdf' |
the estimation block’s layout | remove the block, as write_sw does |
| a plausible chart, residual 0.02 | Klein fails on this model | Solver="AndersonMoore"; check residuals |
| “unable to find solution” | Villemot fails on this model | Anderson–Moore or Binder–Pesaran |
| a parameter change has no effect | derived values computed at import | write the file again: load_sw({...}) |
| risk premium: wrong sign or size | the file’s b is \(-c_3\varepsilon^b\) |
a rise of \(x\) points is b \(= -c_3 x\) |
| responses 4 times off | rates are quarterly in the model | × 4 for annual rates, as irf does |
| a crash after setting a Calvo parameter to 0 or 1 | \(\xi\) is in a denominator | values strictly between 0 and 1 |
Go further: estimate it, derive it, and see where it is used
Estimate
- the steps of Appendix G.11–G.12: seven series, measurement equations, priors,
estimate - the data: the replication files, or FRED (Appendix B)
- 36 parameters and a flat likelihood in some directions: a long run
Derive and use
- the derivations: Smets and Wouters (2007) and its online appendix; Galí (2015); Del Negro and Schorfheide (2012)
- why each friction: Christiano, Eichenbaum and Evans (2005)
- a euro-area version (Smets and Wouters, 2003); the New York Fed’s model (Del Negro et al., 2013)
What to remember from this appendix
- I. The Smets–Wouters model is 14 log-linear equations in 5 blocks; each one extends a Chapter 15 idea, and the model file differs from the paper in its numbers, one equation and one shock’s units
- II. Snowdrop solves it in a fraction of a second, but only checking the residuals showed that one solver was wrong; rates are quarterly, so units need care
- III. With the published estimates, the model reproduces the textbook’s monetary, TFP and purchases charts almost number for number, and the financial-friction chart once its units are understood
- IV. The frictions work together: hours fall after TFP even with flexible prices; habits shape consumption, adjustment costs investment; smoothing carries policy surprises
The model joins Chapter 15’s pieces and reproduces its charts, once the solver, the file and the units are checked; no single friction explains the patterns
Open the Appendix H notebook in Colab and run every experiment yourself
Sources: figures, model and software
- Recomputed textbook charts (monetary policy: GDP and four panels; TFP; government purchases; financial friction). Adapted from Figs. 15.9–15.13 in Jones (2024), based on Smets and Wouters (2007); computed with Snowdrop’s model file and the published estimates; Appendix H, Sections H.6–H.9.
- Other charts (TFP over ten years; investment-specific and markup shocks; the four friction experiments; the file’s calibration). Our computations in Appendix H, Sections H.7 and H.10–H.12.
- Live charts (five). Built for this deck with the notebook’s functions
load_swandirf; they reproduce the notebook’s printed numbers. - Parameters. The posterior mode of Smets and Wouters (2007, Table 1), from the mode file of Pfeifer’s replication (github.com/JohannesPfeifer/DSGE_mod).
- Model file.
supplements/models/COVID19/sw_model.yamlin Snowdrop, with the equation-(8) factor restored (Del Negro and Schorfheide, 2012). - Software. Snowdrop, commit 47a63b2 of 3 October 2026, github.com/gumilevskij/Framework (GNU GPL).
- Book appendix. Data Science and Macroeconomic Models, Appendix H: The DSGE Model of Smets and Wouters.
Sources: research cited
- Chari, V. V., Kehoe, P. J., and McGrattan, E. R. (2009). New Keynesian models: not yet useful for policy analysis. American Economic Journal: Macroeconomics 1(1), 242–266.
- Christiano, L. J., Eichenbaum, M., and Evans, C. L. (2005). Nominal rigidities and the dynamic effects of a shock to monetary policy. Journal of Political Economy 113(1), 1–45.
- Christiano, L. J., Eichenbaum, M. S., and Trabandt, M. (2018). On DSGE models. Journal of Economic Perspectives 32(3), 113–140.
- Del Negro, M., and Schorfheide, F. (2012). Notes on New-Keynesian models. Unpublished notes, cited in the header of the model file.
- Del Negro, M., Schorfheide, F., Smets, F., and Wouters, R. (2007). On the fit of New Keynesian models. Journal of Business and Economic Statistics 25(2), 123–143.
- Del Negro, M., et al. (2013). The FRBNY DSGE model. Federal Reserve Bank of New York Staff Report 647.
- Galí, J. (2015). Monetary Policy, Inflation, and the Business Cycle, 2nd ed. Princeton University Press.
- Goumilevski, A., and Otterson, J. (2025). Snowdrop: Python package for DSGE modeling. Journal of Open Source Software 10(112), 8197. doi:10.21105/joss.08197
- Smets, F., and Wouters, R. (2003). An estimated dynamic stochastic general equilibrium model of the euro area. Journal of the European Economic Association 1(5), 1123–1175.
- Smets, F., and Wouters, R. (2007). Shocks and frictions in US business cycles: a Bayesian DSGE approach. American Economic Review 97(3), 586–606. doi:10.1257/aer.97.3.586
- Textbook. Jones, C. I. (2024). Macroeconomics, 6th ed. W. W. Norton (Chapter 15, and Chapters 5, 11–13, 16–17 for the pieces).