The question
Act I · The tension
Economists can’t run experiments on the economy
We can’t randomly assign people different incomes, or give one city a tax cut and another none.
So how do we measure how one economic variable moves with another? Regression — the primary tool of econometrics — turns a cloud of observed data into a line we can read.
Where we’re going
- What regression is — and why it’s econometrics’ main tool
- Load & explore economic data with pandas
- Visualize the relationship with a scatter plot
- Fit a simple regression by OLS with pyfixest
- Interpret the slope, intercept, and \(R^2\) — in economic terms
Six ideas anchor this chapter
- Regression — a statistical line of best fit through the data
- Y vs X — the outcome we explain (\(Y\)) and the explainer (\(X\))
- Intercept \(\beta_0\) · slope \(\beta_1\) — where the line starts, and how steep it is
- OLS — picks the line that minimizes the sum of squared residuals
- \(R^2\) — the share of variation in \(Y\) the line explains (0 to 1)
- Association \(\neq\) causation — regression measures how \(Y\) and \(X\) move together, not cause
The slope is almost always the number you actually care about.
From data to a fitted line
Act II · The investigation
Our question: do bigger houses sell for more?
29 house sales in Davis, California (1999). Two columns carry the story: price and size.
\[\text{price} = \beta_0 + \beta_1 \cdot \text{size} + \varepsilon\]
We want \(\beta_1\) — the predicted change in price per extra square foot. OLS chooses \(\beta_0, \beta_1\) to make the squared gaps between the dots and the line as small as possible.
Step 1 — load and explore the data with pandas
import pandas as pd                          # pandas → load & handle tabular data

# dataset: 29 house sales in Davis, CA, 1999 (price, size, bedrooms, …)
url = "https://raw.githubusercontent.com/quarcs-lab/data-open/master/AED/AED_HOUSE.DTA"
data = pd.read_stata(url)                    # read the Stata .dta into a DataFrame

data.head()                                  # peek at the first few rows
data.describe().round(2) # summary stats: mean, std, min, max, quartilesStep 2 — always visualize before you model
import pandas as pd                          # tabular data
import matplotlib.pyplot as plt               # plotting

url = "https://raw.githubusercontent.com/quarcs-lab/data-open/master/AED/AED_HOUSE.DTA"
data = pd.read_stata(url)                    # load the 29 Davis, CA house sales

fig, ax = plt.subplots(figsize=(10, 6))      # one figure + axes
ax.scatter(data["size"], data["price"],      # x = size, y = price
           s=80, alpha=0.7, color="#22d3ee") # marker size, transparency, colour
plt.show() # render the scatter plotPrice rises with size — the relationship is real but loose
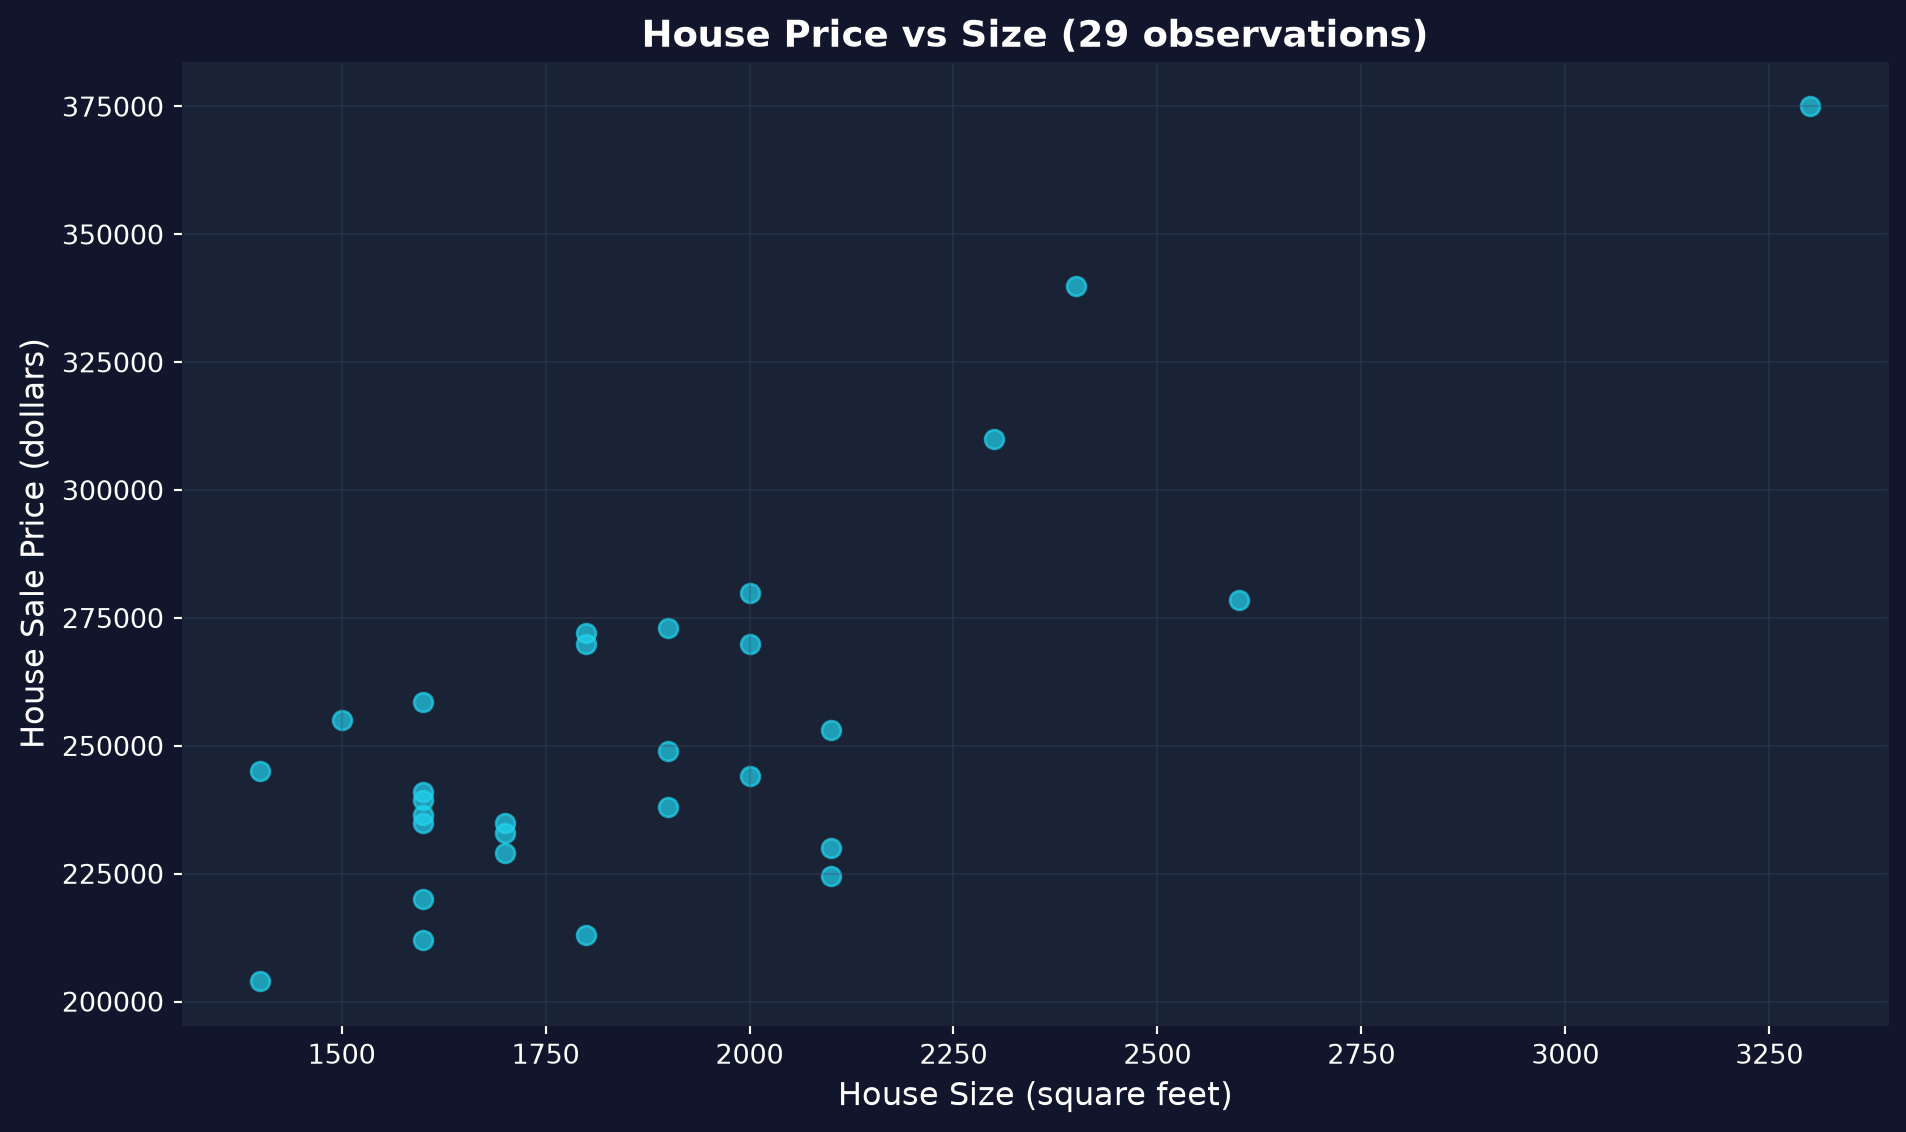
Each dot is a house. The upward drift is the relationship; the vertical scatter is everything size doesn’t explain.
A scatter plot is the honest first look — it shows direction and spread before any model.
Step 3 — fit the regression by OLS with pyfixest
!pip install -q pyfixest                     # install pyfixest in Colab (-q = quiet; not preinstalled)

import pandas as pd                          # tabular data
import pyfixest as pf                         # pyfixest → OLS regression, R-style formulas

url = "https://raw.githubusercontent.com/quarcs-lab/data-open/master/AED/AED_HOUSE.DTA"
data = pd.read_stata(url)                    # load the 29 Davis, CA house sales

fit = pf.feols("price ~ size", data=data)    # OLS: regress price on size (intercept auto-added)
fit.summary() # β0, β1, SEs, t, p, R²OLS draws the line: price = 115,017 + 73.77 × size
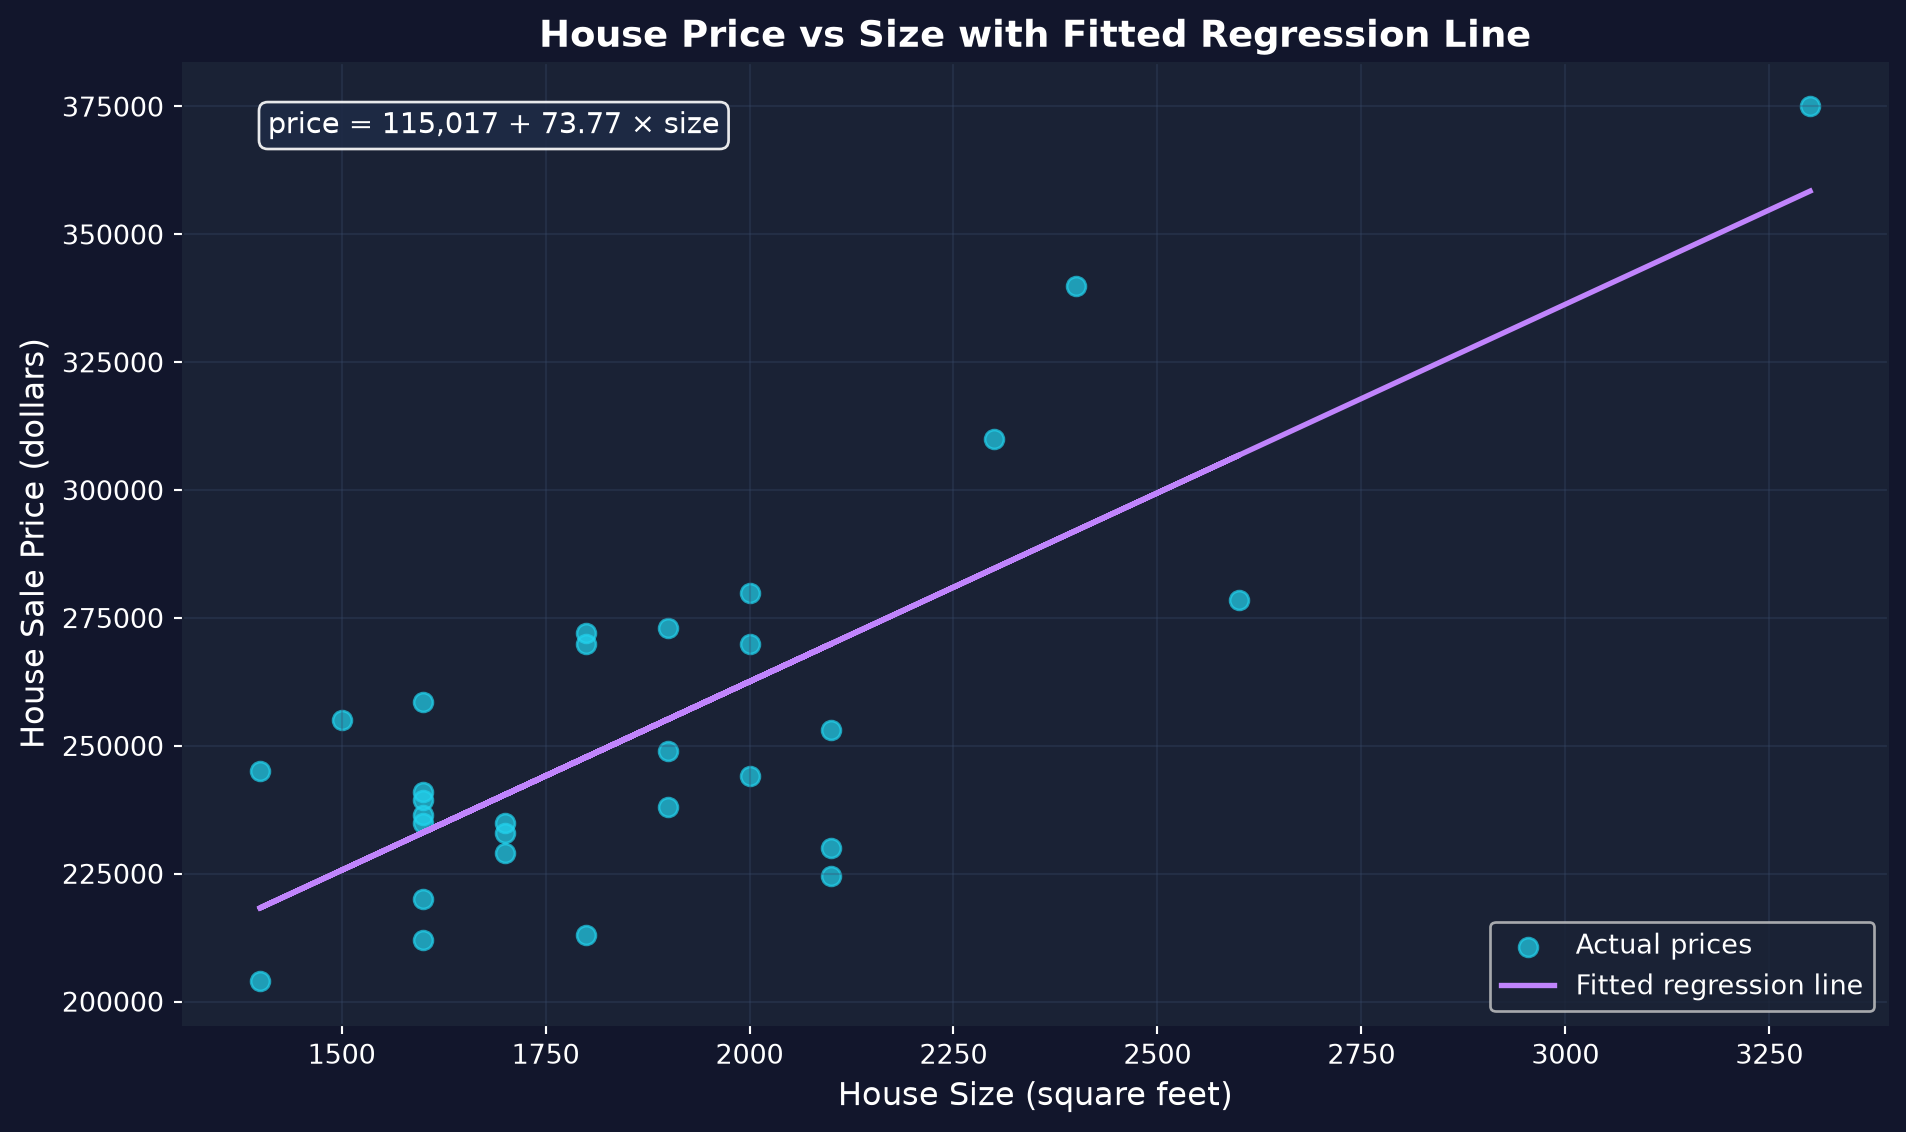
The fitted line through the cloud, with its equation.
Slope \(\beta_1 = \$73.77\)/sq ft · intercept \(\beta_0 = \$115{,}017\) · \(R^2 = 0.62\).
Reading the three numbers
- Slope \(\beta_1 = \$73.77\) — each extra square foot is associated with about $74 more in price (≈ $7,400 per 100 sq ft).
- Intercept \(\beta_0 = \$115{,}017\) — just where the line crosses \(x=0\); a 0-sq-ft house isn’t meaningful, so don’t over-read it.
- \(R^2 = 0.62\) — size alone explains about 62% of the price variation; the other 38% is location, condition, age, …
Report magnitude, not just significance: $74 per square foot is the economically meaningful finding.
Reading it right
Act III · The resolution
The tempting mistake — and the correction
Objection. “Each square foot adds $74 — so extending my house 100 sq ft adds $7,400.”
Response. Association is not causation. Bigger houses may also be better-located and better-renovated — the slope credits size for quality’s effect too. Like ice-cream sales and drownings: both rise in summer, but one doesn’t cause the other.
Regression shows how \(Y\) and \(X\) move together; a causal reading needs a design that rules out the alternatives.
What to carry forward
- Regression is econometrics’ primary tool: it quantifies how \(Y\) varies with \(X\).
- The simple model is \(y = \beta_0 + \beta_1 x + \varepsilon\); OLS minimizes squared residuals.
- The slope measures association; \(R^2\) measures fit — neither proves causation.
- The Python workflow is load → explore → visualize → model → interpret (
pandas,matplotlib,pyfixest). - Don’t extrapolate beyond the data, and don’t assume the sample generalizes.