The question
Act I · The tension
One sample mean is just one draw
You survey 30 people and get an average income of $52,000. Someone else surveys a different 30 and gets $48,000. Who is right?
Both. Each \(\bar{x}\) is one realization of a random variable \(\bar{X}\) that changes from sample to sample. This chapter asks: what does the distribution of \(\bar{X}\) look like — and how do we use it?
Where we’re going
- \(\bar{X}\) is a random variable — not a fixed number
- Its mean and variance: \(E[\bar{X}] = \mu\) and \(\operatorname{Var}[\bar{X}] = \sigma^2/n\)
- Its sampling distribution — seen through a coin-toss experiment
- The Central Limit Theorem: \(\bar{X}\) is approximately normal, even from skewed data
- The standard error \(se(\bar{X}) = s/\sqrt{n}\) — and why bigger \(n\) means sharper estimates
Six ideas anchor this chapter
- Parameter vs. statistic — \(\mu\) is fixed and unknown; \(\bar{x}\) is computed and varies
- Estimator — a rule (\(\bar{X} = \tfrac{1}{n}\sum X_i\)); an estimate is one number it returns
- Unbiasedness — \(E[\bar{X}] = \mu\): no systematic over- or under-shoot
- Efficiency — among unbiased estimators, \(\bar{X}\) has the smallest bounce
- Consistency — \(\operatorname{Var}[\bar{X}] = \sigma^2/n \to 0\), so \(\bar{X} \to \mu\) as \(n\) grows
- Law of Large Numbers — the formal guarantee behind that convergence
The number you compute is random; its distribution is what inference is built on.
From one sample to a distribution
Act II · The investigation
The experiment: 400 samples of 30 coin tosses
A fair coin has \(\mu = 0.5\) and \(\sigma^2 = 0.25\). Toss it 30 times, record the fraction of heads — that’s one \(\bar{x}\). Do it 400 times and you can watch the sampling distribution emerge.
\[\bar{X} = \frac{1}{n}\sum_{i=1}^{n} X_i, \qquad E[\bar{X}] = \mu, \qquad \operatorname{Var}[\bar{X}] = \frac{\sigma^2}{n}\]
The textbook pre-computed the 400 means for us — let’s load and summarize them first.
Step 1 — load and summarize the 400 sample means with pandas
import pandas as pd                          # pandas → load & handle tabular data
import numpy as np                           # numpy → sqrt and array math

url = "https://raw.githubusercontent.com/quarcs-lab/data-open/master/AED/AED_COINTOSSMEANS.DTA"
data = pd.read_stata(url)                    # 400 sample means, each from n = 30 tosses
xbar = data["xbar"]                          # the column of 400 sample means

print(xbar.mean())                           # empirical E[X̄]  → 0.5004
print(xbar.std())                            # empirical SD     → 0.0887

print(np.sqrt(0.25 / 30))                    # theoretical σ/√n → 0.0913
data.describe().round(4) # full summary of the 400 meansThe 400 means pile up in a bell around 0.5
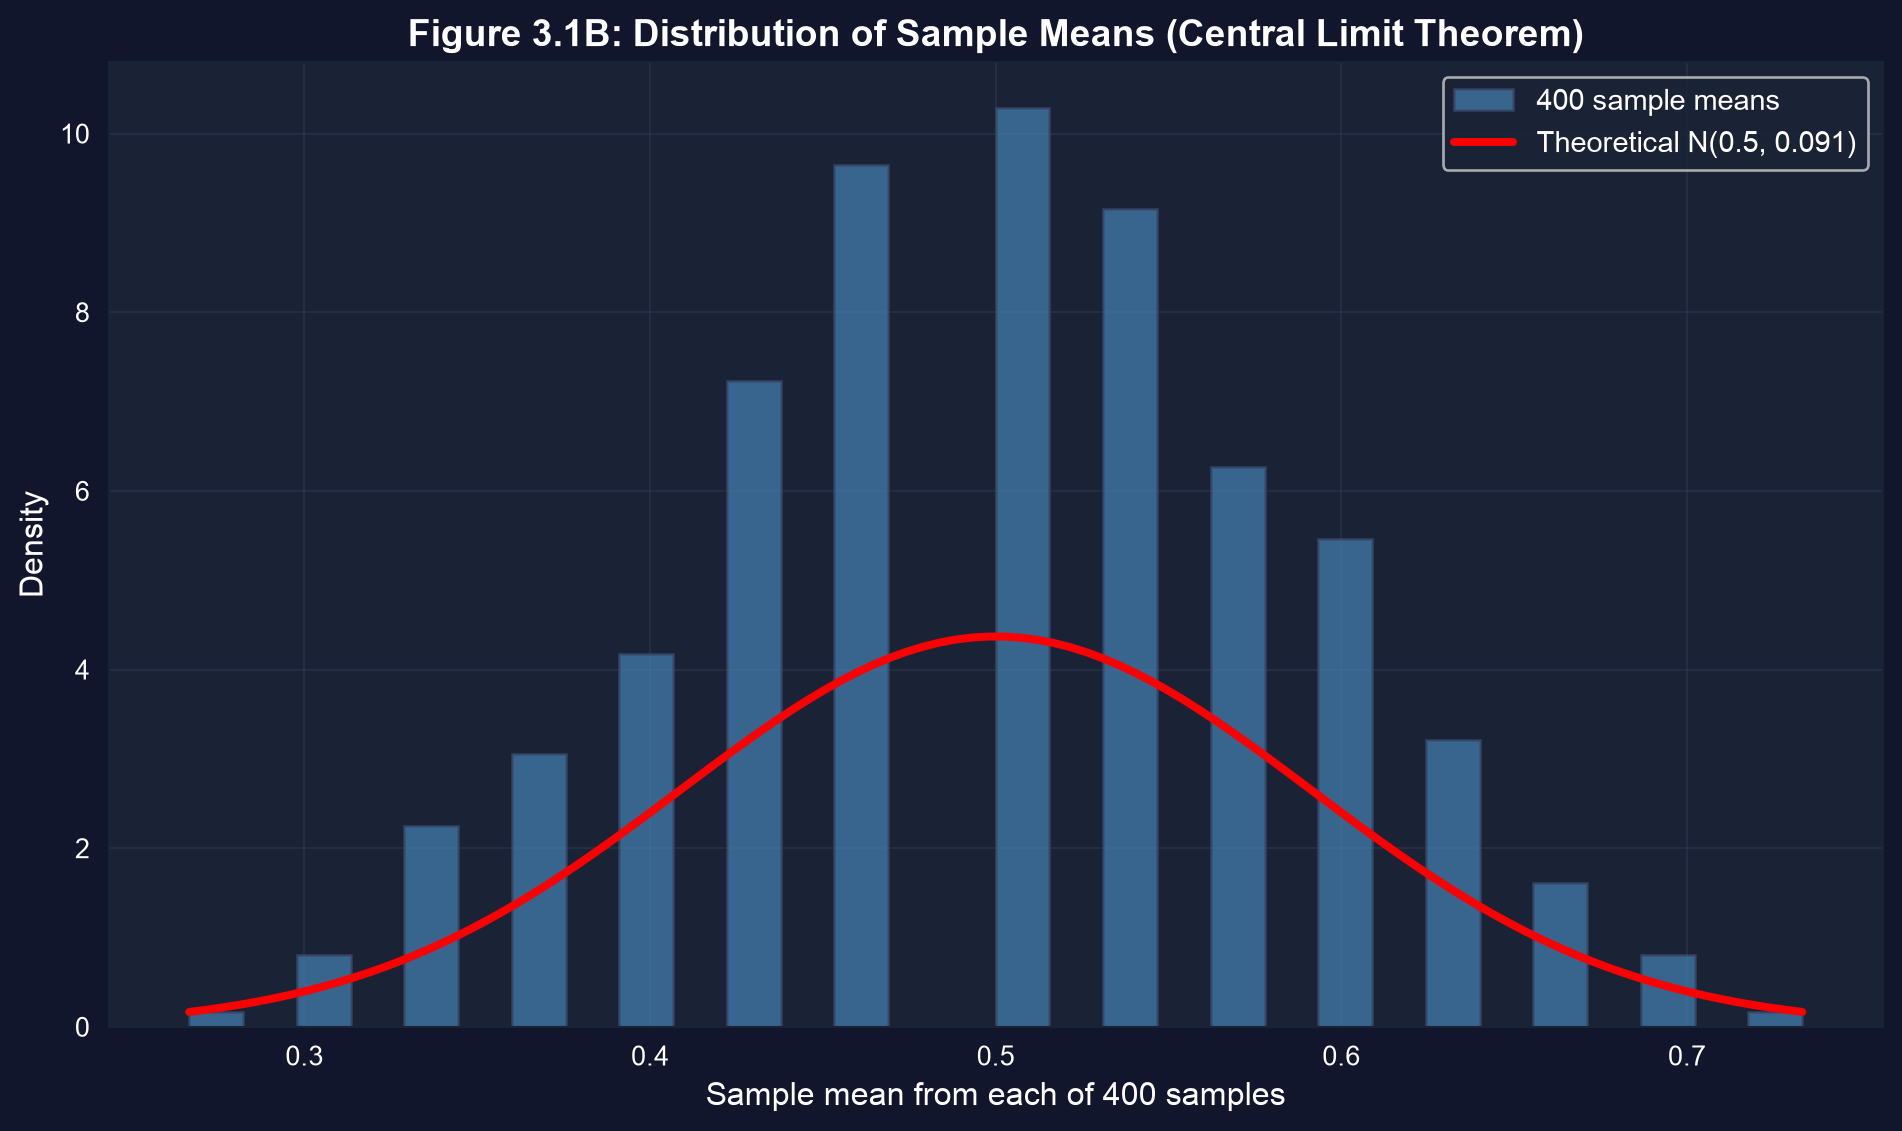
Each bar counts how often a sample mean landed in that range; the curve is the theoretical \(N(\mu,\,\sigma^2/n)\).
The histogram of sample means is the sampling distribution — centered at \(\mu\), spread \(\sigma/\sqrt{n}\).
Precision is a formula: \(sd(\bar{X}) = \sigma/\sqrt{n}\)
Larger samples don’t shift the center — they shrink the spread. The catch: it shrinks with \(\sqrt{n}\), not \(n\).
| \(n\) | \(\sigma/\sqrt{n}\) |
|---|---|
| 10 | 0.158 |
| 30 | 0.091 |
| 100 | 0.050 |
| 400 | 0.025 |
| 1000 | 0.016 |
To halve the standard error you must quadruple the sample size — precision is expensive.
Step 2 — reproduce the distribution with a Monte Carlo simulation
import numpy as np                           # numpy → random draws + arrays

np.random.seed(10101)                        # fix the seed → reproducible result
means = np.zeros(400)                        # container for 400 sample means
for i in range(400):                         # repeat the experiment 400 times
    sample = np.random.binomial(1, 0.5, 30)  # 30 fair coin tosses (each 0 or 1)
    means[i] = sample.mean()                 # store this sample's mean X̄

print(means.mean())                          # ≈ 0.50   → unbiased
print(means.std()) # ≈ 0.091 → matches σ/√nThe Central Limit Theorem: skewed data, normal mean
1880 U.S. Census ages are heavily right-skewed (\(\mu = 24.13\), \(\sigma = 18.61\)). Yet the means of 100 samples of \(n = 25\) trace a familiar bell.
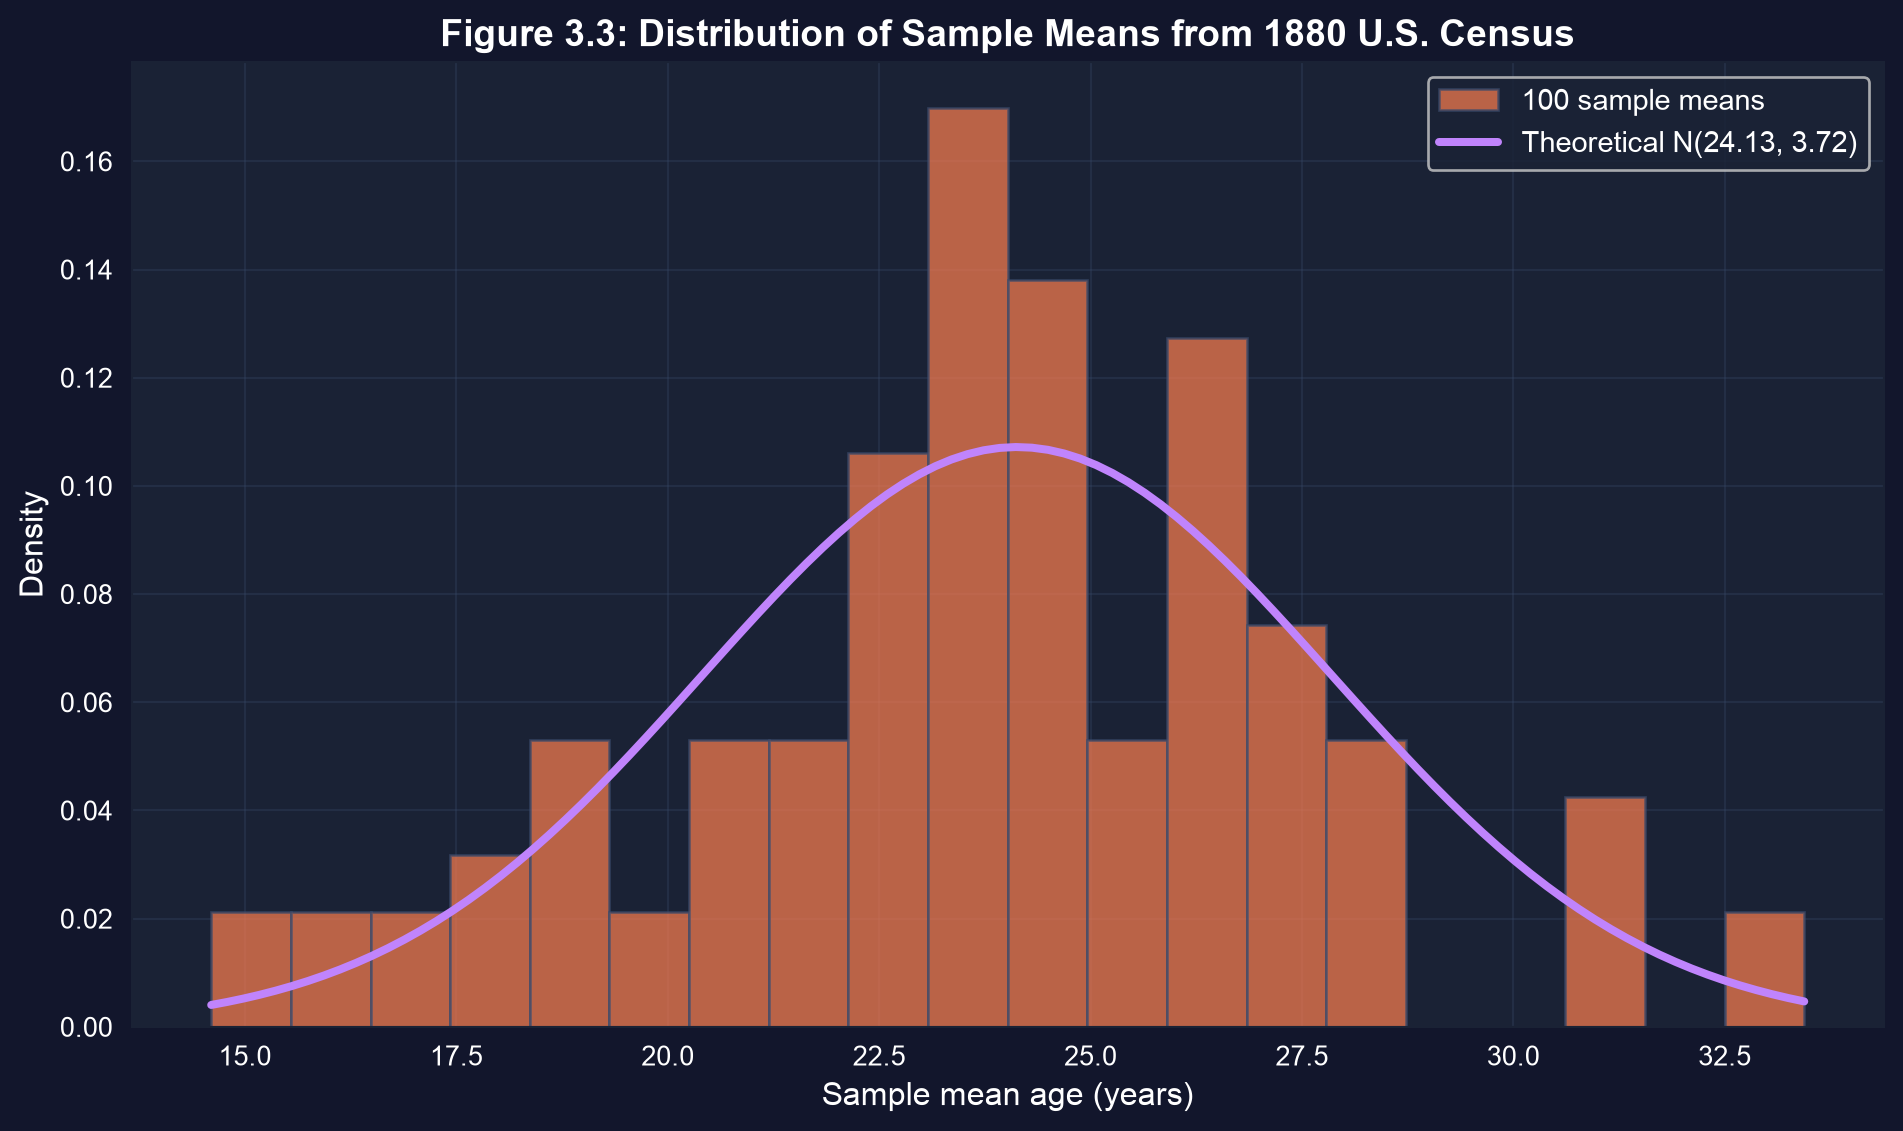
100 sample means of 1880 census ages — a bell curve rising from a skewed population.
The CLT: average enough draws and \(\bar{X}\) goes normal — whatever the population’s shape.
Step 3 — visualize a sampling distribution with its theoretical normal
import numpy as np, pandas as pd             # arrays + data
import matplotlib.pyplot as plt               # plotting
from scipy.stats import norm                  # scipy → the normal pdf for the overlay

url = "https://raw.githubusercontent.com/quarcs-lab/data-open/master/AED/AED_COINTOSSMEANS.DTA"
xbar = pd.read_stata(url)["xbar"]            # the 400 coin-toss sample means

fig, ax = plt.subplots(figsize=(10, 6))      # one figure + axes
ax.hist(xbar, bins=20, density=True,         # empirical sampling distribution
        color="#008CB7", alpha=0.75)         # (density so it compares to a pdf)
grid = np.linspace(xbar.min(), xbar.max(), 200)
ax.plot(grid, norm.pdf(grid, 0.5, np.sqrt(0.25 / 30)),  # theoretical N(μ, σ²/n)
        color="#C21E72", lw=3)               # DataPink curve on top
plt.show() # render histogram + normal overlayThree marks of a good estimator — and \(\bar{X}\) earns all three
- Unbiased — across 400 coin samples the means average 0.5004 vs. true \(\mu = 0.5\).
- Efficient — its SD 0.0887 sits right at the theoretical floor \(\sigma/\sqrt{n} = 0.0913\); no rival unbiased rule bounces less.
- Consistent — \(\operatorname{Var}[\bar{X}] = \sigma^2/n \to 0\): for census ages the SD of \(\bar{X}\) falls from 3.72 at \(n=25\) to 0.26 at \(n=5{,}000\).
Unbiased, efficient, consistent — this is why the sample mean is the workhorse estimator.
Reading it right
Act III · The resolution
The catch — the sample must be representative
Objection. “More data always gets me closer to the truth.”
Response. Only under simple random sampling. Oversample one group — say 70% women when the population is 50/50 — and the plain mean is biased, no matter how large \(n\) is. The fix is a weighted mean with inverse-probability weights \(w_i = 1/\pi_i\), which restores the true population average.
Consistency assumes a representative sample; a biased design converges to the wrong number.
What to carry forward
- A sample mean \(\bar{x}\) is one draw of the random variable \(\bar{X}\).
- \(E[\bar{X}] = \mu\) (unbiased) and \(\operatorname{Var}[\bar{X}] = \sigma^2/n\) (precision grows with \(n\)).
- The standard error \(se(\bar{X}) = s/\sqrt{n}\) — halving it costs 4× the data.
- The CLT makes \(\bar{X}\) approximately normal even when the population is not.
- All of it assumes a representative sample; otherwise, weight to correct the design.