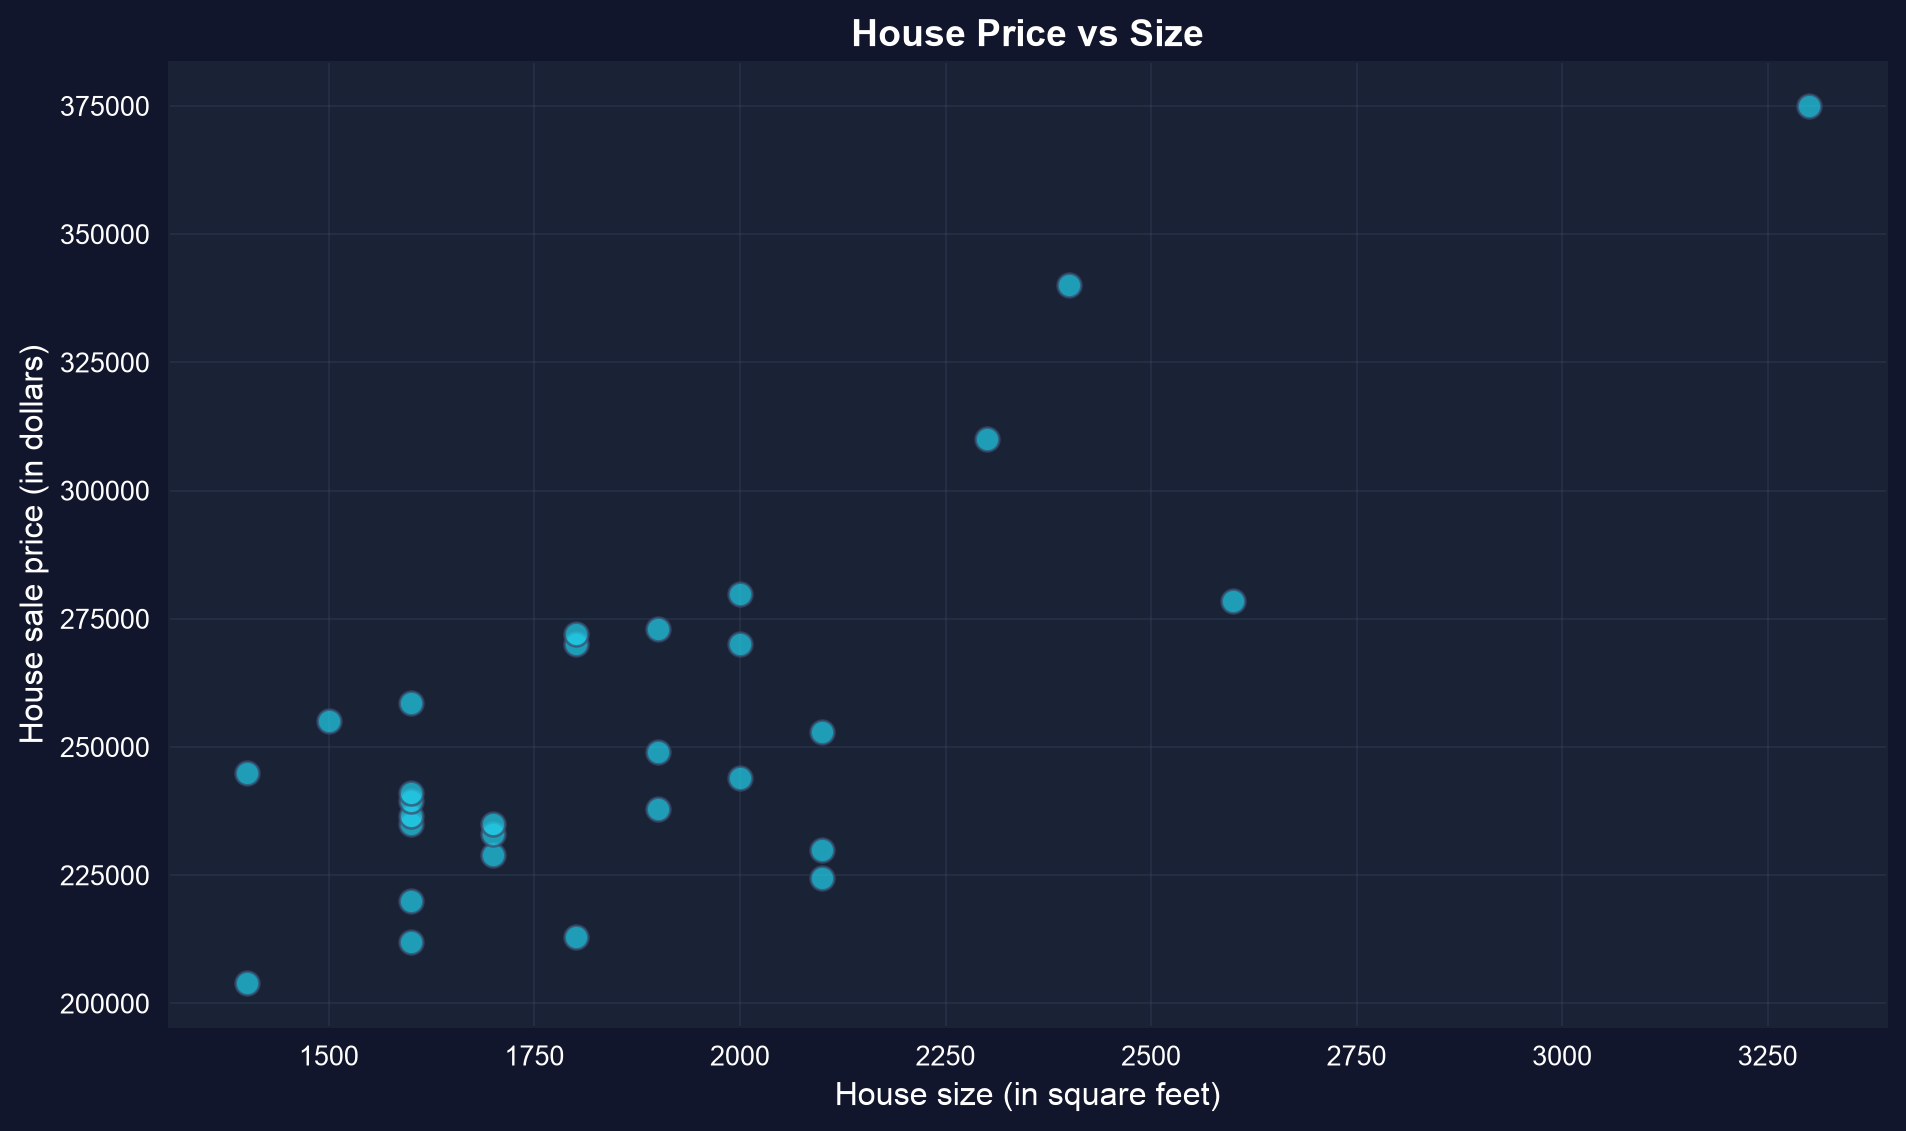
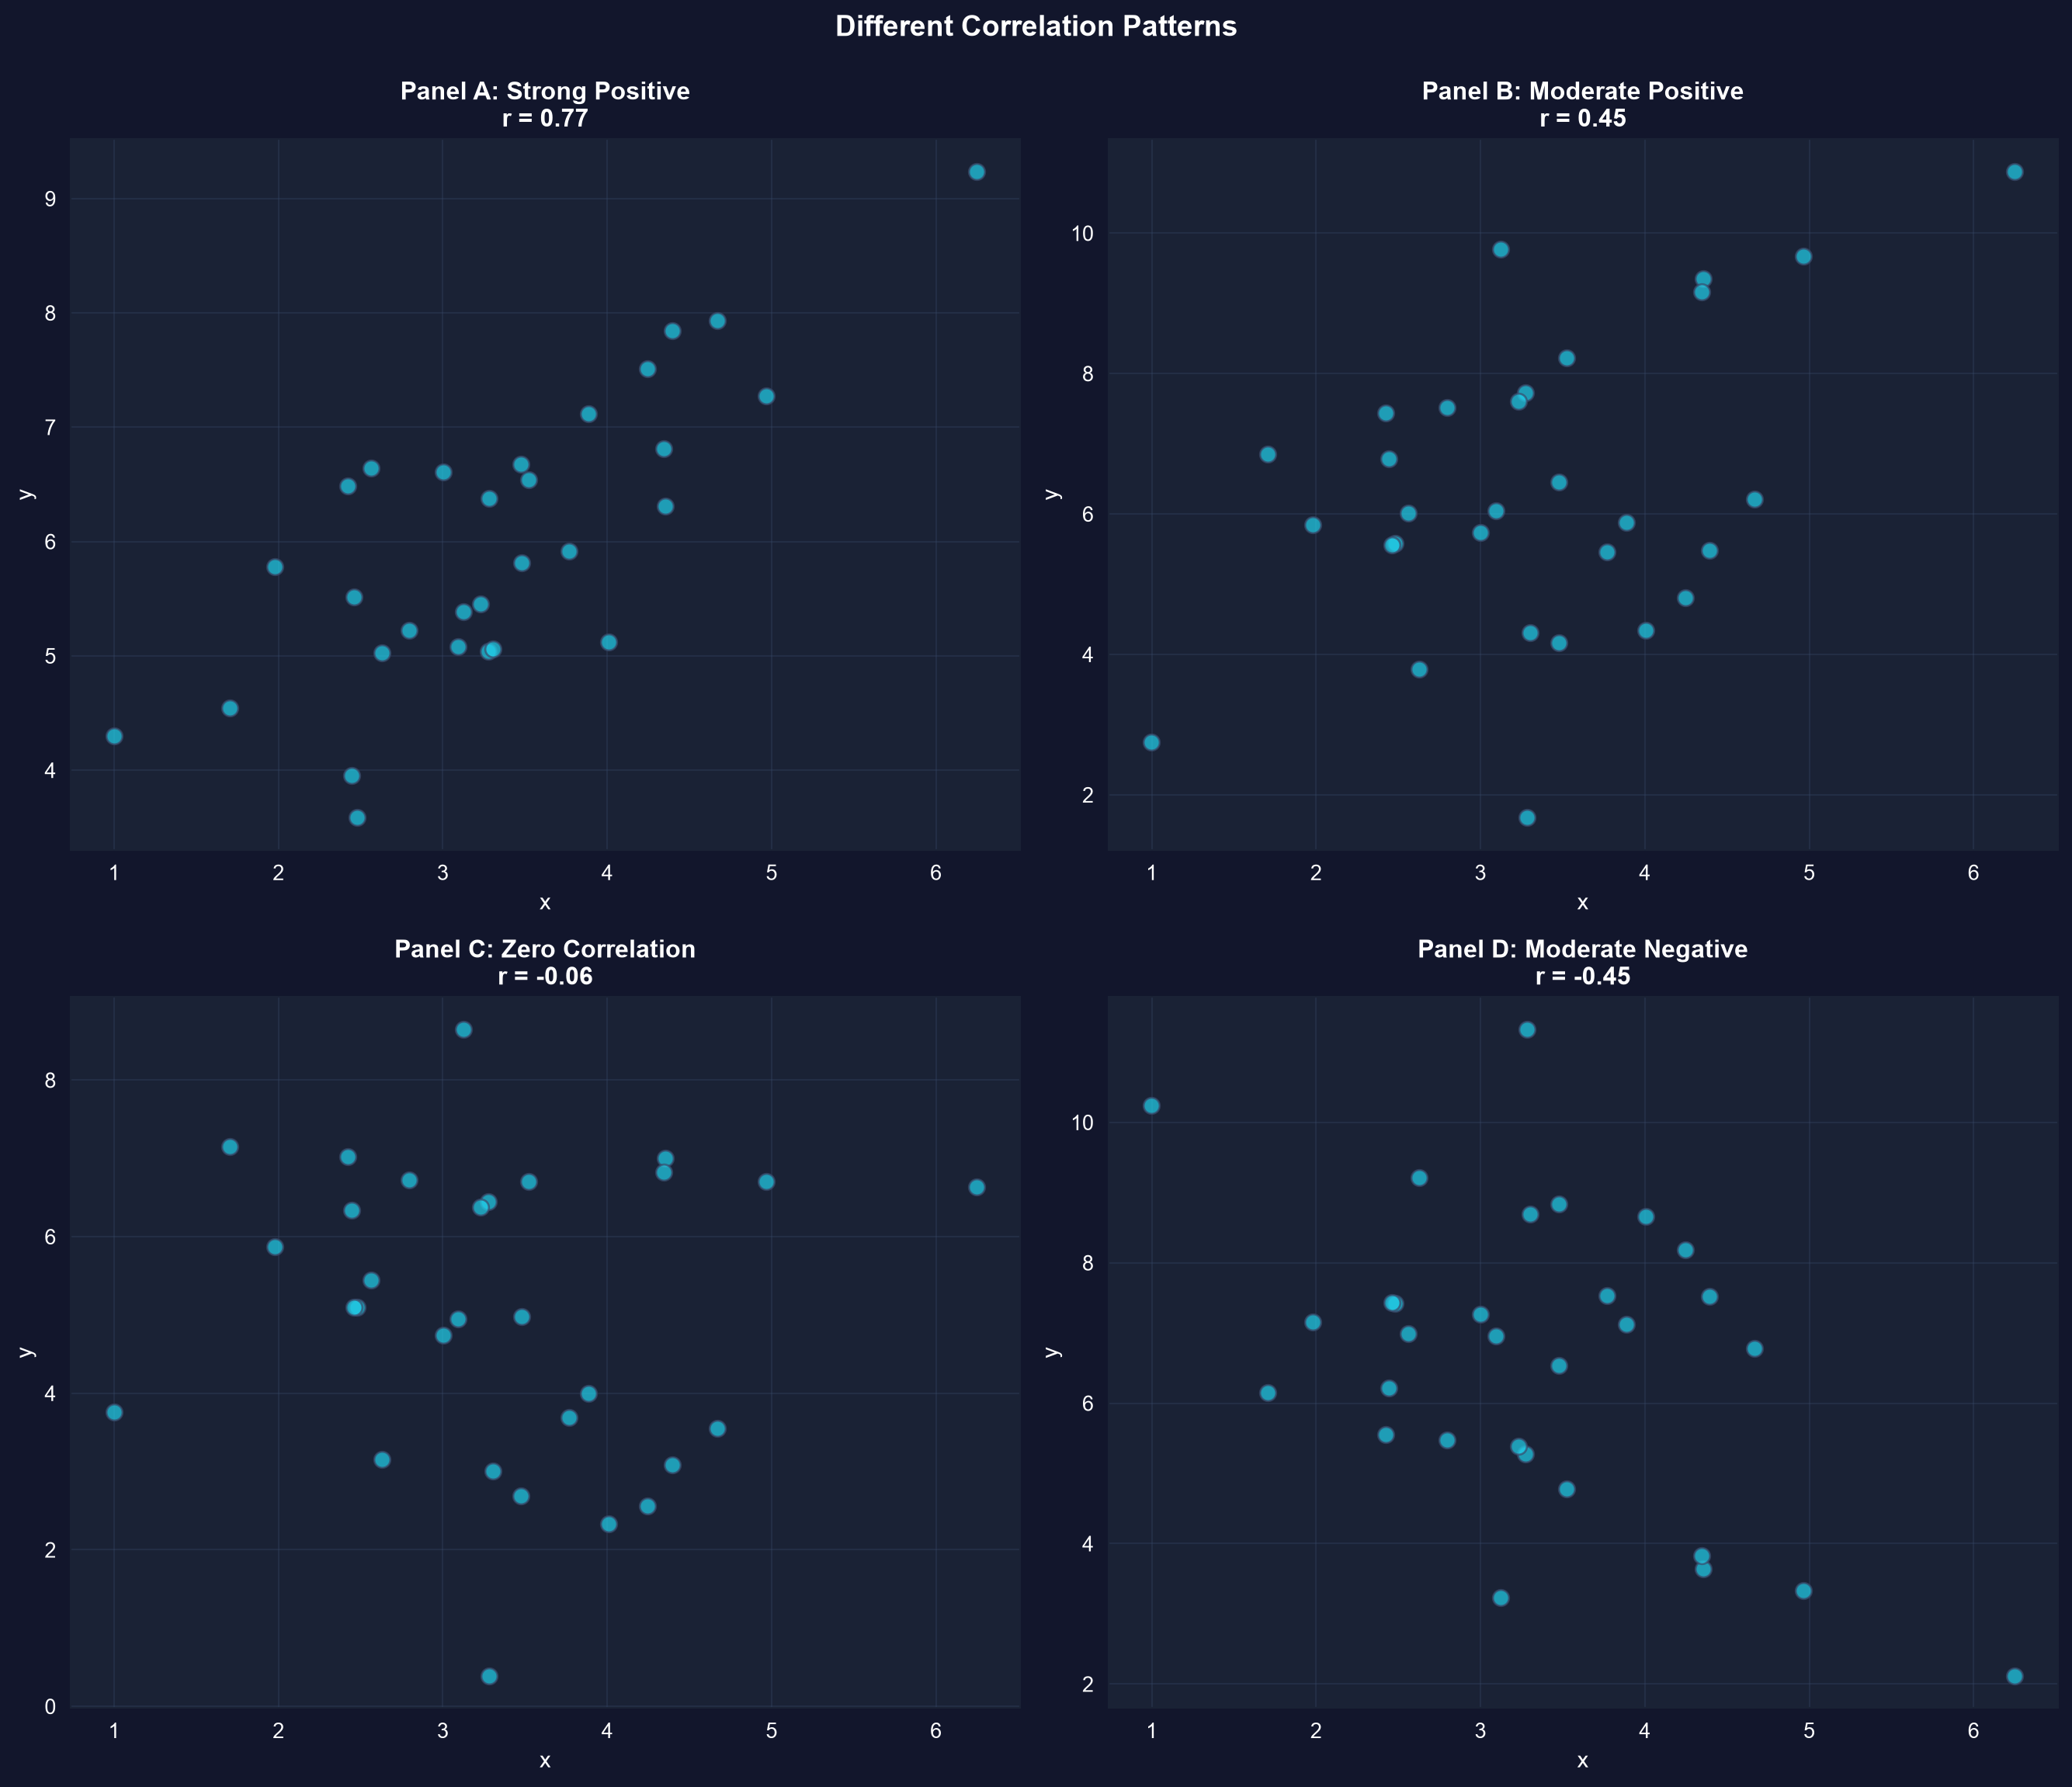
The regression line turns the cloud into a prediction
\[\hat{y} = b_1 + b_2\, x\]
\(b_1\) is the intercept (predicted \(y\) when \(x = 0\)); \(b_2\) is the slope — the predicted change in \(y\) for a one-unit increase in \(x\). OLS picks \(b_1, b_2\) to minimize the sum of squared residuals.
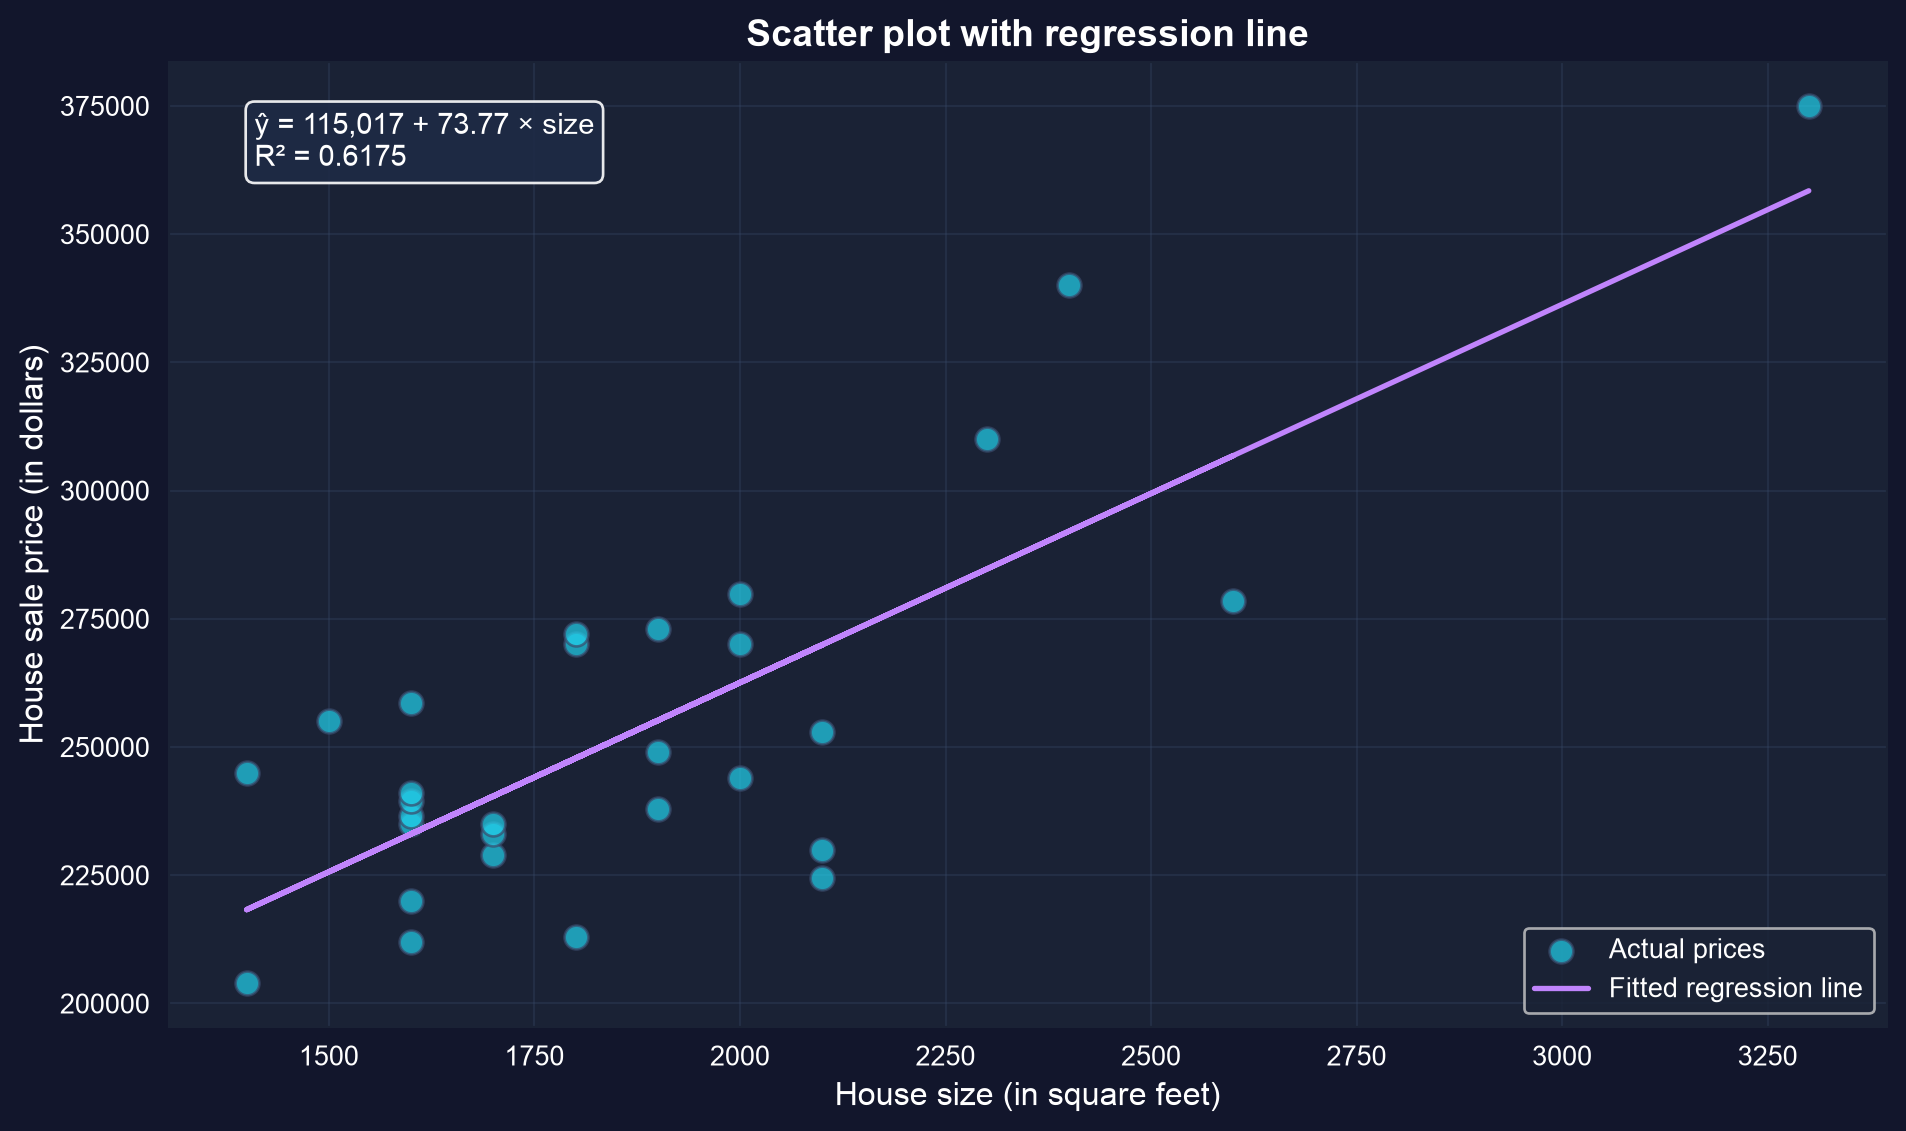
OLS draws the single best-fitting line through the cloud
The fitted line: ŷ = 115,017 + 73.77 × size. Each extra square foot predicts about $74 more.
Slope \(b_2 = \$73.77\) per sq ft; intercept \(b_1 = \$115{,}017\) — a house 100 sq ft larger is predicted to cost about $7,377 more.
Fit the regression line in Python
!pip install -q pyfixest # install pyfixest in Colab (-q = quiet; not preinstalled)import pandas as pd # pandas → load & handle tabular dataimport pyfixest as pf # pyfixest → fast OLS regression + tidy output# dataset: 29 house sales in Davis, CA (price, size, bedrooms, …)url ="https://raw.githubusercontent.com/quarcs-lab/data-open/master/AED/AED_HOUSE.DTA"houses = pd.read_stata(url) # read the Stata .dta file into a DataFramem = pf.feols("price ~ size", data=houses) # fit OLS: regress price on sizem.summary() # report intercept b1, slope b2, SEs, R²
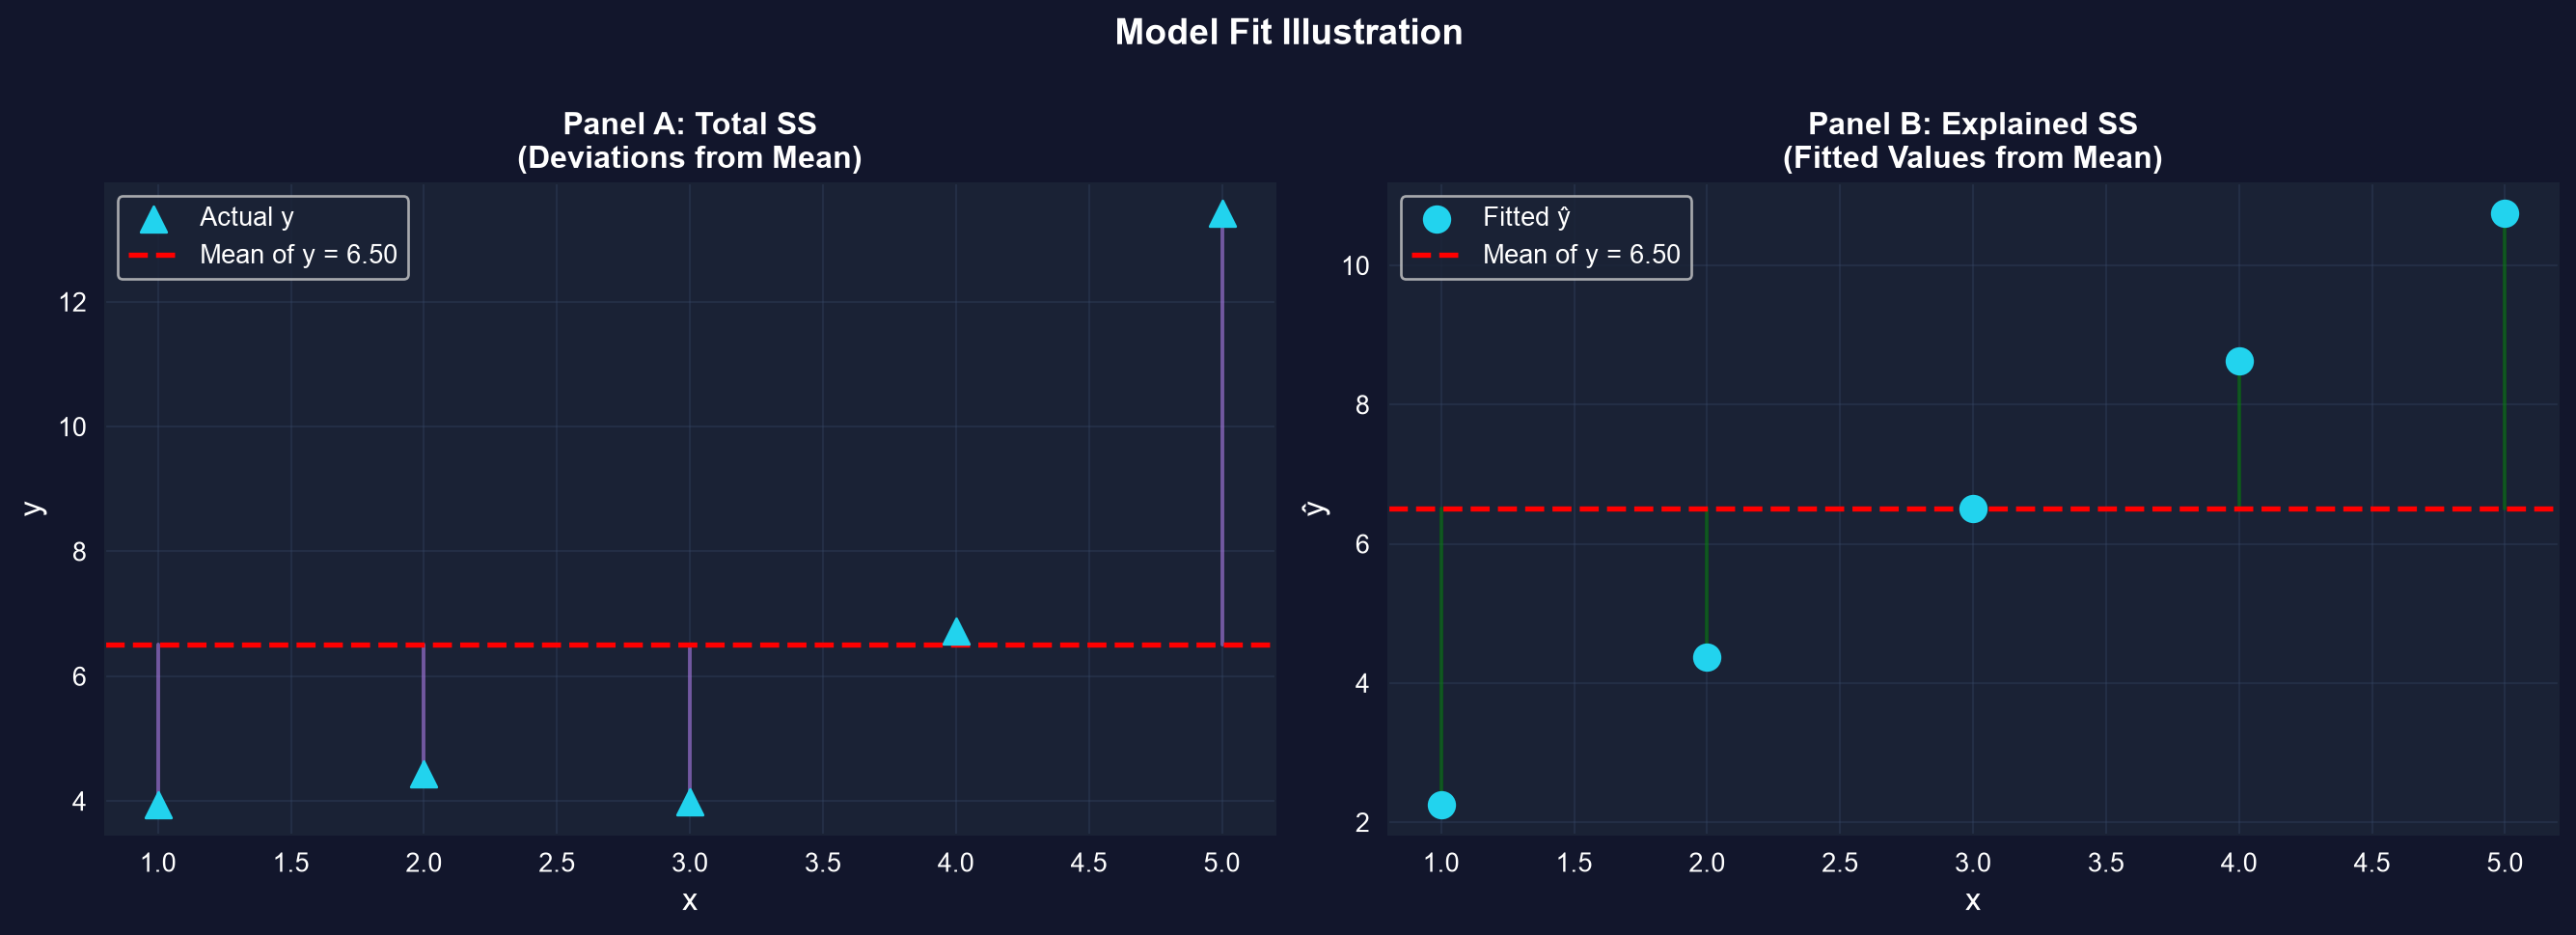
Total variation in price = what the line explains + what it leaves in the residuals.
Here \(R^2 = 0.617\): size explains about 62% of the variation in price, leaving 38% to everything else. (And \(R^2 = r^2 = 0.7858^2\).)
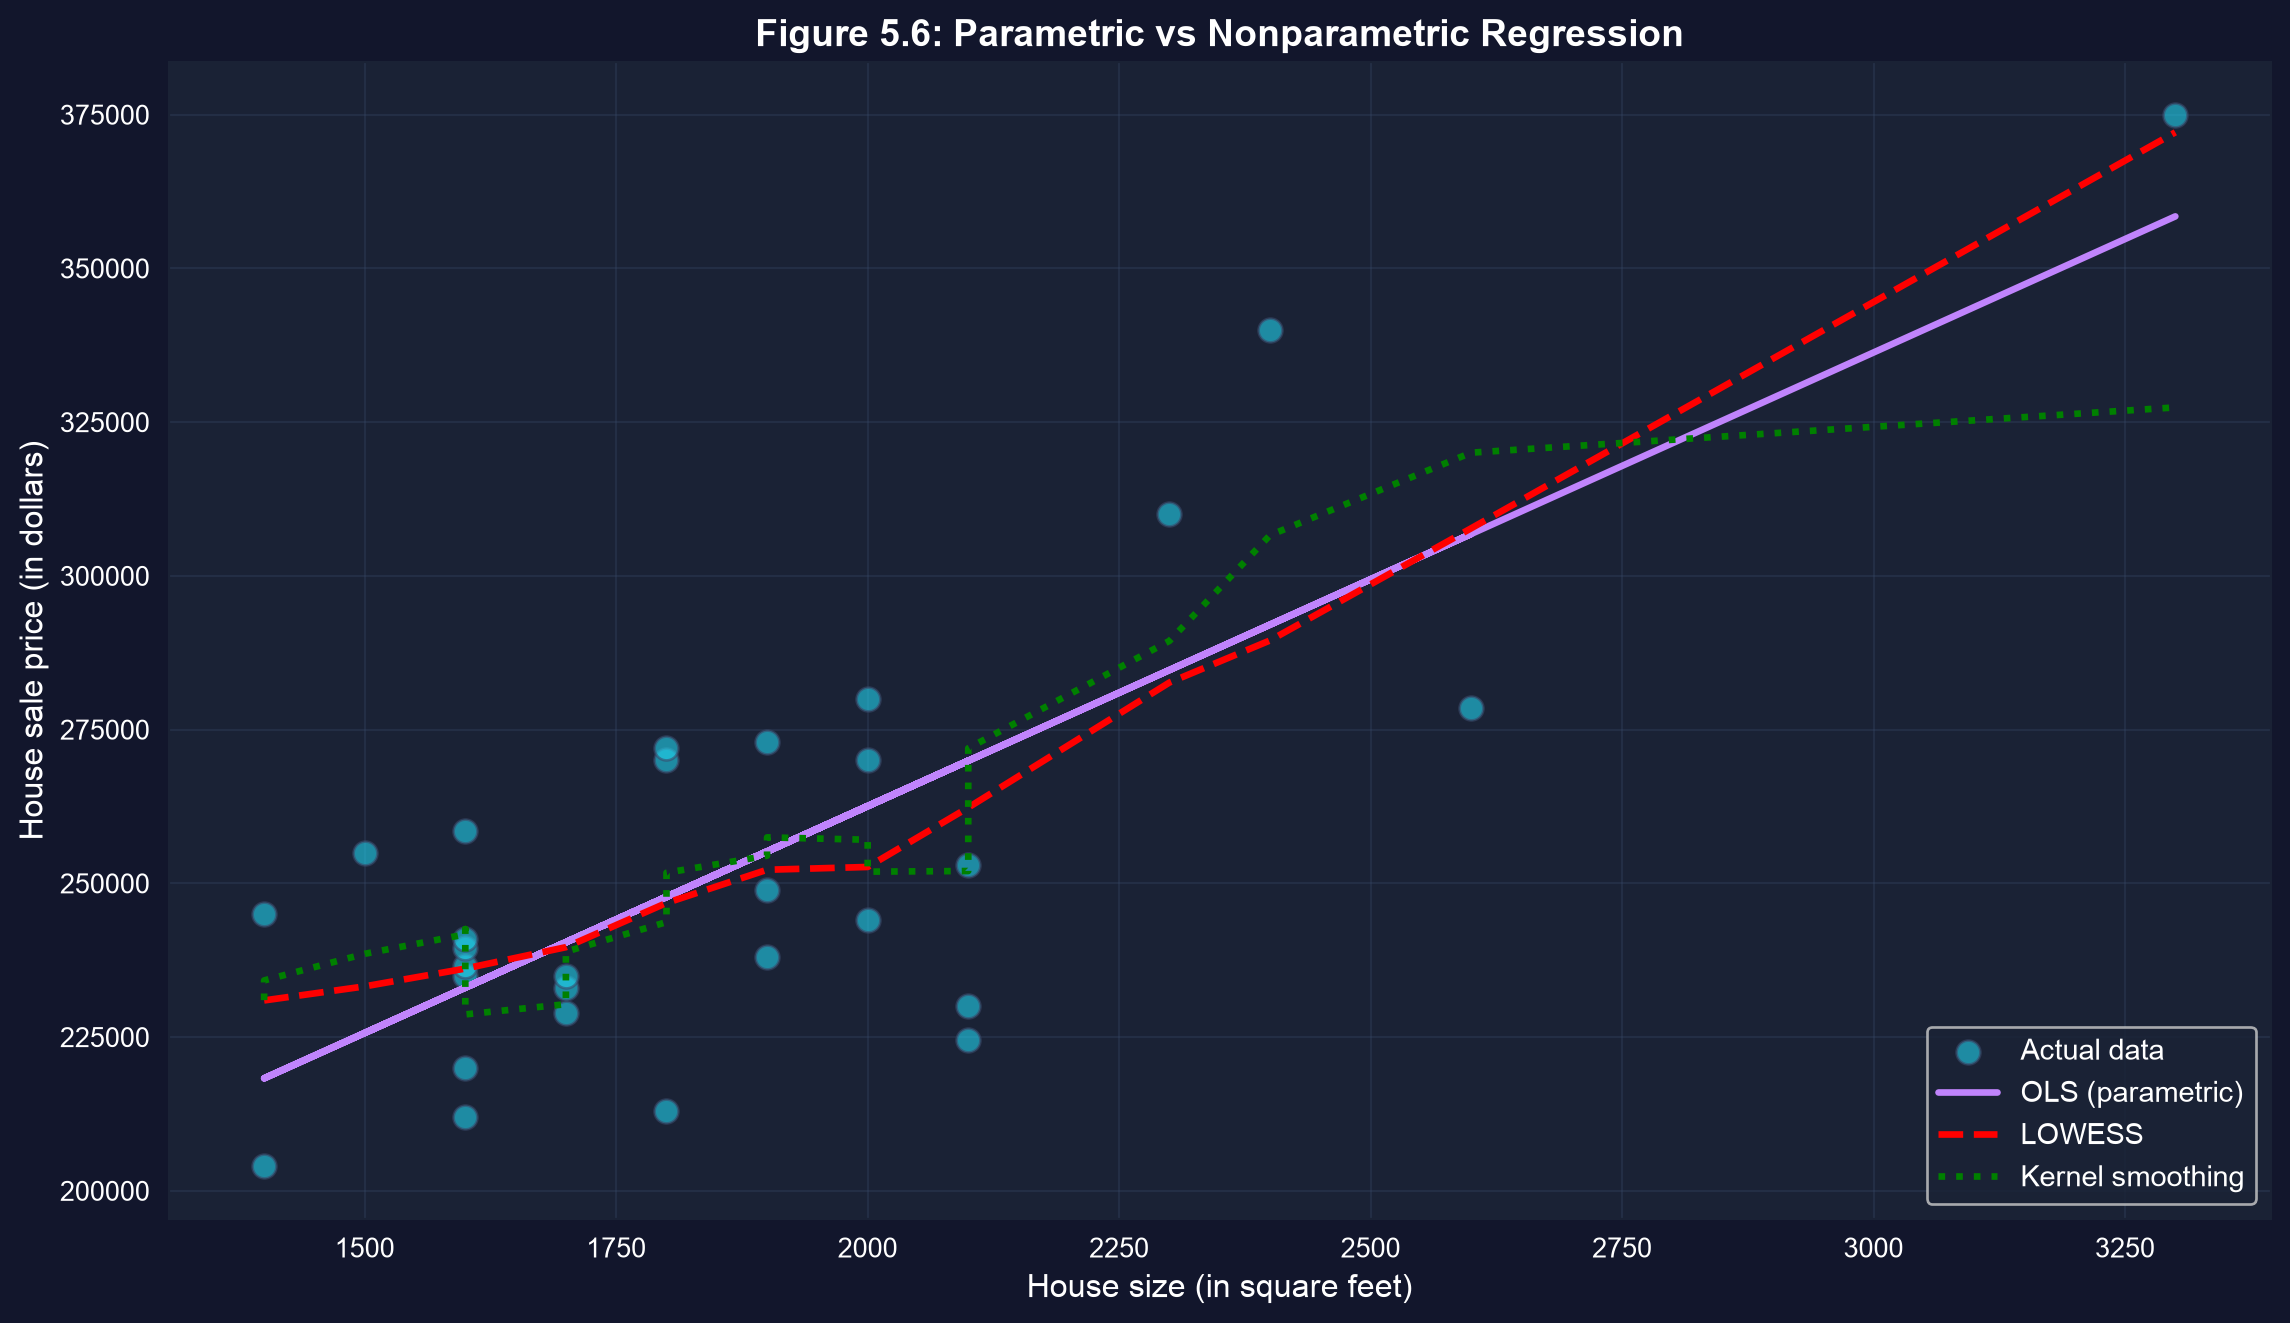
A flexible curve checks the straight-line assumption
Nonparametric regression lets the data choose the shape — if it tracks the OLS line, linearity is a fair summary.
Fit a flexible curve first; if it hugs the straight line, the simple linear summary is trustworthy.
Reading it right
Act III · The resolution
The tempting mistake — and the correction
Objection. “Size and price have \(r = 0.79\), so larger size causes higher price.”
Response.Association is not causation. Confounders (location; lot size, though only weakly linked to size and price here), reverse causality, and selection can all create a correlation. A line summarizes; it does not identify a cause.
A correlation earns a causal reading only with a design that rules out the alternatives.
What to carry forward
A scatterplot is the first, honest summary of two variables.
Correlation\(r \in [-1, 1]\) measures linear strength, unit-free; covariance gives only the sign.
OLS fits \(\hat{y} = b_1 + b_2 x\) by minimizing squared residuals; the slope is the headline.
\(R^2\) reports the share of variation explained — and \(R^2 = r^2\) for simple regression.
Association \(\neq\) causation — always the last word on interpretation.
Measure the relationship, model it with a line — then resist calling it a cause.