The question
Act I · The tension
We fit one line — but the truth lives in a population we never see
Chapter 5 showed us how to fit a regression. But our line \(\hat{y} = b_1 + b_2 x\) comes from one noisy sample. Behind it sits a population line \(\beta_1 + \beta_2 x\) we can never observe.
So why should we trust an estimate we know is wrong? This chapter answers that — with the statistical properties that make OLS the default estimator in econometrics.
Where we’re going
- Population vs sample — the line we want (\(\beta_1+\beta_2x\)) vs the line we get (\(b_1+b_2x\))
- Sampling variability — why every sample gives a different line
- Unbiasedness — why OLS is right on average, shown by Monte Carlo
- Standard errors — how to measure the precision of a single estimate
- BLUE & normality — why OLS is the best choice, and why \(t\)-tables work
Six ideas anchor this chapter
- Conditional mean \(E[Y\mid X]\) — the population line; the systematic part of \(Y\) given \(X\)
- Error \(u\) vs residual \(e\) — the unobserved shock vs the observed miss from \(\hat{y}\)
- Homoskedasticity — the error spread \(\operatorname{Var}[u\mid x]=\sigma_u^2\) is constant in \(x\)
- \(s_e\) — the standard error of the regression, \(\sqrt{\text{RSS}/(n-2)}\): typical residual size
- BLUE — under the four assumptions, OLS has the smallest variance of any linear unbiased rule
- Asymptotic normality — as \(n\) grows, \(b_2\) is approximately normal, so \(t\)-tables apply
OLS is wrong in every sample — but right on average, and we can say exactly how wrong.
Population vs sample
Act II · The investigation
A known truth: data generated from \(y = 1 + 2x + u\)
To study OLS, the chapter uses generated data where we know the answer:
\[y = \underbrace{1 + 2x}_{E[y\mid x]} + u, \qquad u \sim N(0,\ \sigma_u^2=4)\]
True intercept \(\beta_1=1\), true slope \(\beta_2=2\). The column Eygivenx is the population line exactly; u is the random shock that pulls each observed y off it.
Step 1 — fit the sample line with pyfixest, compare to the truth
!pip install -q pyfixest                     # install pyfixest in Colab (-q = quiet; not preinstalled)

import pandas as pd                          # tabular data
import pyfixest as pf                         # pyfixest → OLS, R-style formulas

url = "https://raw.githubusercontent.com/quarcs-lab/data-open/master/AED/AED_GENERATEDDATA.DTA"
data = pd.read_stata(url)                    # 5 points generated from y = 1 + 2x + u

fit = pf.feols("y ~ x", data=data)           # OLS: regress observed y on x
fit.coef()                                   # sample estimates b1, b2
fit.summary() # full table: coefs, SEs, t, p, R2One sample misses: \(\hat{y} = 2.81 + 1.05x\) vs the true \(1 + 2x\)
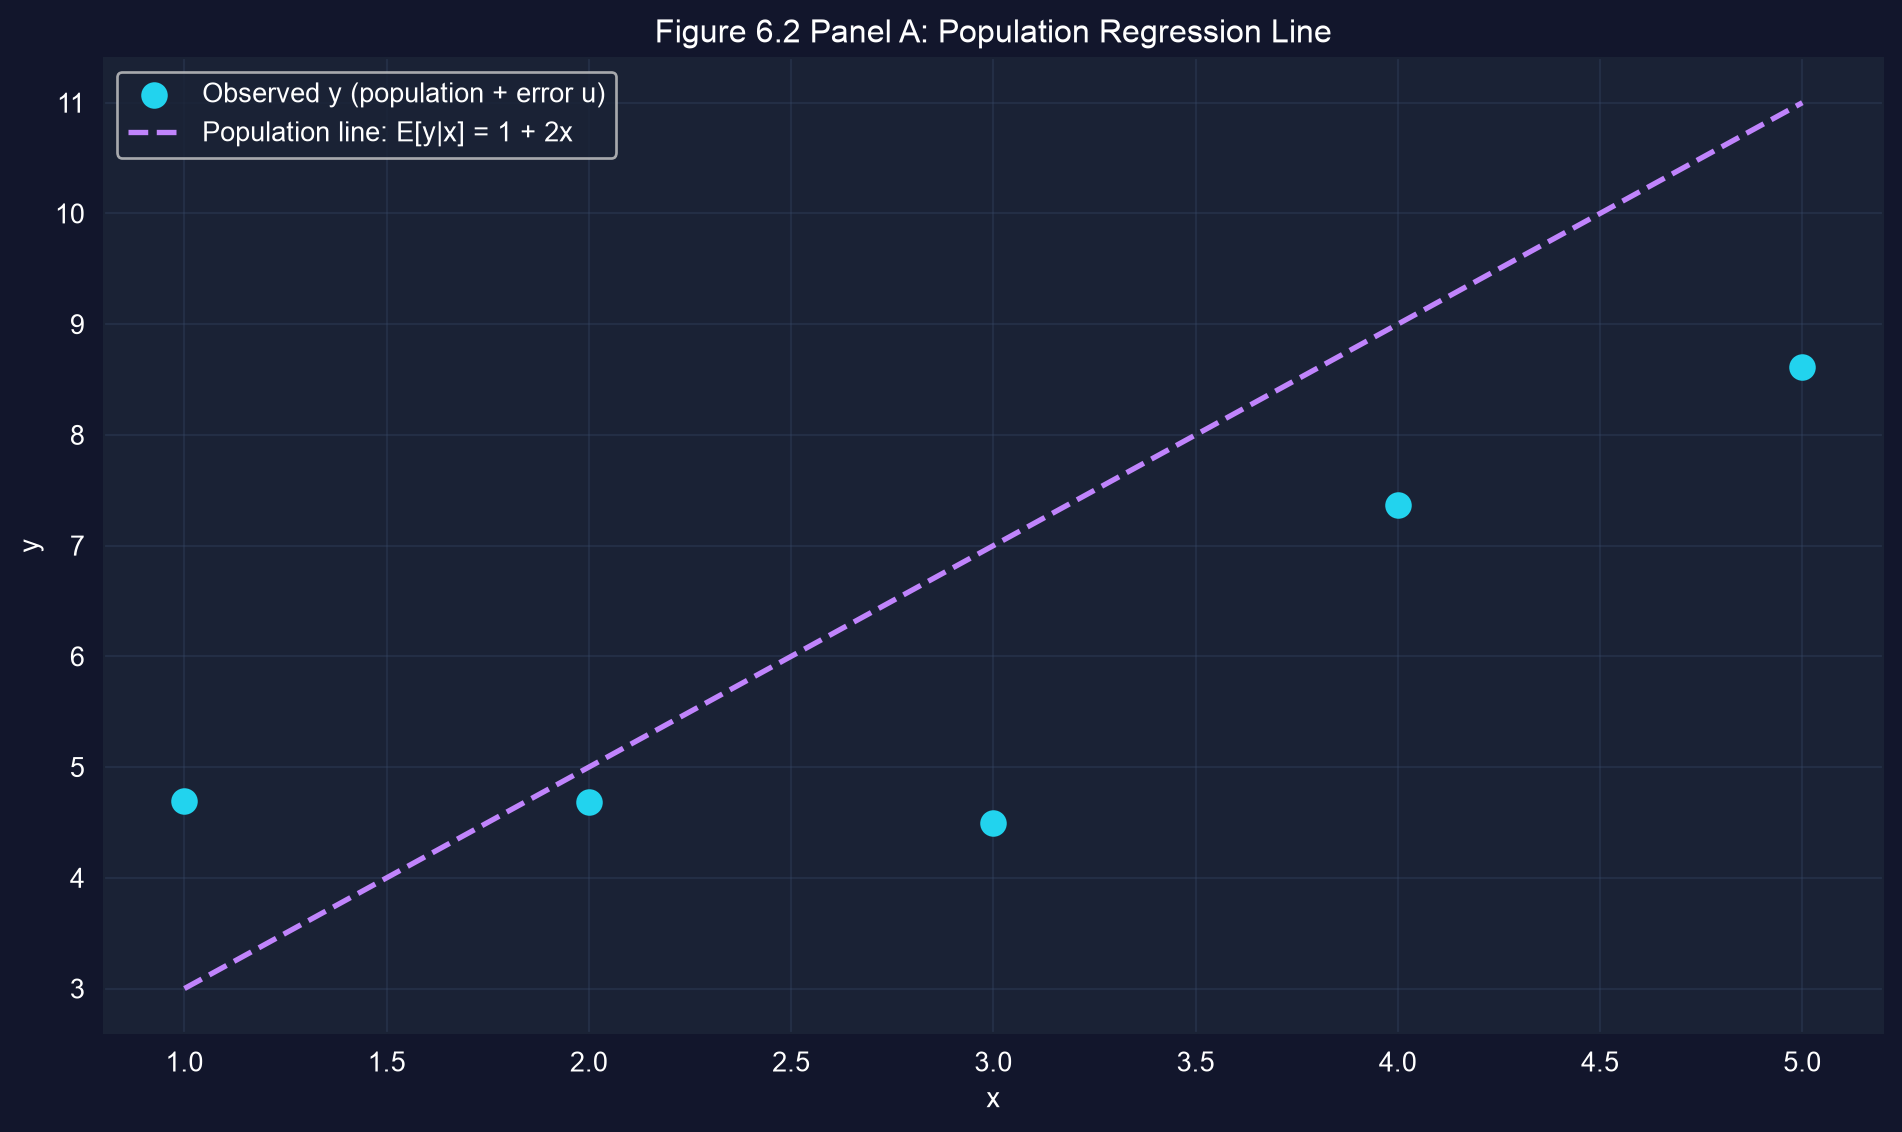
Observed points (cyan) scatter around the true population line (purple dashed). The sample line fit to them need not match it.
With only \(n=5\), the estimate (\(b_2=1.05\)) lands far from the truth (\(\beta_2=2\)). This is not a bug — it is sampling variability.
Same process, three samples, three different lines
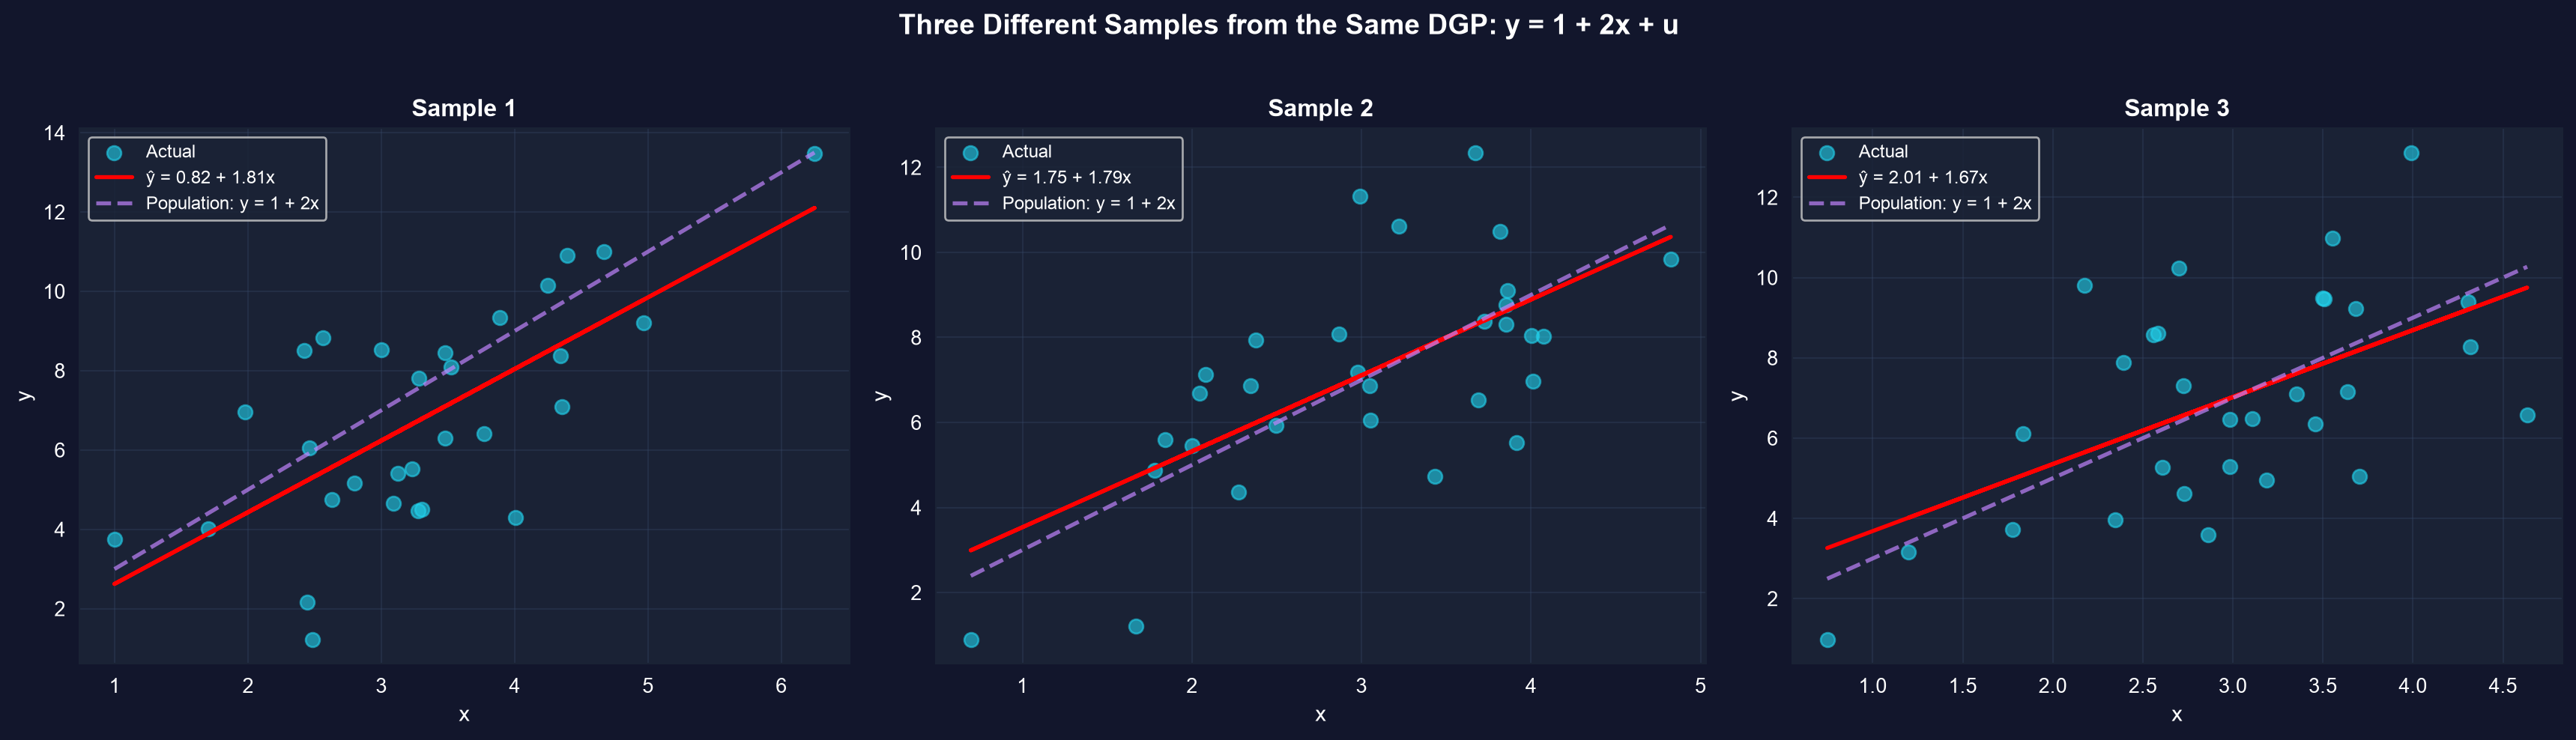
Three independent samples from the identical DGP \(y=1+2x+u\) yield three different fitted lines — all near the true population line, none on it.
Slopes came out 1.81, 1.79, 1.67; intercepts 0.82, 1.75, 2.01. One sample never reveals the truth — it only gives one draw from a distribution of estimates.
Step 2 — simulate 1,000 samples to see the estimator’s behavior
import numpy as np                           # random draws + arrays
import pyfixest as pf                         # OLS on each simulated sample

np.random.seed(42)                           # reproducible simulation
n, n_sims = 30, 1000                         # 1,000 samples of n = 30
b1_true, b2_true, sigma_u = 1, 2, 2          # the known DGP y = 1 + 2x + u

slopes = []                                  # collect b2 from each sample
for _ in range(n_sims):
    x = np.random.normal(3, 1, n)            # draw regressors
    u = np.random.normal(0, sigma_u, n)      # draw mean-zero errors
    y = b1_true + b2_true * x + u            # build y from the true model
    slopes.append(pf.feols("y ~ x", data=pd.DataFrame({"x": x, "y": y})).coef()["x"])

np.mean(slopes)                              # ≈ 2.00  → unbiased
np.std(slopes) # ≈ 0.38 → sampling variabilityRight on average: the estimates center on the true \(\beta_2 = 2\)
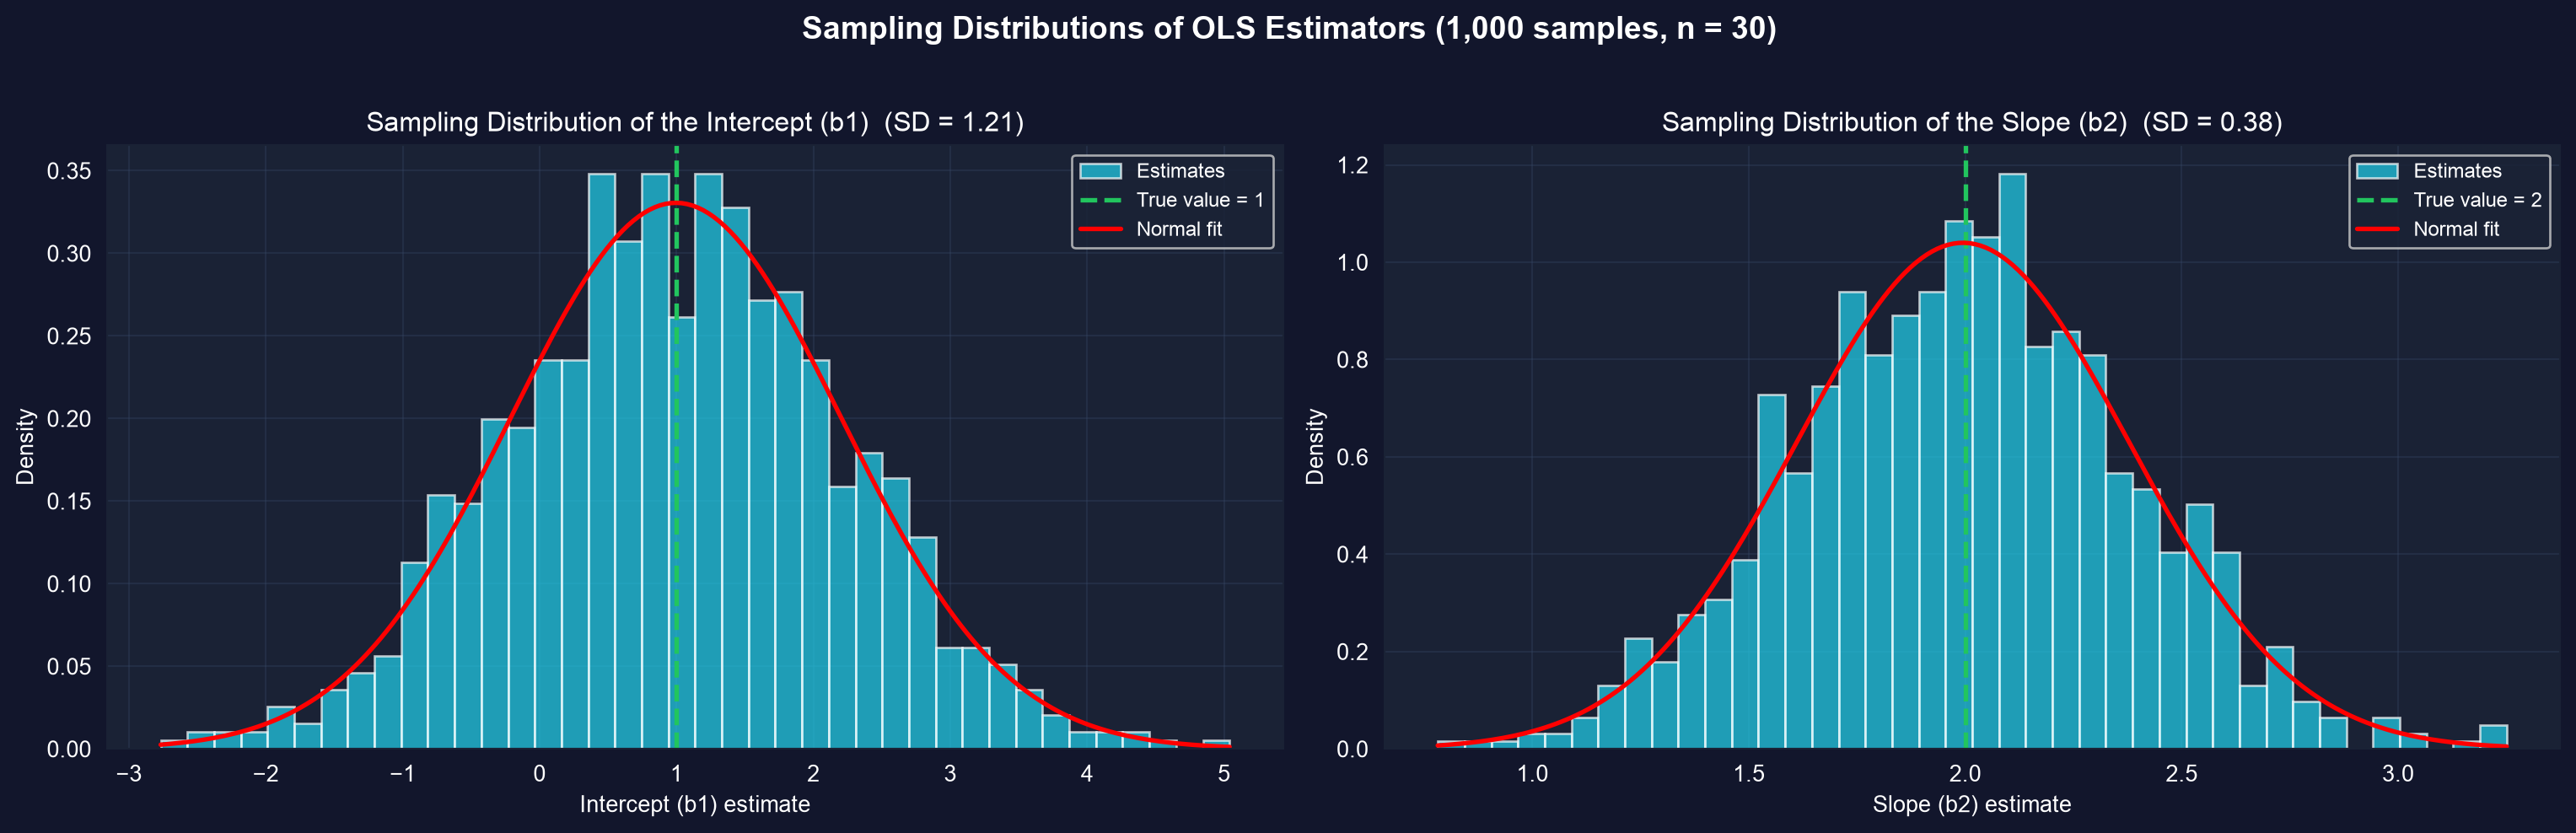
Across 1,000 samples, the slope and intercept estimates form bell curves centered on the true values, tracking a normal fit.
Mean slope \(=1.994\) (true \(2\)), SD \(=0.38\); mean intercept \(=0.996\) (true \(1\)). Unbiasedness and asymptotic normality, seen directly.
6.4 — precision has a formula: the standard error of the slope
For a single sample we can’t average over worlds — but we can estimate the spread:
\[s_e=\sqrt{\frac{\text{RSS}}{n-2}}, \qquad se(b_2)=\frac{s_e}{\sqrt{\sum_i (x_i-\bar{x})^2}}\]
Divide RSS by \(n-2\) because two parameters (\(b_1,b_2\)) are estimated. The slope is precise when \(s_e\) is small (good fit) and the \(x\)’s are widely spread.
Step 3 — compute the standard errors by hand, verify against the model
import numpy as np                           # arrays + math
import pyfixest as pf                         # to check our hand calculation

data = pd.DataFrame({"x": [1, 2, 3, 4, 5],   # artificial 5-point dataset
                     "y": [1, 2, 2, 2, 3]})
fit = pf.feols("y ~ x", data=data)           # fitted line: y_hat = 0.8 + 0.4x

b1, b2 = fit.coef()["Intercept"], fit.coef()["x"]
data["resid"] = data["y"] - (b1 + b2 * data["x"])   # residuals e = y - y_hat
RSS = np.sum(data["resid"] ** 2)             # residual sum of squares
Sxx = np.sum((data["x"] - data["x"].mean()) ** 2)   # spread of x

s_e   = np.sqrt(RSS / (len(data) - 2))       # standard error of the regression
se_b2 = s_e / np.sqrt(Sxx)                   # standard error of the slope

print(se_b2, fit.se()["x"]) # hand value == model value ✓Three levers control precision
- Model fit (\(s_e\)) — smaller residuals shrink every standard error.
- Sample size (\(n\)) — \(se(b_2)\propto 1/\sqrt{n}\): quadruple \(n\) to halve the SE.
- Spread of \(x\) — a wide \(\sum(x_i-\bar{x})^2\) pins the slope down; clustered \(x\) leaves it loose.
In the 108-country convergence data, capital per worker is spread almost as wide as its mean — exactly the condition that estimates the slope precisely.
Reading it right
Act III · The resolution
“My estimate is wrong — so OLS failed.” Not quite.
Objection. “My slope is 1.05 but the truth is 2.0. The method is broken.”
Response. A single wrong estimate is expected, not a failure. Under the four assumptions (correct model, mean-zero errors, homoskedasticity, independence) OLS is unbiased — right on average — and BLUE, the tightest linear unbiased rule. One sample is one draw; the standard error tells you how far it might be off.
Don’t ask “is my estimate exactly right?” Ask “how precise is it?” — that’s what the standard error reports.
What to carry forward
- The population line \(\beta_1+\beta_2x\) is the target; the sample line \(b_1+b_2x\) is one noisy estimate of it.
- OLS is unbiased: \(E[b_2]=\beta_2\) — Monte Carlo centers 1,000 estimates on the truth.
- Standard errors quantify sampling variability; \(se(b_2)=s_e/\sqrt{\sum(x_i-\bar{x})^2}\).
- Precision improves with better fit, larger \(n\), and wider spread in \(x\).
- Under the four assumptions OLS is BLUE and asymptotically normal — the license for \(t\)-tests and intervals.