One sample, one slope: how much should we trust it?
Act I · The tension
A slope estimate is never the whole story
Chapter 6 gave us a number: in 29 houses sold in Davis, California, each extra square foot goes with $73.77 more in price. A different sample of 29 houses would give a different number.
So the real question is not “what is the slope?” but “how much should we trust it?” Inference turns one estimate into a range (a confidence interval) and a verdict (a hypothesis test).
Every result in this deck answers three questions: Is it precise? Is it real? Does it matter? And a fourth one underneath: is the standard error honest?
Where we are going: click any part to jump to it
| Part | Question | Tool | Headline result |
|---|---|---|---|
| 7.1 | Do bigger houses sell for more? | OLS, 29 houses | \(b_2 = 73.77\) $/sq ft |
| 7.2 | How far is the slope from zero, in noise units? | \(t\)-statistic | \(t = 6.60\) |
| 7.3 | Which slopes can the data not rule out? | Confidence interval | [50.84, 96.70] |
| 7.4 | Does size matter at all? | Test of \(\beta_2 = 0\) | reject, \(p < 0.001\) |
| 7.5 | Is the slope $90 per square foot? | Two-sided test | do not reject, \(p = 0.158\) |
| 7.6 | Is it less than $90? | One-sided test | do not reject at 5%, \(p = 0.079\) |
| 7.7 | Are the standard errors honest? | HC1 robust SEs | 11.17 → 11.33 |
| Case 1 | Capital and productivity, 108 countries | All of the above | robust SE 48% larger |
| Case 2 | Nighttime lights and development, Bolivia | All of the above | slope 3.37, robust SE 18% larger |
| Synthesis | What carries over to every regression? | Scorecard | — |
The population model behind every test
\[y_i = \beta_1 + \beta_2 x_i + u_i \qquad\text{estimated by}\qquad \hat y_i = b_1 + b_2 x_i\]
- Linearity: the population model is \(y = \beta_1 + \beta_2 x + u\)
- Zero conditional mean: \(E[u_i \mid x_i] = 0\)
- Constant variance (homoskedasticity): \(\operatorname{Var}[u_i \mid x_i] = \sigma_u^2\)
- Independence: \(u_i\) is independent of \(u_j\) for \(i \neq j\)
Assumptions 1–2 make \(b_2\) unbiased. Assumptions 3–4 are what the classical standard error needs; robust SEs (7.7) drop assumption 3.
Six ideas anchor this chapter
- Null hypothesis \(H_0: \beta_2 = 0\): the default claim that \(x\) has no linear effect on \(y\)
- Standard error \(\operatorname{se}(b_2)\): how much the slope would vary from sample to sample
- \(t\)-statistic \(t = (b_2 - \beta_2^{*})/\operatorname{se}(b_2)\): distance from the null value in SE units
- Critical value \(t_{n-2,\,\alpha/2}\): the cutoff that triggers rejection
- Margin of error \(t_{n-2,\,\alpha/2}\times\operatorname{se}(b_2)\): the half-width of the confidence interval
- Test of significance: is the coefficient distinguishable from zero, given sampling noise?
Statistical significance is not economic significance. Keep both in view from the first slide to the last.
Act II-a · One regression, seven tools
Sections 7.1–7.7 · 29 houses in Davis, California
7.1 · Do bigger houses sell for more?
The example · OLS on 29 house sales
The data: 29 houses sold in Central Davis in 1999
Data. AED_HOUSE.DTA: sale price and characteristics of 29 houses sold in Central Davis, California, in 1999.
| Variable | Meaning | Mean | SD | Min | Max |
|---|---|---|---|---|---|
price |
sale price, dollars | 253,910 | 37,391 | 204,000 | 375,000 |
size |
house size, square feet | 1,883 | 398 | 1,400 | 3,300 |
Other columns (bedrooms, bathrooms, lotsize, age, monthsold, list) wait for multiple regression in Chapters 10–11.
\[\text{price}_i = \beta_1 + \beta_2\,\text{size}_i + u_i\]
\(\beta_2\) is the population slope: the expected price difference between houses that differ by one square foot.
Code: load the data and fit the regression
!pip install -q pyfixest                     # pyfixest is not preinstalled in Colab
import pandas as pd                          # tabular data
import pyfixest as pf                        # OLS with R-style formulas
from scipy import stats                      # t-distribution: critical values, p-values
url = "https://raw.githubusercontent.com/quarcs-lab/data-open/master/AED/AED_HOUSE.DTA"
data_house = pd.read_stata(url)              # 29 house sales, Davis CA, 1999
print(data_house[["price", "size"]].describe())  # mean, SD, min, max of the two variables
model_basic = pf.feols("price ~ size", data=data_house)  # OLS, classical (iid) SEs
model_basic.summary() # coefficients, SEs, t, p, 95% CIs, R²Output: $73.77 per square foot, 6.6 standard errors from zero
| Variable | Coef. | SE | \(t\) | \(p\) | 95% CI |
|---|---|---|---|---|---|
| Intercept | 115,017.283 | 21,489.360 | 5.35 | < 0.001 | [70,924.76, 159,109.81] |
size |
73.771 | 11.175 | 6.60 | < 0.001 | [50.84, 96.70] |
N = 29 · classical (iid) SEs · \(R^2 = 0.617\) · degrees of freedom \(n - 2 = 27\)
- Coefficient: each extra square foot goes with $73.77 more in price, on average
- SE 11.175: the slope would typically move by about $11 from one sample of 29 houses to another
- \(t\) = 6.60 and CI [50.84, 96.70]: zero is far outside the range of plausible slopes
One table already answers the chapter’s questions. The rest of 7.1–7.7 explains where each column comes from and how to read it.
The line fits, but the houses scatter around it
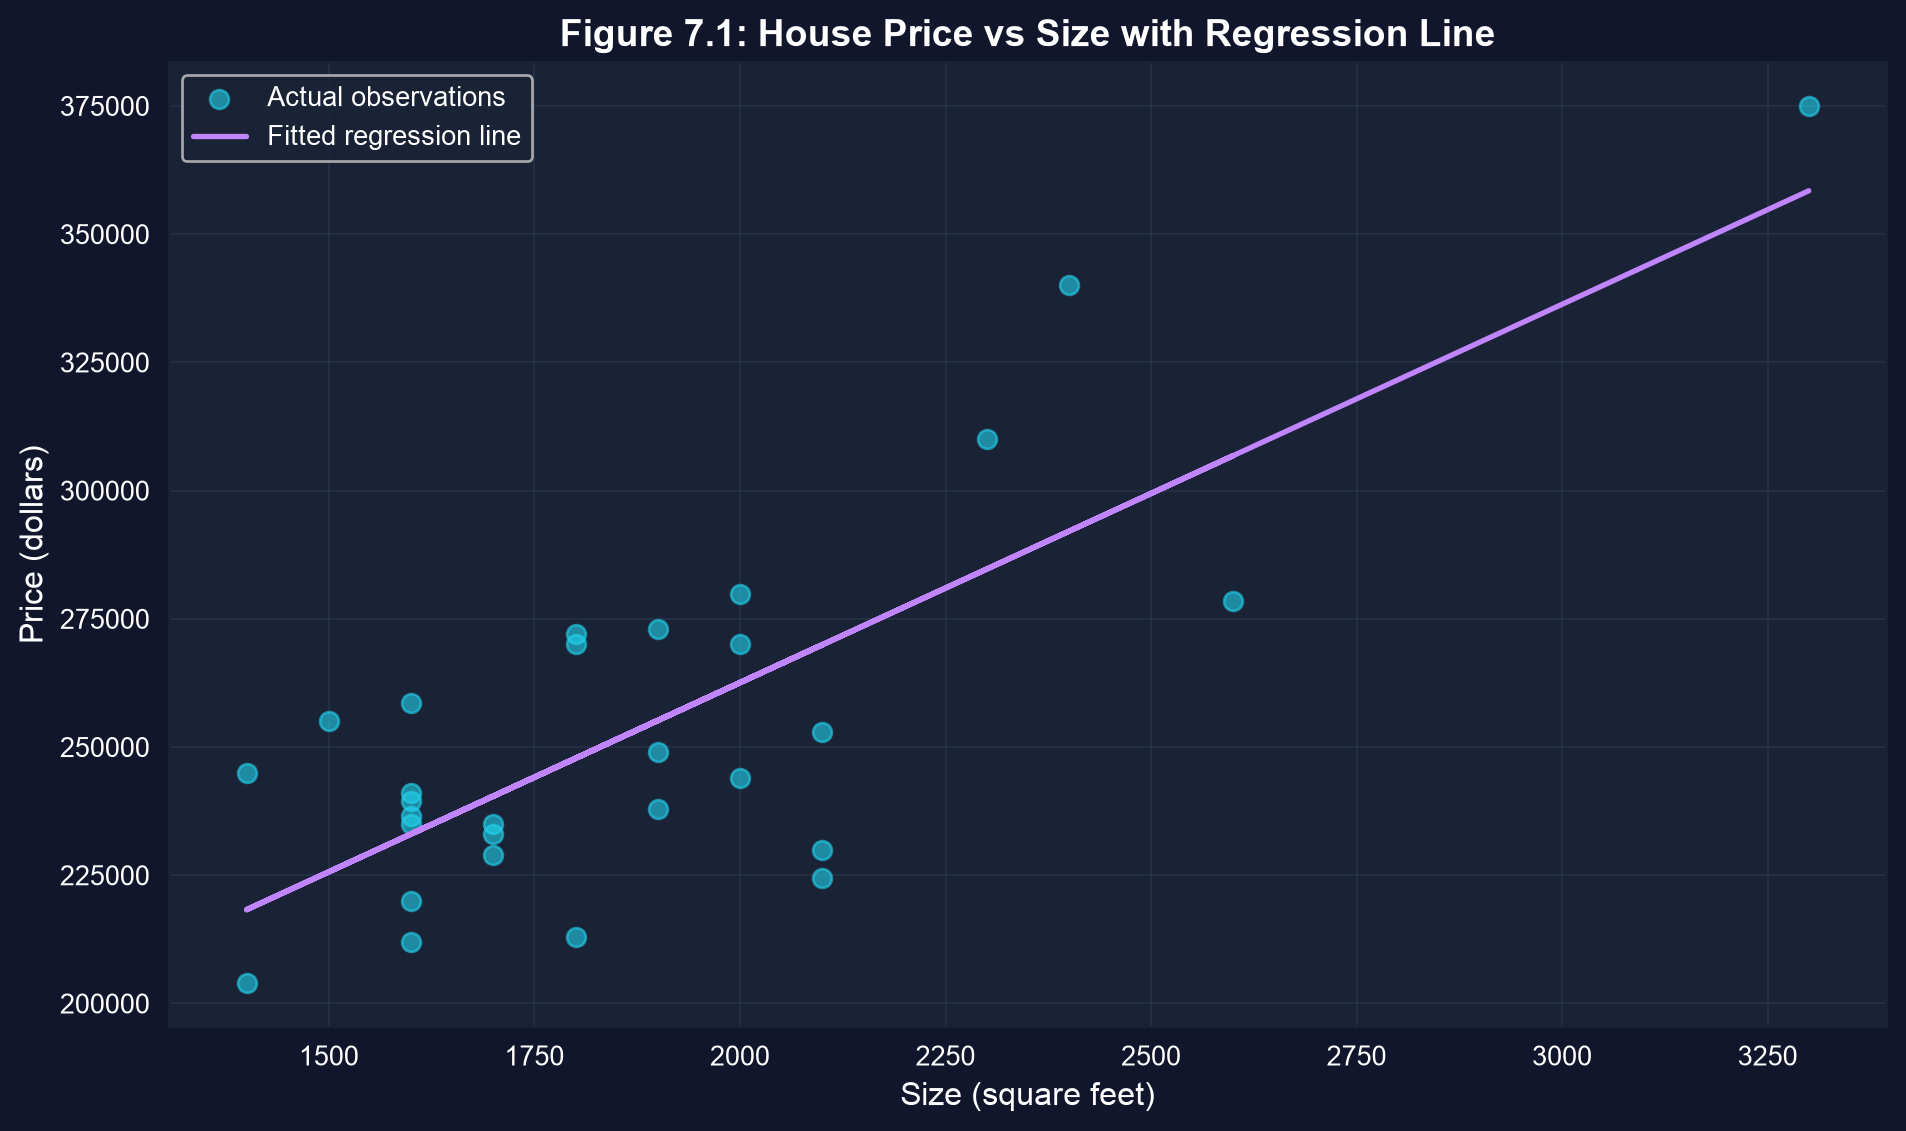
Inference quantifies the scatter: the larger the vertical gaps, the less precisely the slope is pinned down.
7.2 · The t-statistic: signal over noise
Standard error of the slope · the \(T(n-2)\) distribution
The slope is a random variable
- Population: \(E[y \mid x] = \beta_1 + \beta_2 x\), with unknown \(\beta_2\)
- Sample: OLS gives \(b_2 = 73.77\), one draw from the sampling distribution of \(b_2\)
- Under assumptions 1–4: \(\;E[b_2] = \beta_2\) and \(\operatorname{Var}[b_2] = \dfrac{\sigma_u^2}{\sum_{i=1}^{n}(x_i - \bar x)^2}\)
- We never know \(\sigma_u^2\), so we replace it with \(s_e^2 = \dfrac{1}{n-2}\sum_{i=1}^{n}(y_i - \hat y_i)^2\)
\[\operatorname{se}(b_2) = \frac{s_e}{\sqrt{\sum_{i=1}^{n}(x_i - \bar x)^2}}\]
Standard deviation describes the spread of the data; standard error describes the spread of the estimate across samples.
Three knobs set the standard error
\[\operatorname{se}(b_2) = \frac{s_e}{\sqrt{\sum (x_i - \bar x)^2}} \approx \frac{s_e}{\sqrt{n}\;s_x}\]
| Knob | Turn it up | Effect on \(\operatorname{se}(b_2)\) |
|---|---|---|
| Residual spread \(s_e\) | worse fit, more noise | larger |
| Sample size \(n\) | more houses | smaller, at rate \(1/\sqrt n\): quadruple \(n\) to halve the SE |
| Spread of \(x\), \(s_x\) | wider range of sizes | smaller: extreme \(x\) values pin down the slope |
A precise slope needs a tight fit, many observations and a wide spread in \(x\). All three are design choices, not luck.
Code: build the standard error by hand
!pip install -q pyfixest                     # pyfixest is not preinstalled in Colab
import numpy as np                           # square roots and sums
import pandas as pd                          # tabular data
import pyfixest as pf                        # OLS with R-style formulas
url = "https://raw.githubusercontent.com/quarcs-lab/data-open/master/AED/AED_HOUSE.DTA"
data_house = pd.read_stata(url); model_basic = pf.feols("price ~ size", data=data_house)
n = len(data_house)                          # 29 houses
e = model_basic.resid()                      # residuals y - y_hat
s_e = np.sqrt((e**2).sum() / (n - 2))        # standard error of the regression
x = data_house["size"]                       # the regressor
sxx = ((x - x.mean())**2).sum()              # total variation in x
se_formula = s_e / np.sqrt(sxx)              # classical se(b2), exact
se_shortcut = s_e / (np.sqrt(n) * x.std())   # chapter's shortcut with sqrt(n)
print(s_e, np.sqrt(sxx), se_formula, se_shortcut, model_basic.se()["size"])Output: the formula reproduces the table exactly
| Ingredient | Value |
|---|---|
| \(s_e\), standard error of the regression | 23,550.66 |
| \(\sqrt{\sum (x_i - \bar x)^2}\) | 2,107.46 |
| \(s_x\), SD of size | 398.27 |
| \(\operatorname{se}(b_2) = s_e / \sqrt{\sum (x_i - \bar x)^2}\) | 11.175 |
| Shortcut \(s_e / (\sqrt{n}\, s_x)\) | 10.98 |
pyfixest se()["size"] |
11.175 |
\(23{,}550.66 / 2{,}107.46 = 11.175\): nothing in the regression table is a black box.
The \(t\)-statistic standardizes the estimate
\[t = \frac{b_2 - \beta_2^{*}}{\operatorname{se}(b_2)} \;\sim\; T(n-2) \quad\text{under } H_0: \beta_2 = \beta_2^{*}\]
- If we knew \(\sigma_u\), the ratio would be standard normal, \(N(0,1)\)
- Estimating \(\sigma_u\) by \(s_e\) adds extra uncertainty, so the ratio follows Student’s \(t\) with \(n - 2\) degrees of freedom
- For \(H_0: \beta_2 = 0\): \(\;t = \dfrac{73.77}{11.17} = 6.60\)
\(t = 6.60\) means the slope sits 6.6 of its own standard errors above zero.
Code: extract the ingredients of \(t\)
# continues from the previous block (model_basic already fitted)
coef_size = model_basic.coef()["size"]       # b2
se_size = model_basic.se()["size"]           # se(b2)
t_stat_size = model_basic.tstat()["size"]    # t for H0: beta2 = 0
p_value_size = model_basic.pvalue()["size"]  # two-sided p-value
print(f"t = b2 / se(b2) = {coef_size:.4f} / {se_size:.4f} = {t_stat_size:.4f}")
print(f"p-value: {p_value_size:.6f}") # prints 0.000000 at 6 decimalsOutput: \(t = 73.7710 / 11.1749 = 6.6015\); \(p = 4.4 \times 10^{-7}\), which prints as 0.000000.
Scorecard after 7.2
| Question | Answer for the house slope |
|---|---|
| Is it precise? | \(\operatorname{se}(b_2) = 11.17\): about 15% of the estimate |
| Is it real? | \(t = 6.60\), far beyond any conventional cutoff |
| Does it matter? | to be judged in 7.4 |
| Is the SE honest? | classical SE so far; checked in 7.7 |
Precision is relative: an SE of 11 is small next to a slope of 74, and it would be huge next to a slope of 5.
7.3 · Confidence intervals: the slopes the data cannot rule out
Estimate ± critical value × standard error
A confidence interval is estimate ± margin of error
\[b_2 \;\pm\; t_{n-2,\,\alpha/2}\times\operatorname{se}(b_2)\]
\[73.77 \;\pm\; 2.052 \times 11.17 \;=\; 73.77 \pm 22.93 \;=\; [50.84,\ 96.70]\]
- \(t_{27,\,0.025} = 2.052\): the value that leaves 2.5% in each tail of \(T(27)\)
- Margin of error 22.93: the half-width of the interval
- Quick approximation: \(b_2 \pm 2\times\operatorname{se}(b_2)\)
The interval spans $46 per square foot: size clearly matters, but its price is pinned down only to “somewhere between $51 and $97”.
Code: the interval from pyfixest and by hand
!pip install -q pyfixest                     # pyfixest is not preinstalled in Colab
import pandas as pd, pyfixest as pf          # data and OLS
from scipy import stats                      # Student's t quantiles
url = "https://raw.githubusercontent.com/quarcs-lab/data-open/master/AED/AED_HOUSE.DTA"
data_house = pd.read_stata(url); model_basic = pf.feols("price ~ size", data=data_house)
print(model_basic.confint())                 # 95% CIs for intercept and slope
df = len(data_house) - 2                     # 27 degrees of freedom
t_crit = stats.t.ppf(0.975, df)              # 2.5% in the upper tail
b2, se2 = model_basic.coef()["size"], model_basic.se()["size"]
ci_lower, ci_upper = b2 - t_crit * se2, b2 + t_crit * se2   # estimate ± margin
print(t_crit, t_crit * se2, ci_lower, ci_upper)
z_lo, z_hi = b2 - 1.96 * se2, b2 + 1.96 * se2 # normal-based interval, for comparisonOutput: the manual interval matches confint() exactly
| Quantity | \(t(27)\)-based | Normal-based (for comparison) |
|---|---|---|
| Critical value | 2.052 | 1.960 |
| Margin of error | 22.93 | 21.90 |
| 95% CI for \(\beta_2\) | [50.84, 96.70] | [51.87, 95.67] |
confint() returns [50.84, 96.70] for size and [70,924.76, 159,109.81] for the intercept · normal column computed for these slides
With 27 degrees of freedom, the correct interval is 4.7% wider than the normal one: a small but real penalty for estimating \(\sigma_u\).
Small samples need heavier tails
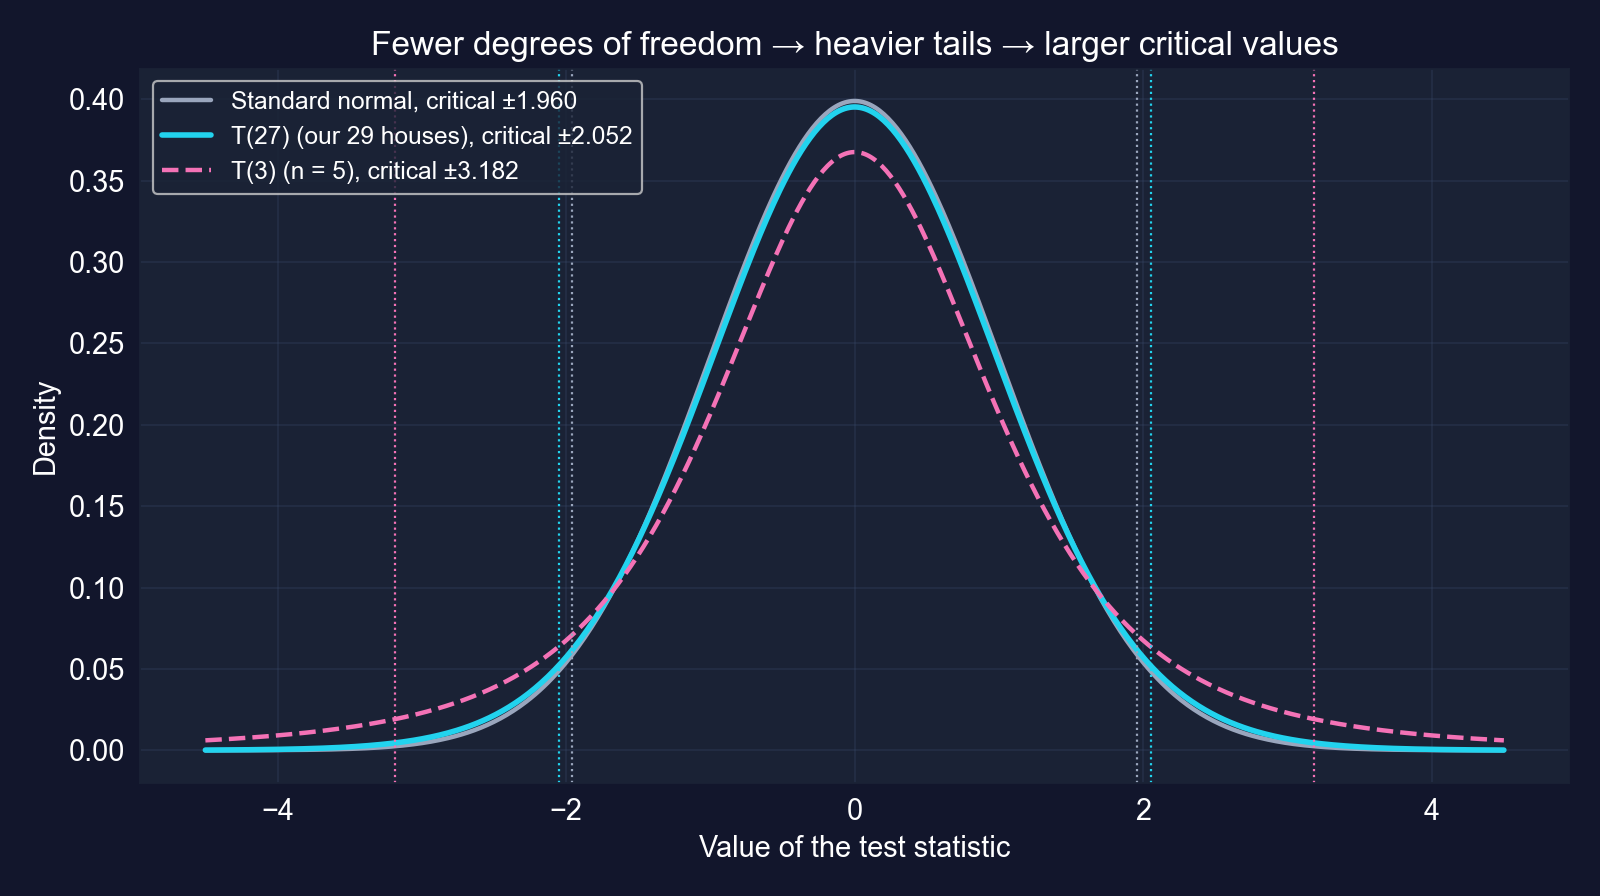
| \(n\) | df | \(t_{\text{df},\,0.025}\) | vs 1.960 |
|---|---|---|---|
| 5 | 3 | 3.182 | +62% |
| 10 | 8 | 2.306 | +18% |
| 29 | 27 | 2.052 | +5% |
| 30 | 28 | 2.048 | +5% |
| 100 | 98 | 1.984 | +1% |
| \(\infty\) | — | 1.960 | 0% |
Fewer degrees of freedom mean heavier tails, larger critical values and wider intervals. Above about 100 observations the difference is negligible.
The confidence level trades certainty for width
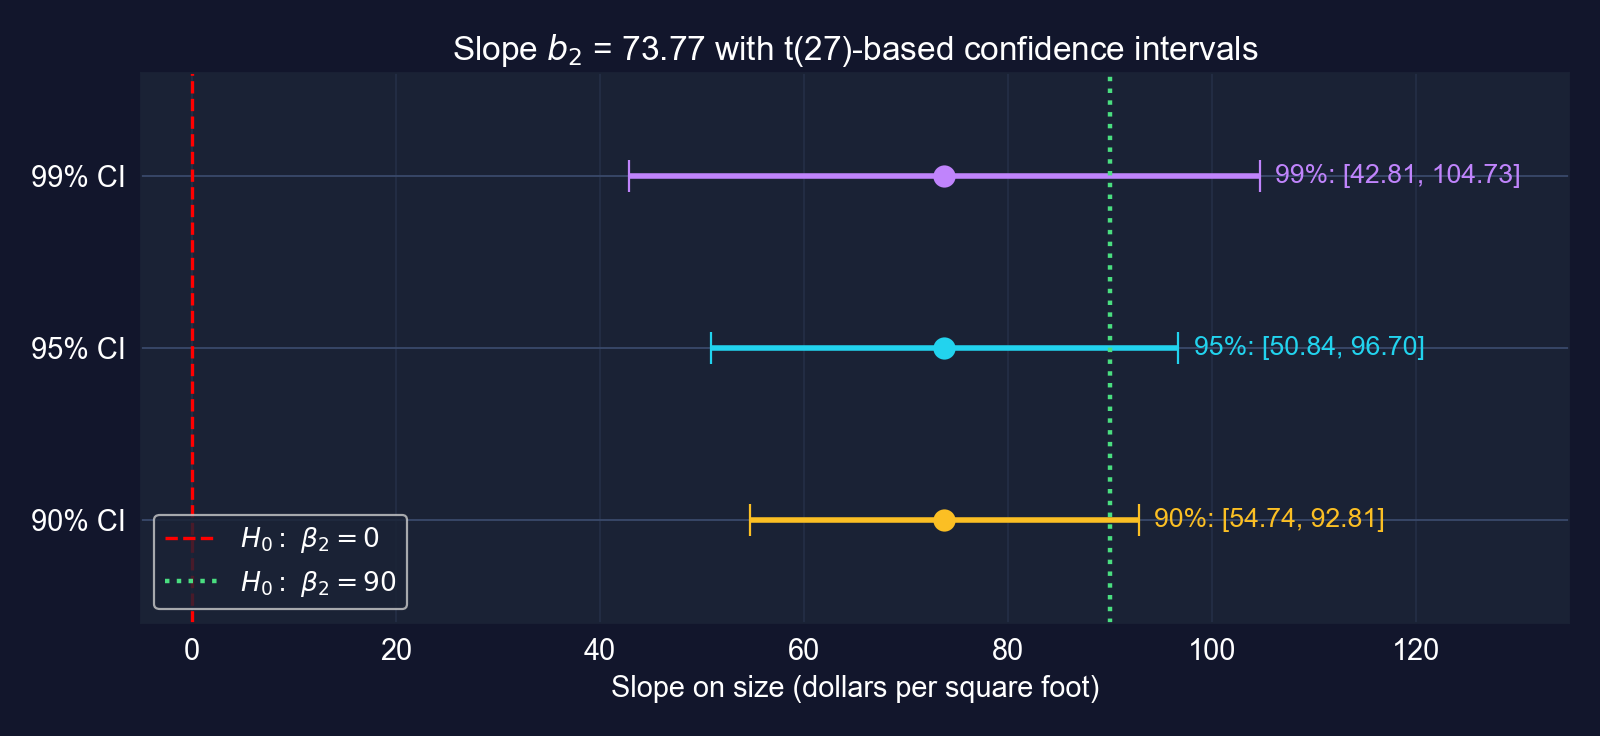
The same slope with 90%, 95% and 99% intervals. Zero is outside all three; 90 is inside all three.
90%: [54.74, 92.81] · 95%: [50.84, 96.70] · 99%: [42.81, 104.73]. Asking for more confidence buys a wider, less informative range.
What “95% confidence” does and does not mean
- Wrong: “there is a 95% probability that \(\beta_2\) lies between 50.84 and 96.70”
- Right: if we drew many samples and built an interval from each, about 95% of those intervals would contain \(\beta_2\)
- \(\beta_2\) is a fixed number; the interval is what varies from sample to sample
- Our interval [50.84, 96.70] either contains \(\beta_2\) or it does not; 95% describes the procedure’s long-run success rate
Width depends on three things: the confidence level, the sample size (through both the SE and the critical value) and the residual noise.
100 samples, 100 intervals: about 95 cover the truth
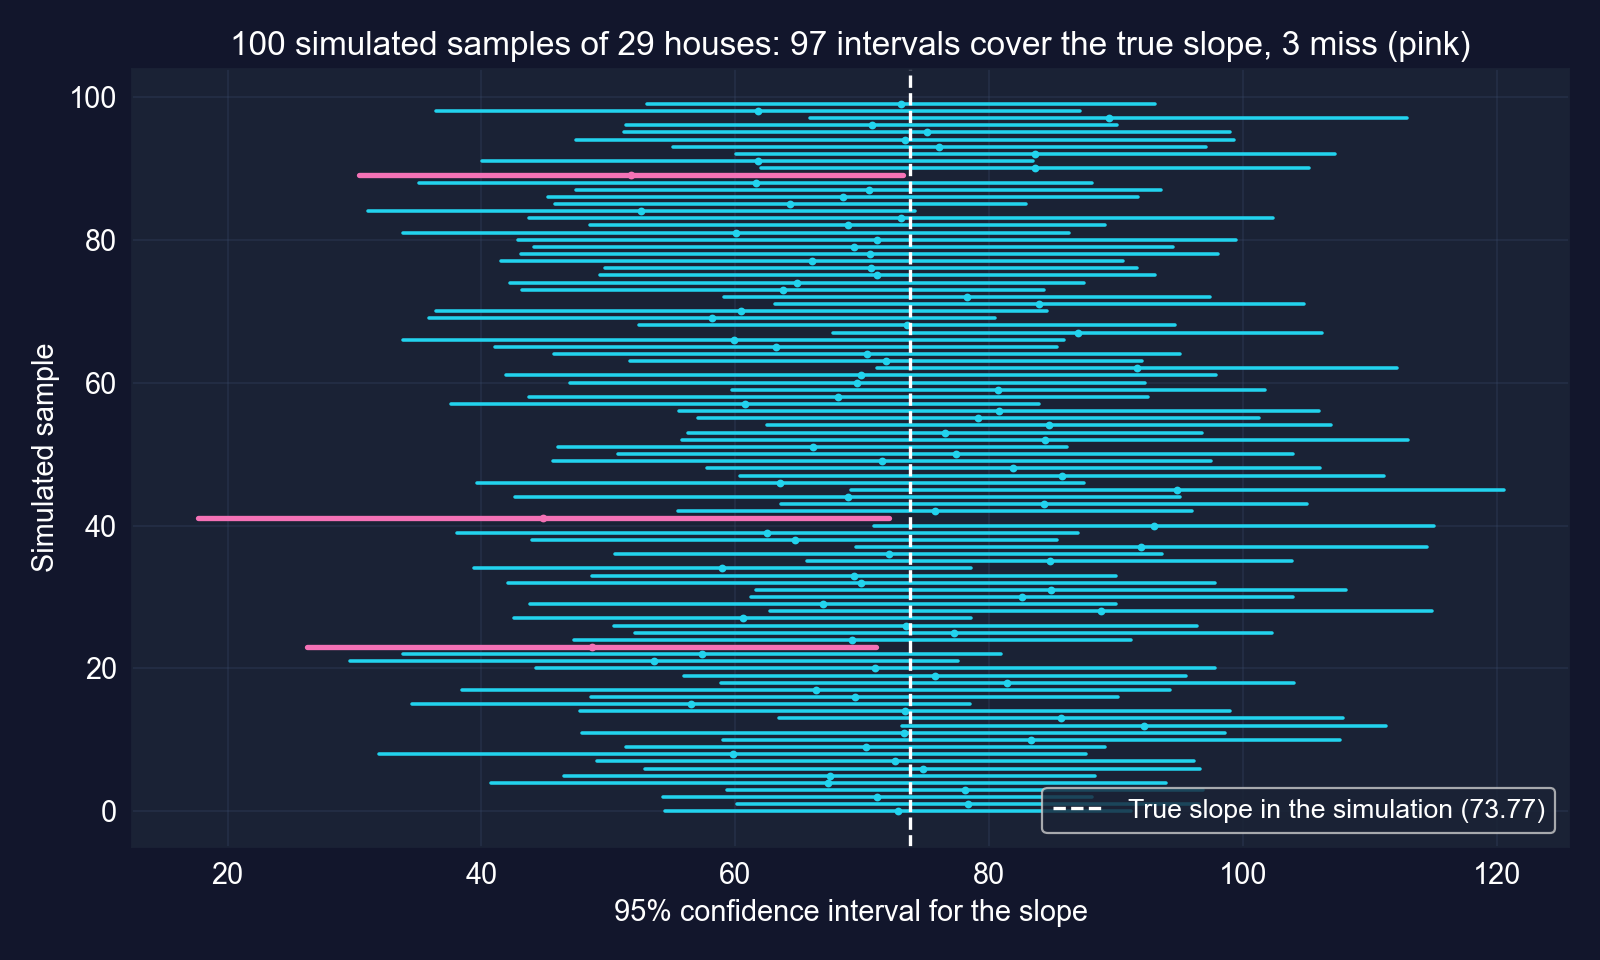
In this simulation, 97 of 100 intervals contain the true slope and 3 miss it. The 95% is a property of the procedure.
With five observations, the interval balloons
# continues from the previous block (pd, pf, stats already imported)
df_artificial = pd.DataFrame({"x": [1, 2, 3, 4, 5],    # the chapter's artificial data
                              "y": [1, 2, 2, 2, 3]})
model_artificial = pf.feols("y ~ x", data=df_artificial)   # OLS on 5 points
coef_x, se_x = model_artificial.coef()["x"], model_artificial.se()["x"]
t_crit_art = stats.t.ppf(0.975, 5 - 2)                 # only 3 degrees of freedom
print(coef_x, se_x, t_crit_art)                        # slope, SE, critical value
print(coef_x - t_crit_art * se_x, coef_x + t_crit_art * se_x) # 95% CI| \(b_2\) | SE | \(t\) | \(t_{3,\,0.025}\) | 95% CI |
|---|---|---|---|---|
| 0.400 | 0.115 | 3.46 | 3.182 | [0.03, 0.77] |
Even with \(t = 3.46\), the interval runs from almost zero to almost double the estimate: with 3 degrees of freedom the critical value is 3.182, not 1.96.
7.4 · Is the slope different from zero?
Tests of statistical significance · \(p\)-values · economic significance
The test of statistical significance
\[H_0: \beta_2 = 0 \qquad\text{vs.}\qquad H_a: \beta_2 \neq 0, \qquad t = \frac{b_2}{\operatorname{se}(b_2)} \sim T(n-2) \text{ under } H_0\]
- \(p\)-value rule: reject \(H_0\) at level \(\alpha\) if \(p = \Pr\big[\,|T_{n-2}| > |t|\,\big] < \alpha\)
- Critical-value rule: reject \(H_0\) if \(|t| > t_{n-2,\,\alpha/2}\)
- The two rules always agree; \(\alpha\) is the probability of a Type I error (rejecting a true \(H_0\))
- Never “accept” \(H_0\): we either reject it or fail to reject it
A regressor “matters” statistically when its coefficient is too far from zero to blame on sampling noise.
Code: run the test both ways
!pip install -q pyfixest                     # pyfixest is not preinstalled in Colab
import pandas as pd, pyfixest as pf; from scipy import stats
url = "https://raw.githubusercontent.com/quarcs-lab/data-open/master/AED/AED_HOUSE.DTA"
data_house = pd.read_stata(url); model_basic = pf.feols("price ~ size", data=data_house)
t_stat_size = model_basic.tstat()["size"]    # b2 / se(b2)
p_value_size = model_basic.pvalue()["size"]  # Pr[|T27| > |t|]
t_crit = stats.t.ppf(0.975, len(data_house) - 2)       # 5% two-sided cutoff
print(t_stat_size, p_value_size, t_crit)
print("Reject H0" if p_value_size < 0.05 else "Fail to reject H0")Output: size is significant at any conventional level
| \(H_0\) | \(t\) | \(p\) (two-sided) | Critical value, 5% | Decision |
|---|---|---|---|---|
| \(\beta_2 = 0\) | 6.60 | \(4.4\times 10^{-7}\) | ±2.052 | reject |
- \(|t| = 6.60 > 2.052\), and \(p < 0.001\): reject at 5%, 1% and far beyond
- Reading the \(p\)-value: if \(\beta_2\) were really 0, a \(|t|\) this large would occur in fewer than 1 in a million samples
- It is not the probability that \(H_0\) is true, and it does not measure how large the effect is
Conclusion in words: in Davis in 1999, larger houses sold for more, and the association is far too strong to be a fluke of this sample.
Statistically significant does not mean important
Statistical significance
- Is the effect distinguishable from zero?
- Driven by \(t = b_2/\operatorname{se}(b_2)\), so by \(n\), noise and spread in \(x\)
- With a huge \(n\), even a trivial effect is “significant”
Economic significance
- Is the effect large enough to matter?
- Driven by the magnitude of \(b_2\), in context
- Needs domain knowledge, not a table of critical values
Report the magnitude and its confidence interval, not just the stars. The interval answers both questions at once.
Is $73.77 per square foot economically large?
| Comparison | Implied price difference | Using the 95% CI |
|---|---|---|
| 10 extra square feet | $738 | — |
| 100 extra square feet | $7,377 | [$5,084, $9,670] |
| One SD of size (398 sq ft) | $29,381 | 11.6% of the mean price |
100 sq ft rows: chapter · CI and one-SD rows computed for these slides from \(b_2\) and its interval
Even the lower end of the interval, about $5,100 per 100 square feet, is a meaningful sum on a $254,000 house: the effect is both statistically and economically significant.
7.5 · Is the slope $90 per square foot?
Two-sided tests of a specific value · the CI–test duality
Testing a specific value: same recipe, new null
\[H_0: \beta_2 = 90 \qquad\text{vs.}\qquad H_a: \beta_2 \neq 90\]
\[t = \frac{b_2 - 90}{\operatorname{se}(b_2)} = \frac{73.77 - 90}{11.17} = -1.452\]
- Two-sided \(p = \Pr\big[\,|T_{27}| > 1.452\,\big]\)
- Reject at 5% only if \(|t| > 2.052\)
- Where could 90 come from? A realtor’s rule of thumb, a building-cost benchmark, a previous study
Only the numerator changes: the test asks how many standard errors the estimate is from the claimed value.
Code: test \(H_0: \beta_2 = 90\)
!pip install -q pyfixest                     # pyfixest is not preinstalled in Colab
import pandas as pd, pyfixest as pf; from scipy import stats
url = "https://raw.githubusercontent.com/quarcs-lab/data-open/master/AED/AED_HOUSE.DTA"
data_house = pd.read_stata(url); model_basic = pf.feols("price ~ size", data=data_house)
null_value, df = 90, len(data_house) - 2     # claimed slope; 27 degrees of freedom
coef_size, se_size = model_basic.coef()["size"], model_basic.se()["size"]
t_stat_90 = (coef_size - null_value) / se_size              # distance from 90 in SEs
p_value_90 = 2 * (1 - stats.t.cdf(abs(t_stat_90), df))      # two-sided p-value
print(t_stat_90, p_value_90, stats.t.ppf(0.975, df))        # t, p, critical value
print(model_basic.confint().loc["size"]) # is 90 inside the CI?Output: $90 per square foot is consistent with the data
| Value | |
|---|---|
| \(t\) | −1.452 |
| \(p\) (two-sided) | 0.158 |
| Critical value | ±2.052 |
| 95% CI | [50.84, 96.70] |
| Decision at 5% | do not reject |
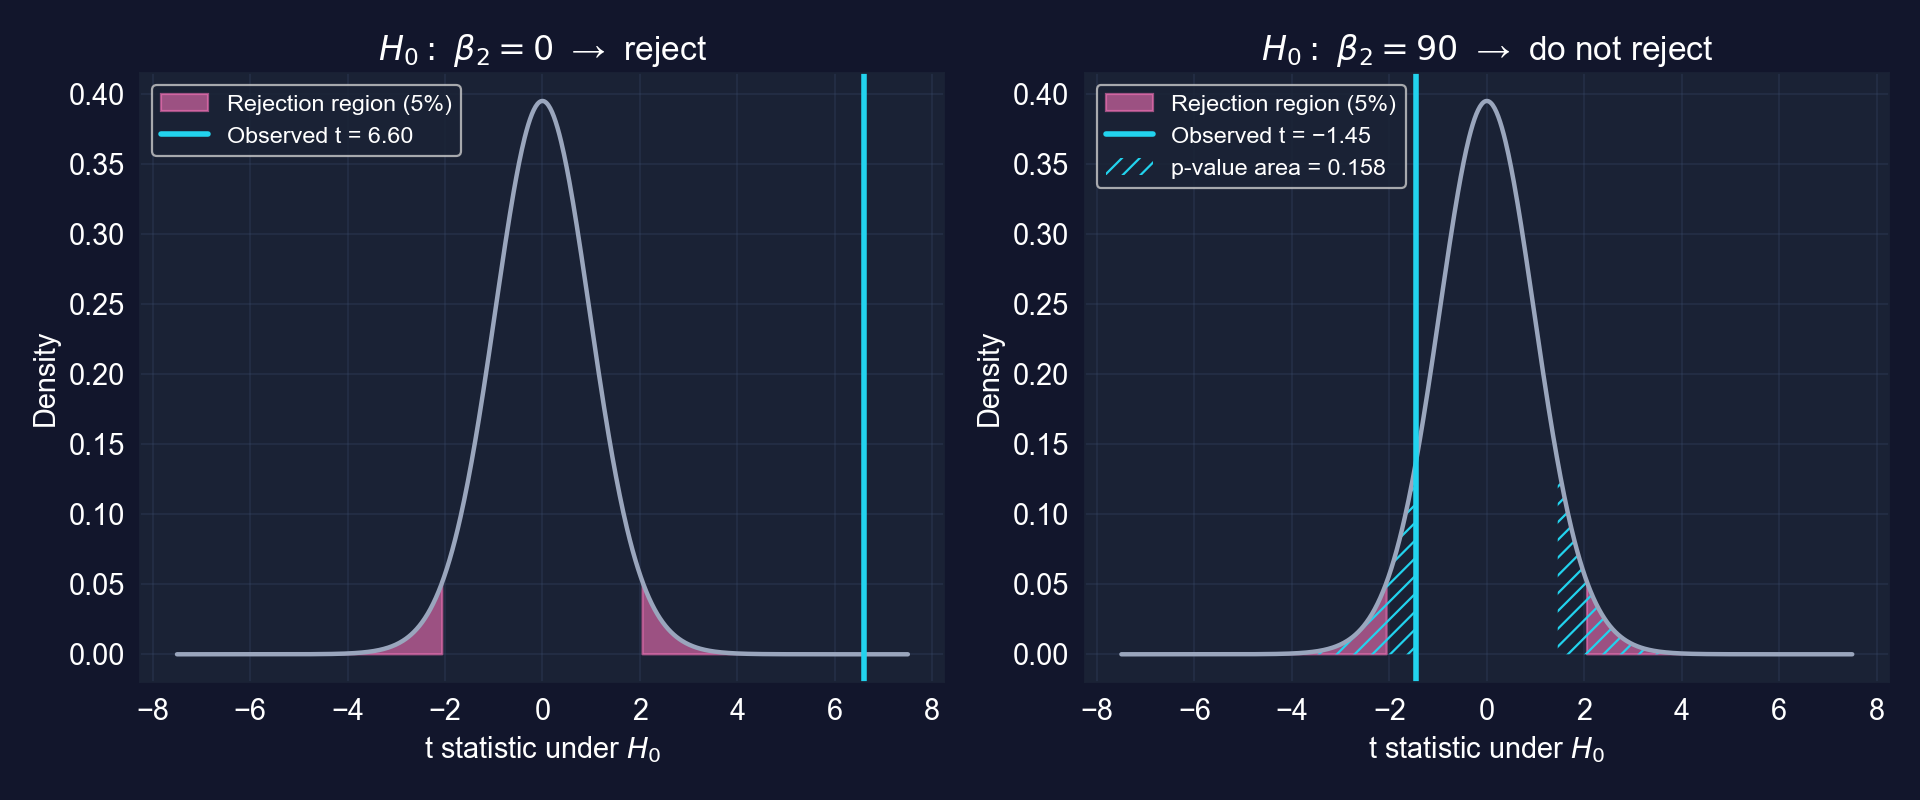
\(p = 0.158 > 0.05\) and 90 lies inside [50.84, 96.70]: two ways of saying the same thing.
A confidence interval is a family of tests
- Reject \(H_0: \beta_2 = \beta_2^{*}\) at 5% exactly when \(\beta_2^{*}\) is outside the 95% CI
- 0 is outside [50.84, 96.70] → reject; 90 is inside → do not reject
- But 60, 75 and 95 are inside too: the data are consistent with all of them
- “Do not reject \(\beta_2 = 90\)” does not mean “\(\beta_2 = 90\)”
Failing to reject is a statement about the data’s power, not proof of the null. Report the interval and every plausible value is visible at once.
7.6 · Is the slope less than $90?
One-sided directional tests
One-sided tests put the claim in the alternative
| Test | \(H_0\) | \(H_a\) (the claim) | Reject when | \(p\)-value |
|---|---|---|---|---|
| Upper tail | \(\beta_2 \le \beta_2^{*}\) | \(\beta_2 > \beta_2^{*}\) | \(t > t_{n-2,\,\alpha}\) | \(\Pr[T_{n-2} > t]\) |
| Lower tail | \(\beta_2 \ge \beta_2^{*}\) | \(\beta_2 < \beta_2^{*}\) | \(t < -t_{n-2,\,\alpha}\) | \(\Pr[T_{n-2} < t]\) |
- The claim you want to demonstrate goes in \(H_a\), so the data must prove it
- The whole 5% sits in one tail: \(t_{27,\,0.05} = 1.703\) instead of 2.052
- Choose the direction before seeing the data, from theory
A one-sided test has more power in the predicted direction, and none at all in the other.
Code: both one-sided tests of 90
!pip install -q pyfixest                     # pyfixest is not preinstalled in Colab
import pandas as pd, pyfixest as pf; from scipy import stats
url = "https://raw.githubusercontent.com/quarcs-lab/data-open/master/AED/AED_HOUSE.DTA"
data_house = pd.read_stata(url); model_basic = pf.feols("price ~ size", data=data_house)
df = len(data_house) - 2                     # 27 degrees of freedom
t_stat_90 = (model_basic.coef()["size"] - 90) / model_basic.se()["size"]
p_value_upper = 1 - stats.t.cdf(t_stat_90, df)   # Ha: beta2 > 90 (right tail)
p_value_lower = stats.t.cdf(t_stat_90, df)       # Ha: beta2 < 90 (left tail)
t_crit_one = stats.t.ppf(0.95, df)               # one-sided 5% critical value
print(t_stat_90, p_value_upper, p_value_lower, t_crit_one)Output: the direction of the claim decides everything
| Lower tail | Upper tail | |
|---|---|---|
| \(H_a\) | \(\beta_2 < 90\) | \(\beta_2 > 90\) |
| \(t\) | −1.452 | −1.452 |
| \(p\) | 0.079 | 0.921 |
| Cutoff, 5% | −1.703 | +1.703 |
| Decision | do not reject | do not reject |
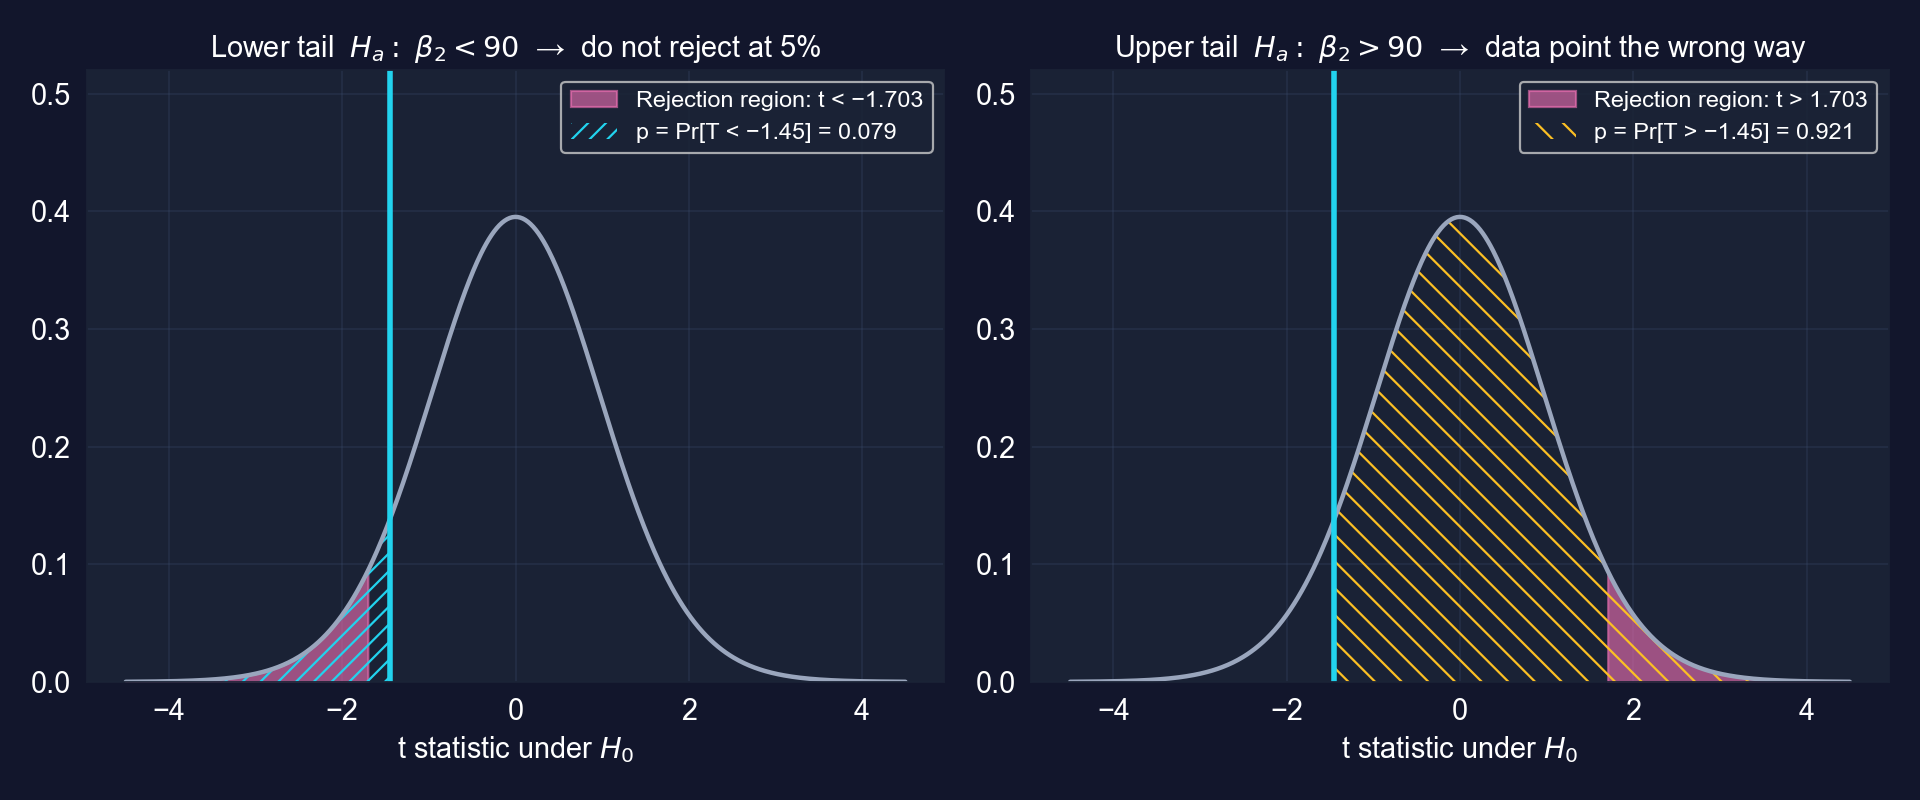
The evidence that the slope is below $90 is suggestive (\(p = 0.079\)): not enough at 5%, enough at 10%. The evidence that it is above $90 is nil (\(p = 0.921\)).
Halve the \(p\)-value only when the estimate points your way
- Software reports two-sided \(p\)-values for \(H_0: \beta_2 = 0\)
- One-sided test of significance: if \(b_2\) has the predicted sign, one-sided \(p\) = two-sided \(p\) / 2
- If \(b_2\) has the wrong sign, one-sided \(p > 0.5\): rejection is impossible
- House example: \(H_a: \beta_2 > 0\) gives \(p = 2.2\times 10^{-7}\), half of \(4.4\times 10^{-7}\)
An earlier version of this deck halved the \(p\)-value for \(H_a: \beta_2 > 90\). That is wrong: with \(b_2 = 73.77 < 90\) the correct one-sided \(p\) is 0.921.
7.7 · Are the standard errors honest?
Heteroskedasticity · HC1 robust standard errors · residual diagnostics
Heteroskedasticity breaks the classical standard error
Assumption 3 says \(\operatorname{Var}[u_i \mid x_i] = \sigma_u^2\) for every observation. Heteroskedasticity: \(\operatorname{Var}[u_i \mid x_i] = \sigma_i^2\) varies with \(i\).
| What | Under heteroskedasticity |
|---|---|
| Coefficient \(b_2\) | still unbiased and consistent |
| Classical \(\operatorname{se}(b_2)\) | wrong, too small or too large |
| \(t\), \(p\), confidence intervals | invalid (wrong size, wrong coverage) |
The fix leaves the estimate alone and repairs the uncertainty: a heteroskedasticity-robust standard error.
Classical vs robust: one formula, one change
\[\operatorname{se}(b_2) = \frac{s_e}{\sqrt{\sum (x_i - \bar x)^2}} \qquad\qquad \operatorname{se}_{\text{HC0}}(b_2) = \frac{\sqrt{\sum e_i^2\,(x_i - \bar x)^2}}{\sum (x_i - \bar x)^2}\]
- Classical: one pooled residual variance \(s_e^2\) for every observation
- Robust (White / Huber–White): each squared residual \(e_i^2\) is weighted by that observation’s leverage \((x_i - \bar x)^2\)
- HC1 = HC0 × \(\sqrt{n/(n-k)}\), a degrees-of-freedom correction; with \(n = 29\), \(k = 2\) the factor is 1.036
- Variants: HC2 (leverage-weighted), HC3 (more conservative); HAC for time series, cluster-robust for grouped data
The chapter prints the HC0 formula (10.93 for the house slope), but its code and tables use HC1 (vcov="HC1", 11.33), which matches Stata’s robust.
Code: re-estimate with HC1 robust standard errors
!pip install -q pyfixest                     # pyfixest is not preinstalled in Colab
import pandas as pd, pyfixest as pf          # data and OLS
url = "https://raw.githubusercontent.com/quarcs-lab/data-open/master/AED/AED_HOUSE.DTA"
data_house = pd.read_stata(url)
model_basic = pf.feols("price ~ size", data=data_house)              # classical SEs
robust_results = pf.feols("price ~ size", data=data_house, vcov="HC1")  # robust SEs
comparison_df = pd.DataFrame({
    "Coefficient": model_basic.coef(),            # identical in both fits
    "Std. Error": model_basic.se(),               # classical
    "Robust SE": robust_results.se(),             # HC1
    "t-stat (standard)": model_basic.tstat(),
    "t-stat (robust)": robust_results.tstat(),
})
print(comparison_df); robust_results.summary() # full table reports "Inference: HC1"Output: the slope’s SE barely moves
| Variable | Coef. | Classical SE | Robust SE | Change | Robust \(t\) | Robust 95% CI |
|---|---|---|---|---|---|---|
| Intercept | 115,017.3 | 21,489.4 | 20,298.7 | −5.5% | 5.67 | [73,368, 156,667] |
size |
73.771 | 11.175 | 11.330 | +1.4% | 6.51 | [50.52, 97.02] |
N = 29 · HC1 SEs · robust \(p < 0.001\) for both coefficients · \(R^2 = 0.617\) (unchanged)
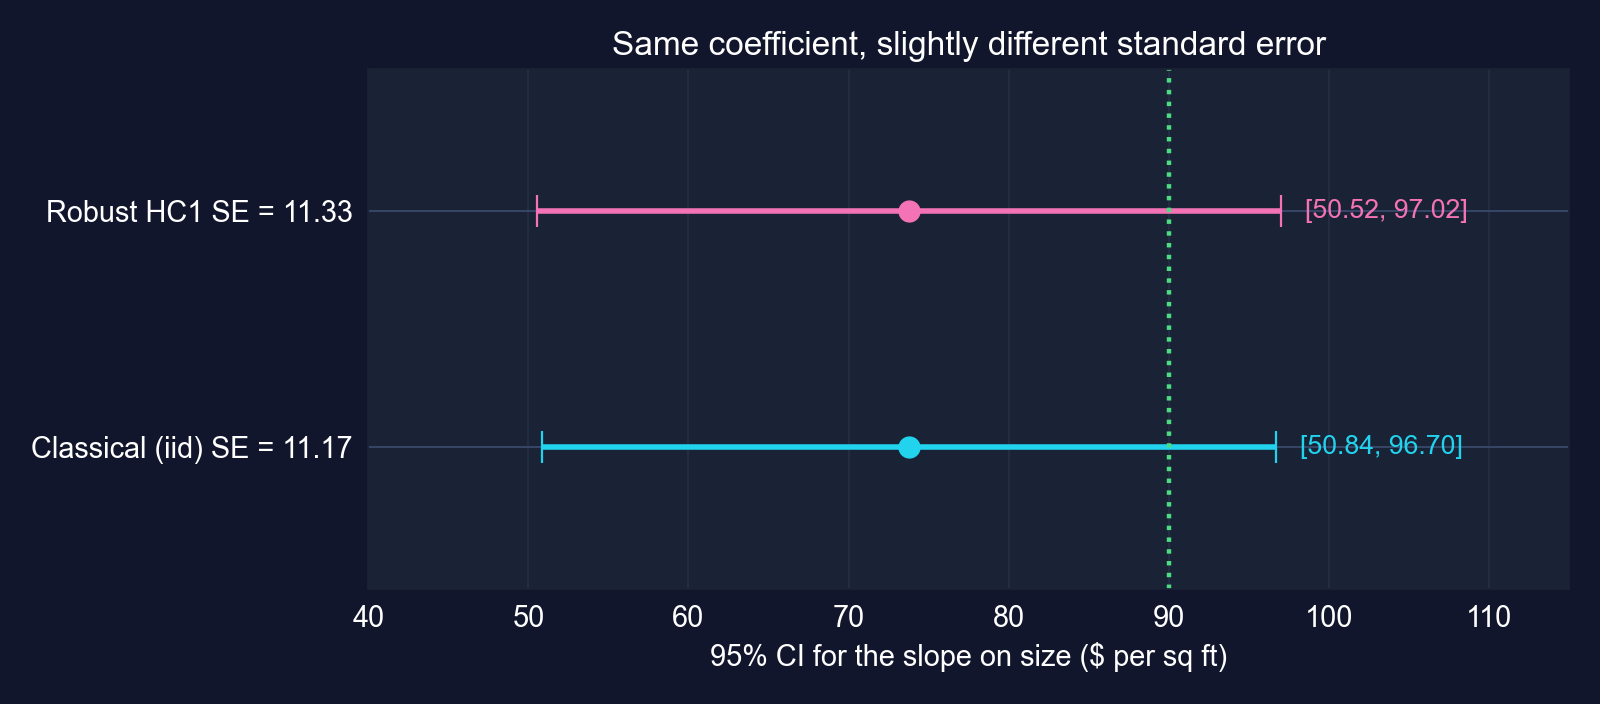
Robust inference reaches the same verdicts: size is significant (\(t = 6.51\)), and $90 is still not rejected (robust \(t = -1.43\), \(p = 0.163\)).
Residual check: no strong funnel, but only 29 points
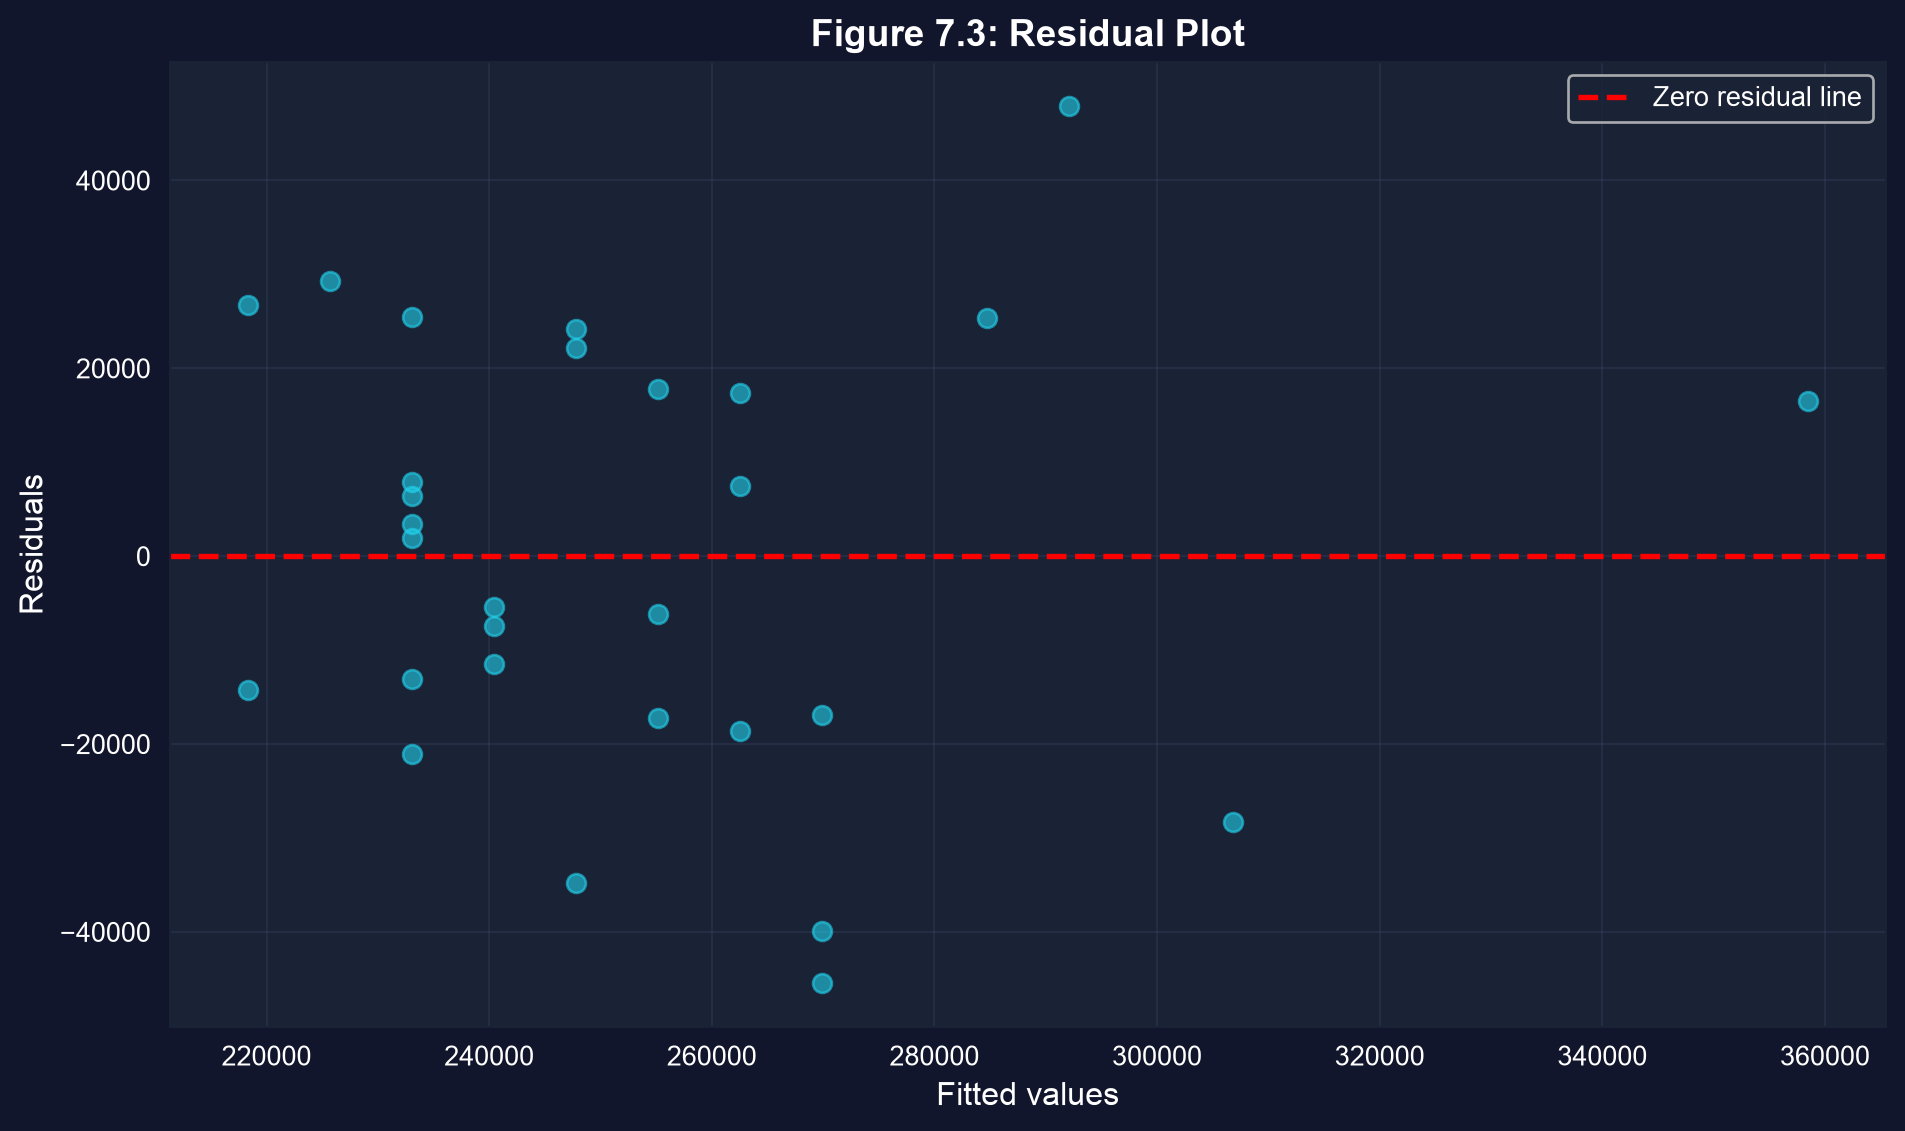
| Fitted value | Houses | Residual SD |
|---|---|---|
| at or below median | 16 | $19,258 |
| above median | 13 | $27,670 |
Split computed for these slides; ties at the median make the halves unequal.
The spread is somewhat larger for expensive houses, but there is no clear funnel, and the robust SE agrees with the classical one. With 29 points, the eye cannot settle the question; the robust SE can.
Best practice: decide on the SE before you look at the results
- Cross-section: heteroskedasticity-robust (
vcov="HC1") by default - Time series: HAC (Newey–West) SEs; grouped data: cluster-robust SEs
- Do not pre-test for heteroskedasticity and then choose; just use robust SEs
- Never switch between classical and robust SEs to obtain significance: that is \(p\)-hacking
- If robust SEs are much larger than classical ones, investigate the model, not just the SE
Robust SEs are cheap insurance: when errors are homoskedastic they stay close to classical SEs; when they are not, they keep inference honest in large samples.
Scorecard: the house slope after 7.1–7.7
| Question | Answer |
|---|---|
| Is it precise? | SE 11.17 (classical), 11.33 (robust); 95% CI about $46 wide |
| Is it real? | \(t = 6.60\) (robust 6.51), \(p < 0.001\): reject \(\beta_2 = 0\) |
| Which values are plausible? | [50.84, 96.70]: $90 not rejected two-sided (\(p = 0.158\)) or one-sided at 5% (\(p = 0.079\)) |
| Does it matter? | $7,377 per 100 sq ft; even the lower CI end ($5,084) is sizeable |
| Is the SE honest? | robust SE within 1.4% of classical; residuals show no strong funnel |
A complete answer reports all five rows, not only the stars: magnitude, precision, tests, plausible range and the SE used.
Act II-b · Two case studies, every task
The full toolkit on new data: 108 countries · 333 municipalities
Case Study 1 · Capital and labor productivity across 108 countries
Convergence Clubs data (Mendez 2020) · 2014 cross-section · Tasks 1–6
The question: how tightly is productivity tied to capital?
Research question. In 2014, how much higher is output per worker in countries with more capital per worker, and how precisely can we say it?
\[\text{productivity}_i = \beta_1 + \beta_2\,\text{capital}_i + u_i\]
productivity=lp, real GDP per worker (dollars);capital=kl, physical capital per worker (dollars)- 108 countries: Europe 30, Asia 28, Africa 26, Americas 22, Oceania 2
- The chapter frames this as background to convergence; strictly, a cross-section of levels does not test convergence, which is about growth rates (Key Concept 7.7)
What we can test here is the strength and precision of a cross-country association, with the tools of 7.1–7.7.
Code: load the 2014 cross-section
!pip install -q pyfixest                     # pyfixest is not preinstalled in Colab
import pandas as pd, pyfixest as pf          # data and OLS
from scipy import stats                      # t-distribution for manual tests
url_cc = "https://raw.githubusercontent.com/quarcs-lab/mendez2020-convergence-clubs-code-data/master/assets/dat.csv"
data_convergence = pd.read_csv(url_cc)       # 108 countries x 25 years (1990-2014)
data_2014 = data_convergence[data_convergence["year"] == 2014].copy()  # one cross-section
data_2014["productivity"] = data_2014["lp"]  # labor productivity: GDP per worker
data_2014["capital"] = data_2014["kl"]       # physical capital per worker
print(f"Sample: {len(data_2014)} countries in 2014")
print(data_2014["region"].value_counts())    # regional composition
data_2014[["productivity", "capital"]].describe() # summary statisticsOutput: enormous dispersion across countries
| Variable | Mean | SD | Min | Median | Max |
|---|---|---|---|---|---|
productivity ($ per worker) |
40,977 | 33,853 | 1,371 | 32,781 | 142,220 |
capital ($ per worker) |
165,854 | 158,299 | 2,482 | 108,046 | 552,395 |
N = 108 countries, 2014
Output per worker varies about 100-fold and capital per worker about 200-fold: plenty of variation in \(x\), which makes the slope precise, and a hint that the error variance may not be constant.
Task 1 code: estimate the relationship
# continues from the previous block (data_2014 already built)
model_convergence = pf.feols("productivity ~ capital", data=data_2014)  # classical SEs
beta2 = model_convergence.coef()["capital"]       # slope
se_beta2 = model_convergence.se()["capital"]      # classical SE
t_stat = model_convergence.tstat()["capital"]     # t for H0: beta2 = 0
p_value = model_convergence.pvalue()["capital"]   # two-sided p-value
ci_95 = model_convergence.confint().loc["capital"]  # 95% CI
model_convergence.summary() # full tableTask 1 output: 20 cents of output per dollar of capital
| Variable | Coef. | SE | \(t\) | \(p\) | 95% CI |
|---|---|---|---|---|---|
| Intercept | 7,894.468 | 1,713.521 | 4.61 | < 0.001 | [4,497.25, 11,291.69] |
capital |
0.1995 | 0.0075 | 26.63 | < 0.001 | [0.1846, 0.2143] |
N = 108 · classical (iid) SEs · \(R^2 = 0.870\) · df = 106
- (a) Coefficient: a country with $1,000 more capital per worker has, on average, about $199 more output per worker
- (b) CI: the slope is pinned down to 0.185–0.214, a narrow range
- (c) Significance: \(t = 26.63\), so \(p\) is essentially zero: reject \(\beta_2 = 0\)
(d) Economically large: a one-SD difference in capital ($158,299) goes with $31,576 more output per worker, 77% of the mean.
Task 2 code: test three hypotheses about the slope
# continues from the previous block (beta2, se_beta2, t_stat, p_value defined)
df_c = int(model_convergence._N) - len(model_convergence.coef())  # 108 - 2 = 106
t_test_05 = (beta2 - 0.5) / se_beta2                               # (b) H0: beta2 = 0.5
p_value_05 = 2 * (1 - stats.t.cdf(abs(t_test_05), df=df_c))        # two-sided
null_value_c = 0.30                                                 # (c) pessimist's bound
t_test_pessimist = (beta2 - null_value_c) / se_beta2                # distance from 0.30
p_value_pessimist_lower = stats.t.cdf(t_test_pessimist, df=df_c)    # Ha: beta2 < 0.30
print(t_stat, p_value, t_test_05, p_value_05)                       # (a) and (b)
print(t_test_pessimist, p_value_pessimist_lower) # (c)Task 2 output: the data reject 0.5 and back the pessimist
| Hypotheses | \(t\) | \(p\) | Decision at 5% |
|---|---|---|---|
| (a) \(H_0: \beta_2 = 0\) vs \(\beta_2 \neq 0\) | 26.63 | < 0.001 | reject: capital matters |
| (b) \(H_0: \beta_2 = 0.5\) vs \(\beta_2 \neq 0.5\) | −40.12 | < 0.001 | reject: slope is far below 0.5 |
| (c) \(H_0: \beta_2 \ge 0.30\) vs \(H_a: \beta_2 < 0.30\) | −13.42 | \(6.7\times 10^{-25}\) | reject \(H_0\): evidence for \(\beta_2 < 0.30\) |
df = 106 · classical SEs, as in the chapter’s Task 2
The pessimist’s claim is not rejected; it is supported. Rejecting \(H_0: \beta_2 \ge 0.30\) is how a one-sided test confirms a claim placed in \(H_a\).
Task 3 code: robust standard errors
# continues from the previous block (classical fit and tests done)
robust_model = pf.feols("productivity ~ capital", data=data_2014, vcov="HC1")
se_beta2_robust = robust_model.se()["capital"]          # HC1 SE
t_stat_robust = robust_model.tstat()["capital"]         # robust t
pct_change = 100 * (se_beta2_robust - se_beta2) / se_beta2   # % change in SE
ci_95_robust = robust_model.confint().loc["capital"]    # robust 95% CI
print(se_beta2, se_beta2_robust, pct_change, t_stat, t_stat_robust)
print(ci_95.values, ci_95_robust.values) # classical vs robust CITask 3 output: the robust SE is 48% larger
| Variable | Coef. | Classical SE | Robust SE | Change | Robust \(t\) | Robust 95% CI |
|---|---|---|---|---|---|---|
| Intercept | 7,894.468 | 1,713.521 | 1,356.336 | −20.8% | 5.82 | [5,205.40, 10,583.54] |
capital |
0.1995 | 0.0075 | 0.0111 | +48.4% | 17.94 | [0.1774, 0.2215] |
N = 108 · HC1 SEs · robust \(p < 0.001\) for both · classical CI for the slope: [0.1846, 0.2143]
- The slope’s SE grows by half: \(t\) falls from 26.63 to 17.94, and the interval widens by 48%
- The verdict on \(\beta_2 = 0\) does not change, but the precision we claimed in Task 1 was overstated
- Robust re-tests (computed for these slides): \(\beta_2 = 0.5\) gives \(t = -27.03\); \(\beta_2 = 0.30\) gives \(t = -9.04\); same decisions
A 48% gap is a loud signal of heteroskedasticity. Report the robust SE; the classical one claims precision the data do not have.
Where the heteroskedasticity comes from
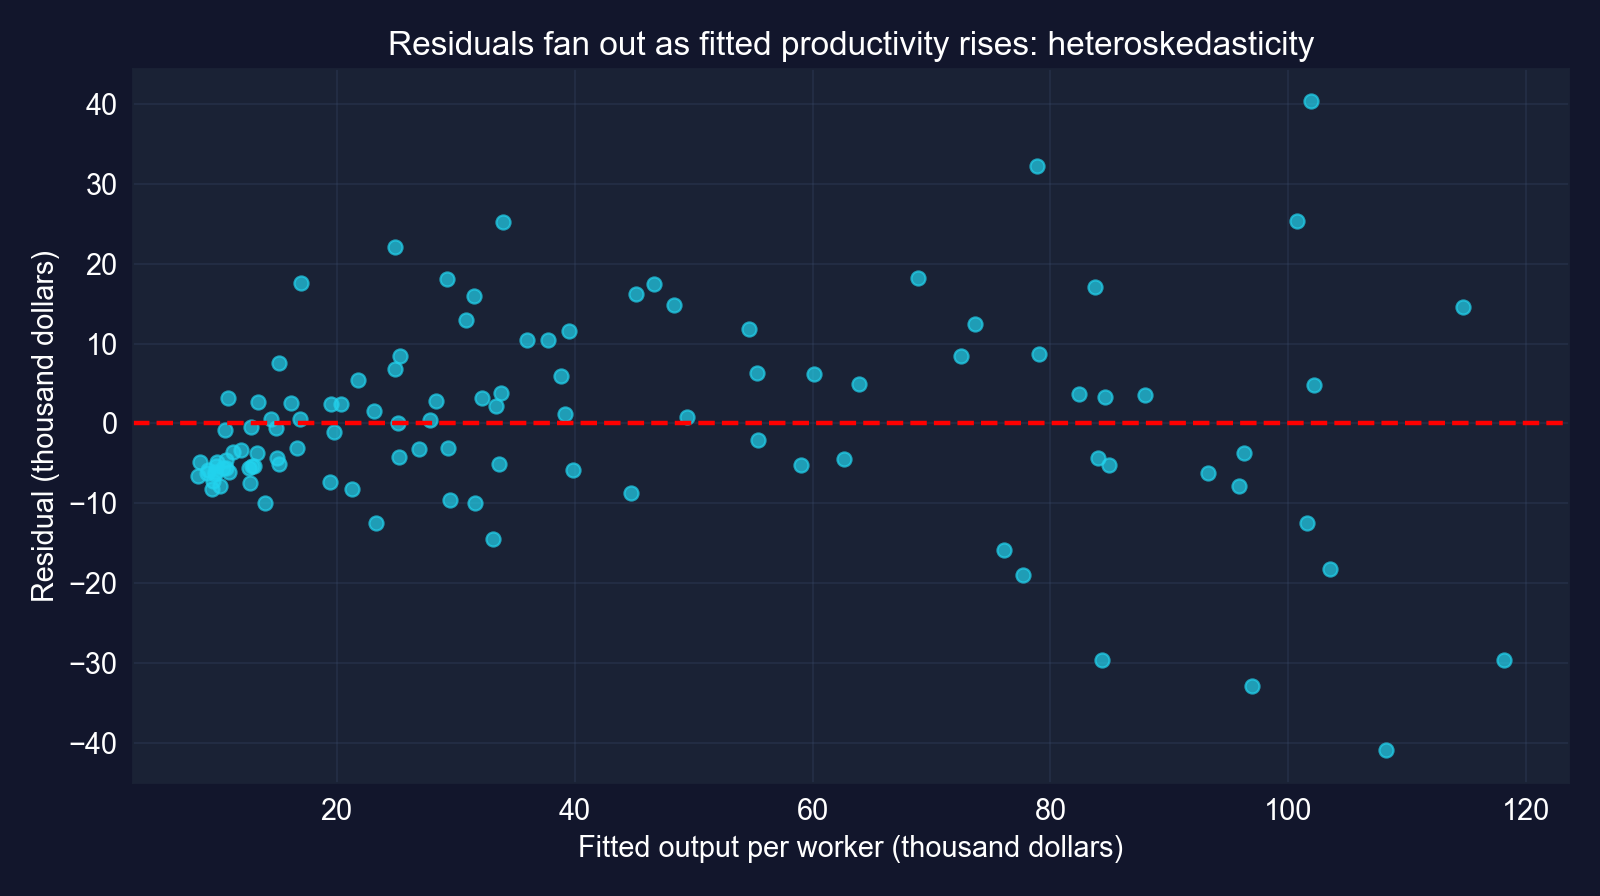
Residuals fan out: residual SD is $6,822 for the lower half of fitted values and $15,795 for the upper half. Poor countries also cluster below the line, a sign the straight line misses some curvature.
Task 4 code: does the slope differ by income group?
# continues from the previous block
threshold = data_2014["productivity"].median()             # the chapter's split
high_income = data_2014[data_2014["productivity"] > threshold].copy()
developing = data_2014[data_2014["productivity"] <= threshold].copy()
robust_high = pf.feols("productivity ~ capital", data=high_income, vcov="HC1")
robust_dev = pf.feols("productivity ~ capital", data=developing, vcov="HC1")
for name, res in [("High-income", robust_high), ("Developing", robust_dev)]:
    b, se = res.coef()["capital"], res.se()["capital"]
    t_05 = (b - 0.5) / se; dfx = int(res._N) - len(res.coef())   # test beta2 = 0.5
print(name, int(res._N), b, se, res.tstat()["capital"], t_05, 2 * stats.t.sf(abs(t_05), dfx))Task 4 output: a flatter slope among high-productivity countries
| Group | N | Slope | Robust SE | \(t\) | 95% CI | \(t\) for \(\beta_2 = 0.5\) | \(R^2\) |
|---|---|---|---|---|---|---|---|
| High productivity | 54 | 0.1541 | 0.0172 | 8.97 | [0.1196, 0.1886] | −20.13 | 0.680 |
| Low productivity | 54 | 0.2059 | 0.0209 | 9.84 | [0.1639, 0.2479] | −14.06 | 0.722 |
| Full sample | 108 | 0.1995 | 0.0111 | 17.94 | [0.1774, 0.2215] | −27.03 | 0.870 |
HC1 SEs · split at median productivity, $32,781 · df = 52 in each half · all \(p < 0.001\)
Both slopes are significant and both are far below 0.5. Taken at face value, capital goes with less extra output in richer countries, consistent with diminishing returns.
Caveat: splitting on the outcome distorts the slopes
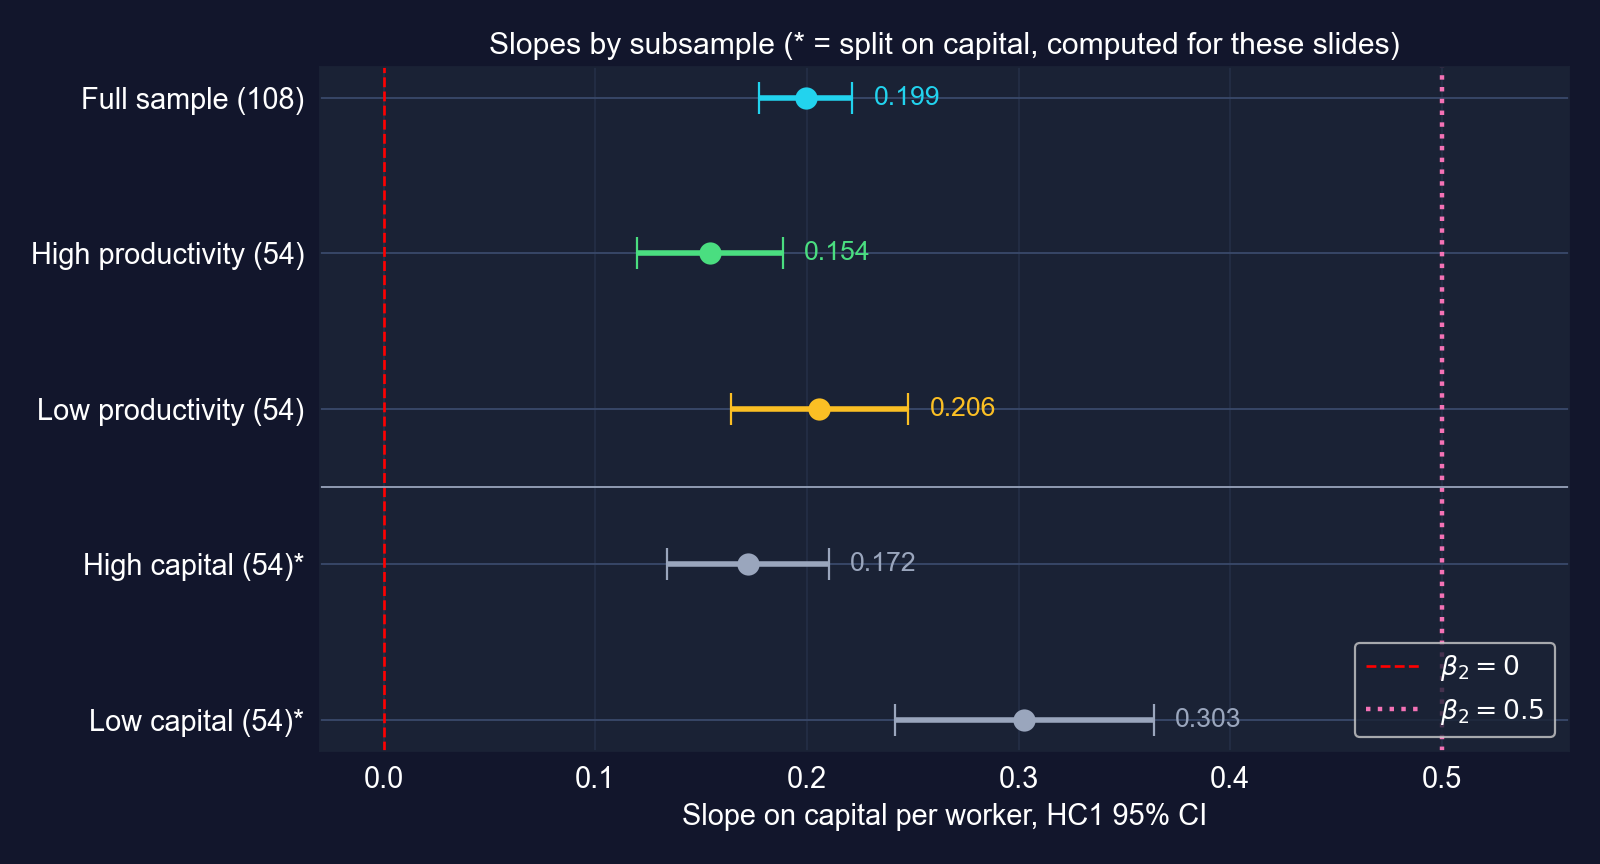
| Split on capital* | Slope | Robust SE |
|---|---|---|
| High capital (54) | 0.1720 | 0.0190 |
| Low capital (54) | 0.3026 | 0.0305 |
* computed for these slides · split at median capital, $108,046
Selecting on \(y\) truncates the outcome within each group and flattens both slopes. Splitting on \(x\) avoids that, and the low-capital slope comes out about 47% steeper than the chapter’s 0.206.
Task 5: one picture of the full analysis
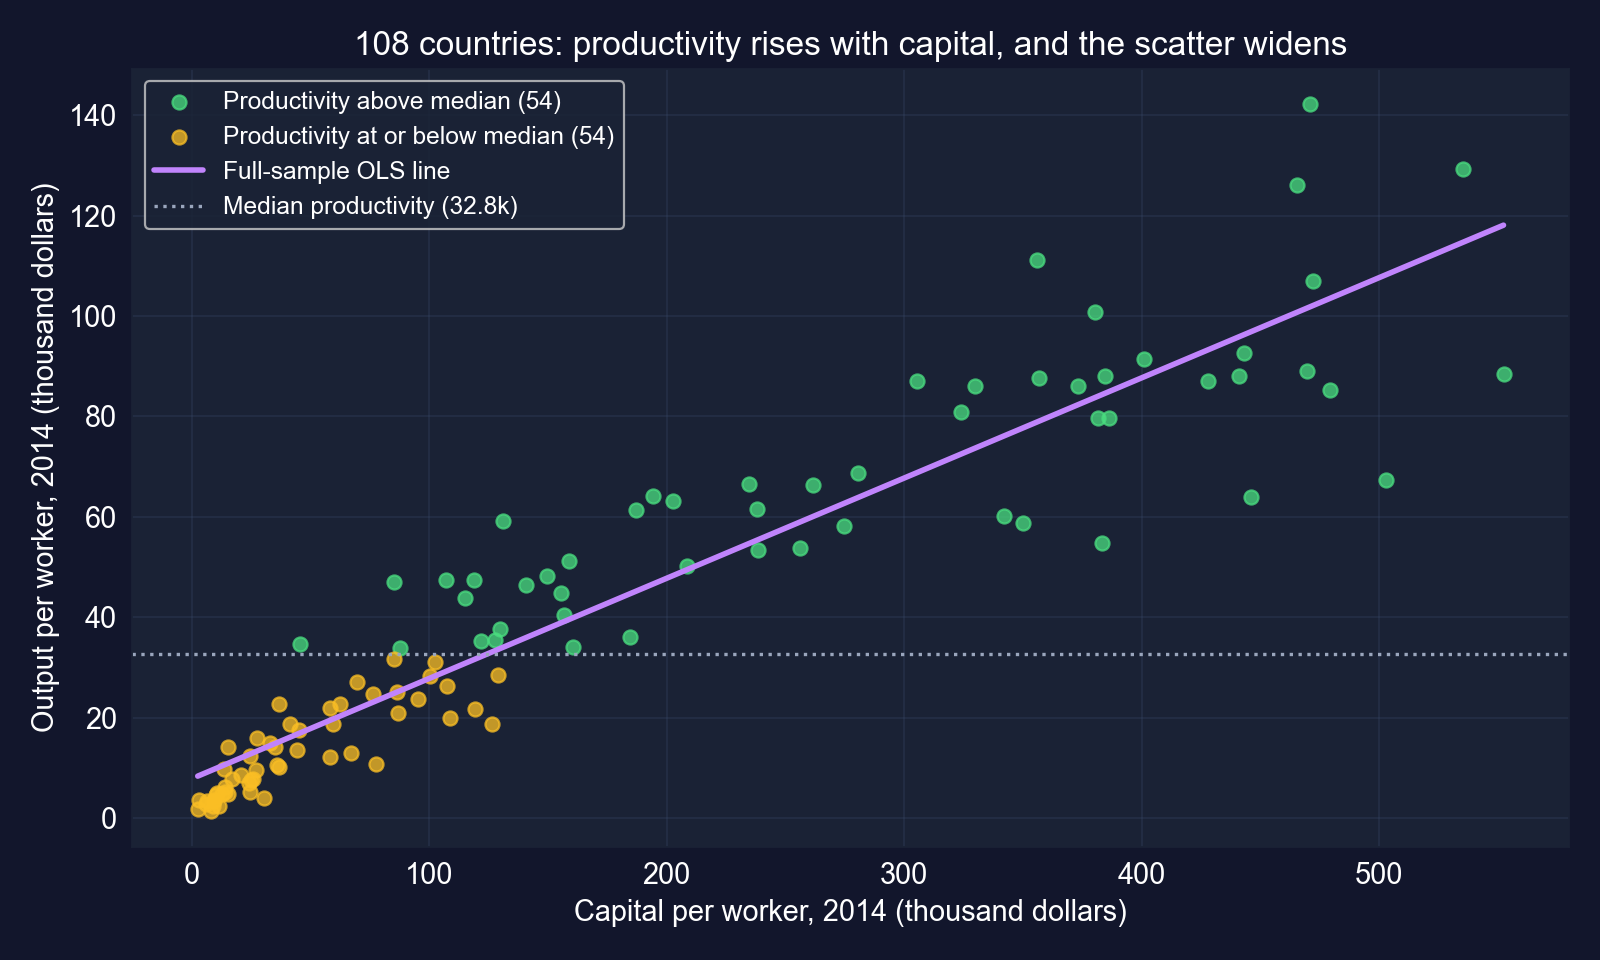
The picture shows everything the tables said: a strong positive slope, a widening scatter (heteroskedasticity) and a split that slices the cloud horizontally, along \(y\).
Task 5 code: the diagnostic plot the chapter leaves open
# continues from the previous block (model_convergence already fitted)
import matplotlib.pyplot as plt              # plotting
import numpy as np                           # array handling
fitted = model_convergence.predict()         # fitted productivity
resid = model_convergence.resid()            # residuals
plt.scatter(fitted, resid, alpha=0.7)        # residuals vs fitted (Task 5c)
plt.axhline(0, color="red", linestyle="--"); plt.xlabel("Fitted"); plt.ylabel("Residual"); plt.show()
low = fitted <= np.median(fitted)            # split by fitted value, not by y
print(np.std(resid[low], ddof=1), np.std(resid[~low], ddof=1)) # residual SD by halfOutput: residual SD $6,822 (lower half of fitted values) vs $15,795 (upper half), the numbers behind the fan shape shown under Task 3.
Task 6: the research summary, with the real numbers
Using a 2014 cross-section of 108 countries, I estimate the association between output per worker and physical capital per worker. Each additional $1,000 of capital per worker is associated with $199 more output per worker (HC1 robust SE = 0.011, \(t = 17.9\), \(p < 0.001\); 95% CI [0.177, 0.222]); capital explains 87% of the cross-country variation. The robust SE is 48% larger than the classical one, and residuals fan out with fitted productivity, so only robust inference is reported. The slope is far below the 0.5 benchmark (\(t = -27.0\)). Splitting the sample by capital per worker, the slope is 0.30 among capital-poor countries and 0.17 among capital-rich ones, consistent with diminishing returns. These are associations: capital moves with technology, human capital and institutions, and a levels regression does not test convergence.
A good summary reports magnitude, robust precision, the tests that matter and the limits of the design, in that order.
Scorecard: Case Study 1
| Question | Answer |
|---|---|
| Is it precise? | robust SE 0.0111; CI [0.177, 0.222] |
| Is it real? | robust \(t = 17.94\): reject \(\beta_2 = 0\) |
| Which values are plausible? | not 0.5 (\(t = -27.0\)); below 0.30 (\(p < 0.001\), one-sided) |
| Does it matter? | one SD of capital ↔︎ $31,576 output per worker (77% of the mean) |
| Is the SE honest? | no with classical SEs: robust SE is 48% larger; residuals fan out |
Same toolkit as the houses, opposite lesson on the fourth row: here the robust SE is not optional.
Case Study 2 · Do nighttime lights track development in Bolivia?
DS4Bolivia · 339 municipalities · Tasks 1–6
The question: is the light–development association real, and how big?
Research question. Across Bolivia’s municipalities, is the association between nighttime lights and development statistically significant, and how precisely can we estimate it?
\[\text{imds}_i = \beta_1 + \beta_2\,\ln(\text{NTL per capita})_i + u_i\]
imds: Municipal Sustainable Development Index, 0–100ln_NTLpc2017: log of nighttime lights per capita, 2017- 339 municipalities in 9 departments; 333 have both variables
Because \(x\) is in logs, \(\beta_2\) is the change in IMDS points when lights per capita are multiplied by \(e \approx 2.72\); doubling lights adds \(\beta_2 \ln 2 \approx 0.69\,\beta_2\) points.
Code: load the DS4Bolivia data
!pip install -q pyfixest                     # pyfixest is not preinstalled in Colab
import pandas as pd, pyfixest as pf          # data and OLS
from scipy import stats                      # t-distribution for manual tests
url_bol = "https://raw.githubusercontent.com/quarcs-lab/ds4bolivia/master/ds4bolivia_v20250523.csv"
bol = pd.read_csv(url_bol)                   # 339 municipalities, 351 columns
bol_key = bol[["mun", "dep", "imds", "ln_NTLpc2017"]].copy()   # keep what we need
reg_data = bol_key[["imds", "ln_NTLpc2017"]].dropna()          # complete cases only
print(f"Total municipalities: {len(bol_key)}")
print(f"Complete cases for regression: {len(reg_data)}")
reg_data.describe().round(3) # summary statisticsOutput: 333 municipalities, a wide spread of development
| Variable | Mean | SD | Min | Max |
|---|---|---|---|---|
imds (0–100) |
51.16 | 6.76 | 35.70 | 80.20 |
ln_NTLpc2017 |
13.88 | 1.18 | 9.06 | 17.06 |
N = 333 complete cases out of 339 municipalities
IMDS spans 44.5 points; log lights span 8 units, which means lights per capita differ by a factor of about 3,000 between the dimmest and the brightest municipality.
Task 1 code: estimate and test the slope
# continues from the previous block (reg_data already built)
model = pf.feols("imds ~ ln_NTLpc2017", data=reg_data)   # classical SEs
model.summary()                                          # full table
t_stat = model.tstat()["ln_NTLpc2017"]                   # t for H0: beta2 = 0
p_value = model.pvalue()["ln_NTLpc2017"]                 # two-sided p-value
print(model.coef()["ln_NTLpc2017"], model.se()["ln_NTLpc2017"], t_stat, p_value)
print("Reject H0" if p_value < 0.05 else "Fail to reject H0")
print(model._r2) # R-squaredTask 1 output: 3.4 IMDS points per log unit of light
| Variable | Coef. | SE | \(t\) | \(p\) |
|---|---|---|---|---|
| Intercept | 4.377 | 3.544 | 1.24 | 0.218 |
ln_NTLpc2017 |
3.370 | 0.254 | 13.25 | < 0.001 |
N = 333 · classical SEs · \(R^2 = 0.347\)
Reject \(H_0: \beta_2 = 0\): \(t = 13.25\).
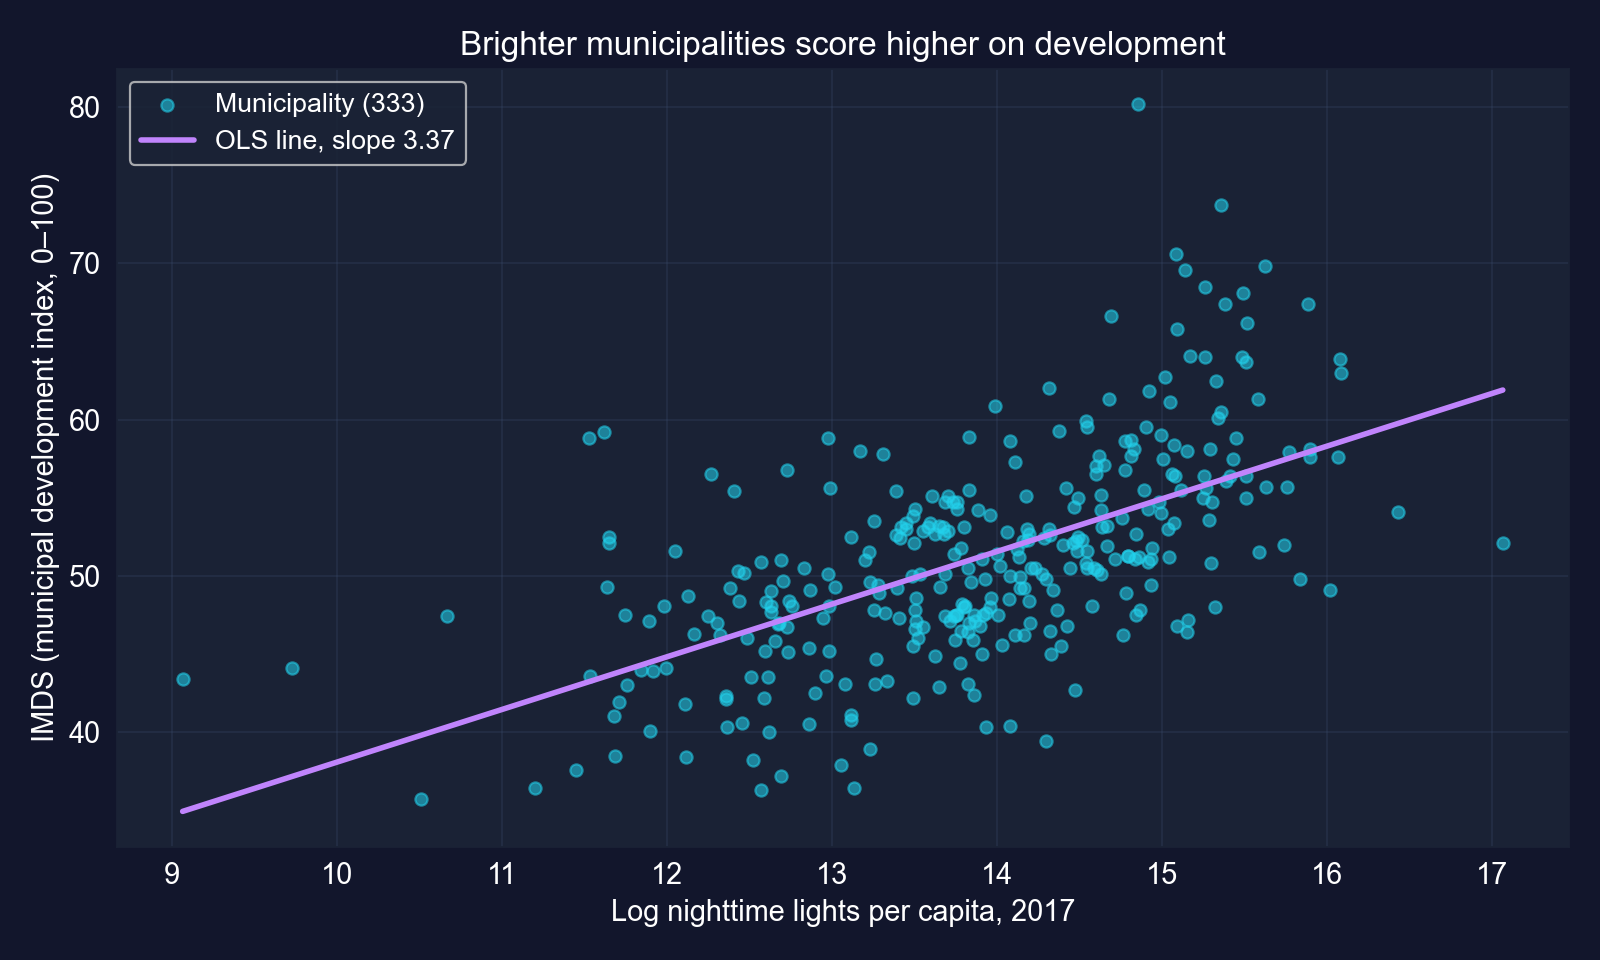
Brighter municipalities are measurably more developed, but lights explain only 35% of the variation in IMDS.
Task 2: a 95% confidence interval for the slope
| Point estimate | 95% CI | Contains 0? |
|---|---|---|
| 3.370 | [2.87, 3.87] | no |
Correct reading: intervals built this way capture the true slope 95% of the time, and this one runs from 2.87 to 3.87 IMDS points per log unit of light. Zero is far outside it.
Task 3 code: robust standard errors
# continues from the previous block
model_robust = pf.feols("imds ~ ln_NTLpc2017", data=reg_data, vcov="HC1")   # HC1 SEs
se_d, se_r = model.se()["ln_NTLpc2017"], model_robust.se()["ln_NTLpc2017"]
print(se_d, se_r, se_r / se_d)                           # SE ratio robust / default
print(model.tstat()["ln_NTLpc2017"], model_robust.tstat()["ln_NTLpc2017"])
print(model_robust.confint().loc["ln_NTLpc2017"])        # robust 95% CI
print(model_robust.se()["Intercept"], model_robust.pvalue()["Intercept"])Task 3 output: the robust SE is 18% larger
| Variable | Coef. | Default SE | Robust SE | Ratio | Robust \(t\) | Robust 95% CI |
|---|---|---|---|---|---|---|
| Intercept | 4.377 | 3.544 | 4.135 | 1.167 | 1.06 | [−3.76, 12.51] |
ln_NTLpc2017 |
3.370 | 0.254 | 0.299 | 1.175 | 11.27 | [2.78, 3.96] |
N = 333 · HC1 SEs · robust \(p < 0.001\) for the slope, 0.291 for the intercept
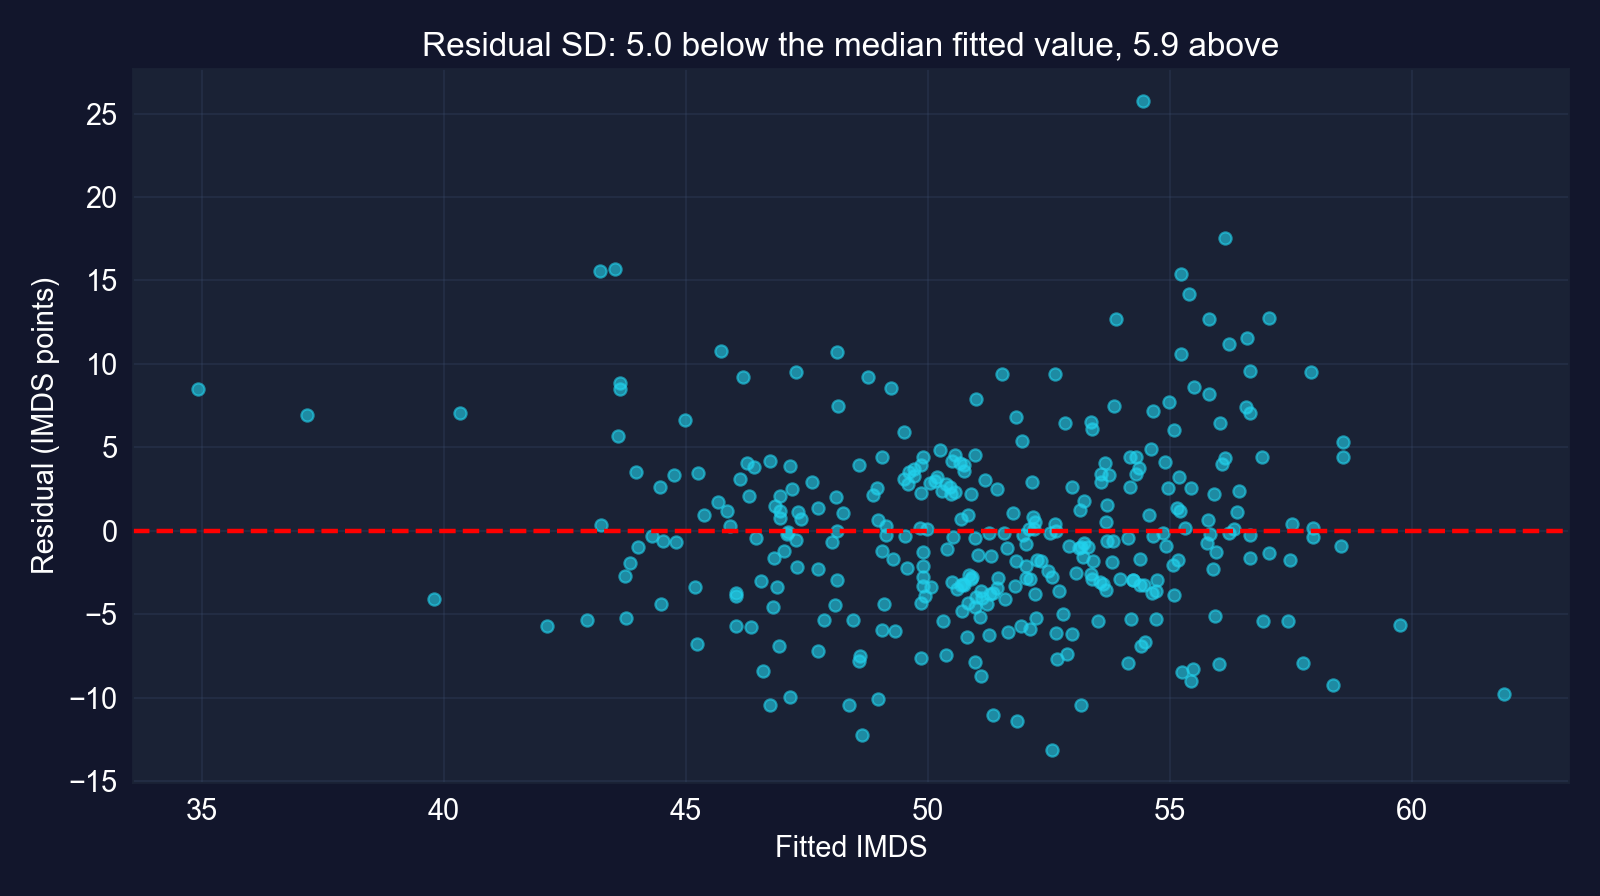
Moderate heteroskedasticity: the slope’s SE rises 17.5% and \(t\) falls from 13.25 to 11.27. Every conclusion survives; use the robust numbers from here on.
Task 4: is the slope exactly 5?
# continues from the previous block (model_robust already fitted)
beta_hat = model_robust.coef()["ln_NTLpc2017"]           # 3.370
se_robust = model_robust.se()["ln_NTLpc2017"]            # robust SE
df = int(model_robust._N) - len(model_robust.coef())     # 333 - 2 = 331
t_manual = (beta_hat - 5) / se_robust                    # H0: beta2 = 5
p_two_sided = 2 * stats.t.sf(abs(t_manual), df=df)       # two-sided p-value
print(t_manual, df, p_two_sided)| \(H_0\) | \(t\) | df | \(p\) | Decision |
|---|---|---|---|---|
| \(\beta_2 = 5\) | −5.45 | 331 | \(9.8\times 10^{-8}\) | reject |
A slope of 5 is ruled out: it lies well above the robust interval [2.78, 3.96]. The test and the interval tell the same story.
Task 5: is the association positive?
| \(H_0\) | \(H_a\) | Robust \(t\) | One-sided \(p\) | Decision |
|---|---|---|---|---|
| \(\beta_2 \le 0\) | \(\beta_2 > 0\) | 11.27 | \(1.8\times 10^{-25}\) | reject |
Overwhelming evidence of a positive association. A one-sided test is legitimate here because the direction was stated before estimation, and the estimate points that way.
Task 6 code: put the magnitude in context
# continues from the previous block
imds_range = reg_data["imds"].max() - reg_data["imds"].min()   # 44.5 points
imds_std = reg_data["imds"].std()                               # 6.76 points
beta = model_robust.coef()["ln_NTLpc2017"]                      # 3.370
print(beta, 100 * beta / imds_range, 100 * beta / imds_std)     # per log unit
print(beta * 0.693, 100 * beta * 0.693 / imds_range)            # doubling lights
ci_r = model_robust.confint().loc["ln_NTLpc2017"]               # robust CI
print(ci_r.iloc[0] * 0.693, ci_r.iloc[1] * 0.693)               # CI for doubling
sd_x = reg_data["ln_NTLpc2017"].std()                           # 1.18 log units
print(beta * sd_x, beta * sd_x / imds_std, model._r2) # one-SD contrast, R²Task 6 output: significant beyond doubt, modest in size
| Comparison | IMDS change | Relative to |
|---|---|---|
| +1 log unit of lights (×2.72) | 3.37 | 7.6% of the IMDS range; 50% of its SD |
| Doubling lights (+0.693) | 2.34 | 5.2% of the range · robust CI [1.93, 2.74] |
| +1 SD of log lights (1.18) | 3.98 | 0.59 SD of IMDS |
Range = 44.5 points, SD = 6.76 · CI for doubling and one-SD row computed for these slides · \(R^2 = 0.347\)
- Significant at 1%, 5% and 10%: robust \(p < 0.001\)
- Practically: doubling a municipality’s lights goes with about 2.3 more IMDS points, a modest step on a 0–100 scale
- Not causal: urbanization, electrification, roads and market access drive both lights and development
Statistical significance here is beyond doubt; economic significance is moderate; causality is not established. Three different questions, three different answers.
Scorecard: Case Study 2
| Question | Answer |
|---|---|
| Is it precise? | robust SE 0.299; CI [2.78, 3.96] |
| Is it real? | robust \(t = 11.27\): reject \(\beta_2 = 0\); positive one-sided, \(p < 0.001\) |
| Which values are plausible? | not 5 (\(t = -5.45\)) |
| Does it matter? | doubling lights ↔︎ +2.3 IMDS points (5.2% of the range): moderate |
| Is the SE honest? | robust SE 17.5% larger: report it; department-level correlation not yet addressed |
Same five rows, a third pattern: precise and real, but modest, and the SE still has a caveat (spatial correlation) that HC1 cannot fix.
Reading it right
Act III · Synthesis
Three datasets, one toolkit
| Houses (7.1–7.7) | Countries (Case 1) | Municipalities (Case 2) | |
|---|---|---|---|
| N | 29 | 108 | 333 |
| Slope \(b_2\) | 73.771 | 0.1995 | 3.370 |
| Classical SE | 11.175 | 0.0075 | 0.254 |
| Robust (HC1) SE | 11.330 | 0.0111 | 0.299 |
| Robust / classical | 1.014 | 1.484 | 1.175 |
| Robust \(t\) | 6.51 | 17.94 | 11.27 |
| Robust 95% CI | [50.52, 97.02] | [0.1774, 0.2215] | [2.78, 3.96] |
| \(R^2\) | 0.617 | 0.870 | 0.347 |
Every slope is highly significant, yet the SE correction ranges from 1% to 48%. Whether heteroskedasticity matters is an empirical question, so the robust SE should be the default.
Seven misreadings to avoid
- “95% chance \(\beta_2\) is in the interval”: no, 95% of intervals cover \(\beta_2\)
- “\(p < 0.001\), so the effect is large”: \(p\) measures evidence against \(H_0\), not size
- “We fail to reject, so \(\beta_2 = 90\)”: the data are also consistent with 60 and 95
- “Halve the \(p\)-value for any one-sided test”: only when the estimate points toward \(H_a\)
- “Robust SEs only when a test finds heteroskedasticity”: use them by default
- “Split the sample by the outcome to compare slopes”: that truncates \(y\) and biases both slopes
- “Significant, so causal”: every slope in this deck is an association
Each one is a real trap, and each has a slide in this deck that shows the correct reading with the chapter’s own numbers.
The tempting shortcut, and the correction
Objection. “\(t = 17.9\), \(p < 0.001\), \(R^2 = 0.87\): capital clearly drives productivity, and we know the effect to the third decimal.”
Response. The classical SE overstated precision by 48%, the residuals fan out and curve, the sample split biased the group slopes, and nothing in a cross-section of levels identifies a causal effect. Significance tells you the association is not noise. It does not tell you how big it is, how precise it truly is, or why it exists.
Read every regression table with four questions: how big, how precise (with an honest SE), how plausible are the alternatives, and what would make it causal.
What to carry forward
- \(t = (b_2 - \beta_2^{*})/\operatorname{se}(b_2) \sim T(n-2)\): every test is “estimate minus claim, in SE units”
- A 95% CI is \(b_2 \pm t_{n-2,\,0.025}\,\operatorname{se}(b_2)\) and contains every value a two-sided 5% test does not reject
- \(\operatorname{se}(b_2)\) shrinks with a tighter fit, more data (\(1/\sqrt n\)) and more spread in \(x\)
- One-sided tests: the claim goes in \(H_a\), the direction is fixed in advance, halving needs the right sign
- Cross-sections:
vcov="HC1"by default; look at the residuals; a large gap signals a model problem - Always report magnitude and precision; significance is not importance, and association is not causation