One tool, four worlds
Act I · The tension
The same line answers wildly different questions
A health economist, a portfolio manager and a macroeconomist seem to work in separate worlds. Yet each reaches for the same instrument:
\[y_i = \beta_1 + \beta_2\, x_i + u_i\]
The hard part is not running the regression. It is reading the slope honestly: in the right units, with the right standard errors, against the right hypothesis, and with an eye on the few observations that can drive it.
One estimator, four case files. In each, we ask what the slope means, how sure we are, and what could make it misleading.
Four case files — click any case to jump to it
| Case | Question | Data | Headline result |
|---|---|---|---|
| 8.1 | Does health spending buy longer lives? | 34 OECD countries, 2009 | +1.11 years per $1,000; infant-mortality slope loses significance with robust SEs |
| 8.2 | How does health spending rise with income? | 34 OECD countries, 2009 | +$90 per $1,000 of GDP; \(R^2\) 0.60 → 0.93 without USA and Luxembourg |
| 8.3 | How risky is Coca-Cola stock? | 354 months, 1983–2012 | \(\beta = 0.61\), significantly below 1 |
| 8.4 | Does Okun’s Law hold for the U.S.? | 59 years, 1961–2019 | slope −1.59; the −2 benchmark is rejected at 5% |
Three kinds of data, one estimator
| Cross-section | Financial time series | Macro time series | |
|---|---|---|---|
| Cases | 8.1, 8.2 | 8.3 | 8.4 |
| Unit of observation | a country in 2009 | a month | a year |
| N | 34 (32 without USA, LUX) | 354 | 59 |
| Outcome \(y\) | life expectancy, infant mortality, health spending | Coca-Cola excess return | real GDP growth |
| Regressor \(x\) | health spending, GDP per capita | market excess return | change in unemployment rate |
| Typical worry | heteroskedasticity, influential countries | fat tails, time-varying risk | autocorrelation, structural breaks |
| SEs in the chapter | classical and HC1 | classical and HC1 | classical and HC1 |
The estimator never changes (pf.feols). What changes is what can go wrong, so the checks we run must change with the data.
Method review: the bivariate regression toolkit
Estimate
- Slope: \(\hat\beta_2 = \dfrac{\sum (x_i-\bar x)(y_i-\bar y)}{\sum (x_i-\bar x)^2}\)
- Intercept: \(\hat\beta_1 = \bar y - \hat\beta_2\,\bar x\)
- Fit: \(R^2 = r_{xy}^2\), the share of the variance of \(y\) explained by \(x\)
Infer
- Test \(H_0\!: \beta_2 = \beta_2^*\) with \(t = \dfrac{\hat\beta_2 - \beta_2^*}{\text{se}(\hat\beta_2)} \sim t(n-2)\)
- 95% CI: \(\hat\beta_2 \pm t_{0.025,\,n-2}\times \text{se}(\hat\beta_2)\)
- \(\beta_2^* = 0\) is only the default: Okun’s \(-2\) and the CAPM’s \(\beta = 1\) are more interesting nulls
Every result in this deck is one of these formulas applied to real data. The only moving part is which standard error goes into the denominator.
Method review: classical vs robust standard errors
\[\text{Classical: } \widehat{\text{Var}}(\hat\beta_2) = \frac{s^2}{\sum (x_i-\bar x)^2} \qquad \text{HC1: } \widehat{\text{Var}}(\hat\beta_2) = \frac{n}{n-2}\,\frac{\sum (x_i-\bar x)^2\,\hat u_i^2}{\left[\sum (x_i-\bar x)^2\right]^2}\]
- Classical SEs assume every error has the same variance \(\sigma^2\) (homoskedasticity)
- HC1 lets each observation carry its own \(\hat u_i^2\), weighted by how far its \(x_i\) sits from \(\bar x\)
- So HC1 is larger when big residuals sit at extreme values of \(x\), and can be smaller when they sit near the middle
- The coefficient is identical; only the SE, \(t\), \(p\) and CI change
In pyfixest this is one argument: vcov="HC1". We will report both in every case and watch where they disagree.
The recurring thread: read every slope in its units
| Case | \(y\) measured in… | \(x\) measured in… | So one unit of \(x\) is… |
|---|---|---|---|
| 8.1 | years; deaths per 1,000 births | US dollars per person | $1 — tiny, so rescale to $1,000 |
| 8.2 | US dollars per person | US dollars per person | $1 of GDP → cents of health spending |
| 8.3 | monthly excess return (decimal) | monthly excess return (decimal) | the same units, so \(\beta\) is unit-free |
| 8.4 | % growth of real GDP | percentage-point change in unemployment | 1 percentage point |
A slope of 0.0011 can be large and a slope of 0.61 can be small. Translate before you judge.
Five ideas anchor this chapter
- Economic vs statistical significance: a slope can be precise yet small, or large yet noisy; report both
- Robust standard errors (HC1): valid inference when error variance differs across observations
- Influential observations: two of 34 countries can move a slope by 41% and \(R^2\) from 0.60 to 0.93
- Systematic risk (\(\beta\)): how much an asset moves with the market; \(R^2\) splits risk into systematic and idiosyncratic
- Structural breaks: a relationship estimated over 59 years can drift; plotting actual vs predicted over time reveals it
Each idea is the lesson of one case. Act III puts them side by side.
Act II · Four case files
Cross-section · finance · macro
Case 8.1 · Does health spending buy longer lives?
Cross-section · 34 OECD countries · classical vs HC1 standard errors
The question: do countries that spend more on health live longer?
Data. 34 OECD countries in 2009 (AED_HEALTH2009.DTA), one row per country.
| Variable | Meaning | Units |
|---|---|---|
hlthpc |
health expenditure per capita | US dollars |
lifeexp |
male life expectancy at birth | years |
infmort |
infant mortality | deaths per 1,000 live births |
gdppc |
GDP per capita (used in 8.2) | US dollars |
code |
three-letter country code | e.g. USA, LUX |
\[\text{lifeexp}_i = \beta_1 + \beta_2\,\text{hlthpc}_i + u_i \qquad \text{infmort}_i = \beta_1 + \beta_2\,\text{hlthpc}_i + u_i\]
We expect \(\beta_2 > 0\) for life expectancy and \(\beta_2 < 0\) for infant mortality. Spending is chosen by countries, not assigned, so expect associations.
The data: spending varies almost ninefold across the OECD
| Variable | Mean | Std. dev. | Min | Max |
|---|---|---|---|---|
hlthpc (US$) |
3,255.6 | 1,493.7 | 923 (Mexico) | 7,990 (USA) |
lifeexp (years) |
76.70 | 2.94 | 69.8 (Estonia) | 79.9 (Switzerland) |
infmort (per 1,000) |
4.45 | 2.72 | 1.8 (Iceland) | 14.7 (Mexico) |
N = 34 · OECD, 2009 · Table 8.1 of the chapter
The USA spends $2,642 more per person than the next-highest country, Norway. That alone makes it a candidate for an influential observation.
Code: load the data and summarize it
!pip install -q pyfixest                      # pyfixest is not preinstalled in Colab
import pandas as pd                           # tabular data
import pyfixest as pf                         # OLS with R-style formulas and robust SEs
url = "https://raw.githubusercontent.com/quarcs-lab/data-open/master/AED/AED_HEALTH2009.DTA"
data_health = pd.read_stata(url)              # 34 OECD countries in 2009, one row each
table81 = data_health[["hlthpc", "lifeexp", "infmort"]].describe().T   # one row per variable
table81["range"] = table81["max"] - table81["min"]                      # max minus min
print(table81[["mean", "std", "min", "max", "range"]].round(2)) # Table 8.1Code: life expectancy on health spending, two kinds of SEs
# continues from the previous block
model_lifeexp = pf.feols("lifeexp ~ hlthpc", data=data_health)                     # classical SEs
model_lifeexp_robust = pf.feols("lifeexp ~ hlthpc", data=data_health, vcov="HC1")  # robust SEs
model_lifeexp.summary()                           # coefficients with classical (iid) SEs
model_lifeexp_robust.summary()                    # same coefficients, HC1 SEs, t, p, CI
slope_life = model_lifeexp.coef()["hlthpc"]       # years of life per extra US dollar
print(f"per $1,000: {slope_life*1000:.2f} years; R2 = {model_lifeexp._r2:.3f}")Fitting twice costs nothing: vcov changes the standard errors, never the line.
Output: +1.11 years per $1,000, but the robust SE is 1.6× larger
| Variable | Coef. | SE (iid) | \(t\) | \(p\) | SE (HC1) | \(t\) | \(p\) |
|---|---|---|---|---|---|---|---|
Intercept |
73.084 | 1.024 | 71.36 | < 0.001 | 1.565 | 46.70 | < 0.001 |
hlthpc |
0.001112 | 0.000287 | 3.88 | < 0.001 | 0.000464 | 2.40 | 0.023 |
N = 34 · \(R^2 = 0.320\) · 95% CI for the slope: [0.000528, 0.001696] (iid), [0.000167, 0.002056] (HC1)
- Units: 0.001112 years per dollar = 1.11 years per $1,000 of spending per person
- Robust 95% CI per $1,000: from 0.17 to 2.06 years, positive but wide
- Intercept 73.1: predicted life expectancy at zero spending, far below the lowest observed spending ($923), so it has no meaning on its own
Significant either way (\(p\) = 0.023 with HC1), but the robust interval is 1.6× wider. Health spending explains 32% of the cross-country variation.
Reading the slope: does the line predict real gaps?
- Chile spends $1,210 per person; Norway spends $5,348, a gap of $4,138
- The slope predicts a life-expectancy gap of \(4.138 \times 1.11 \approx\) 4.6 years
- The actual gap is 78.7 − 75.8 = 2.9 years
- The line is an average relationship across 34 countries; any one pair can be far from it
A slope summarizes the cloud, not every pair inside it. A typical prediction error is about 2.4 years (the RMSE in the output).
The USA lives 6 years shorter than its spending predicts
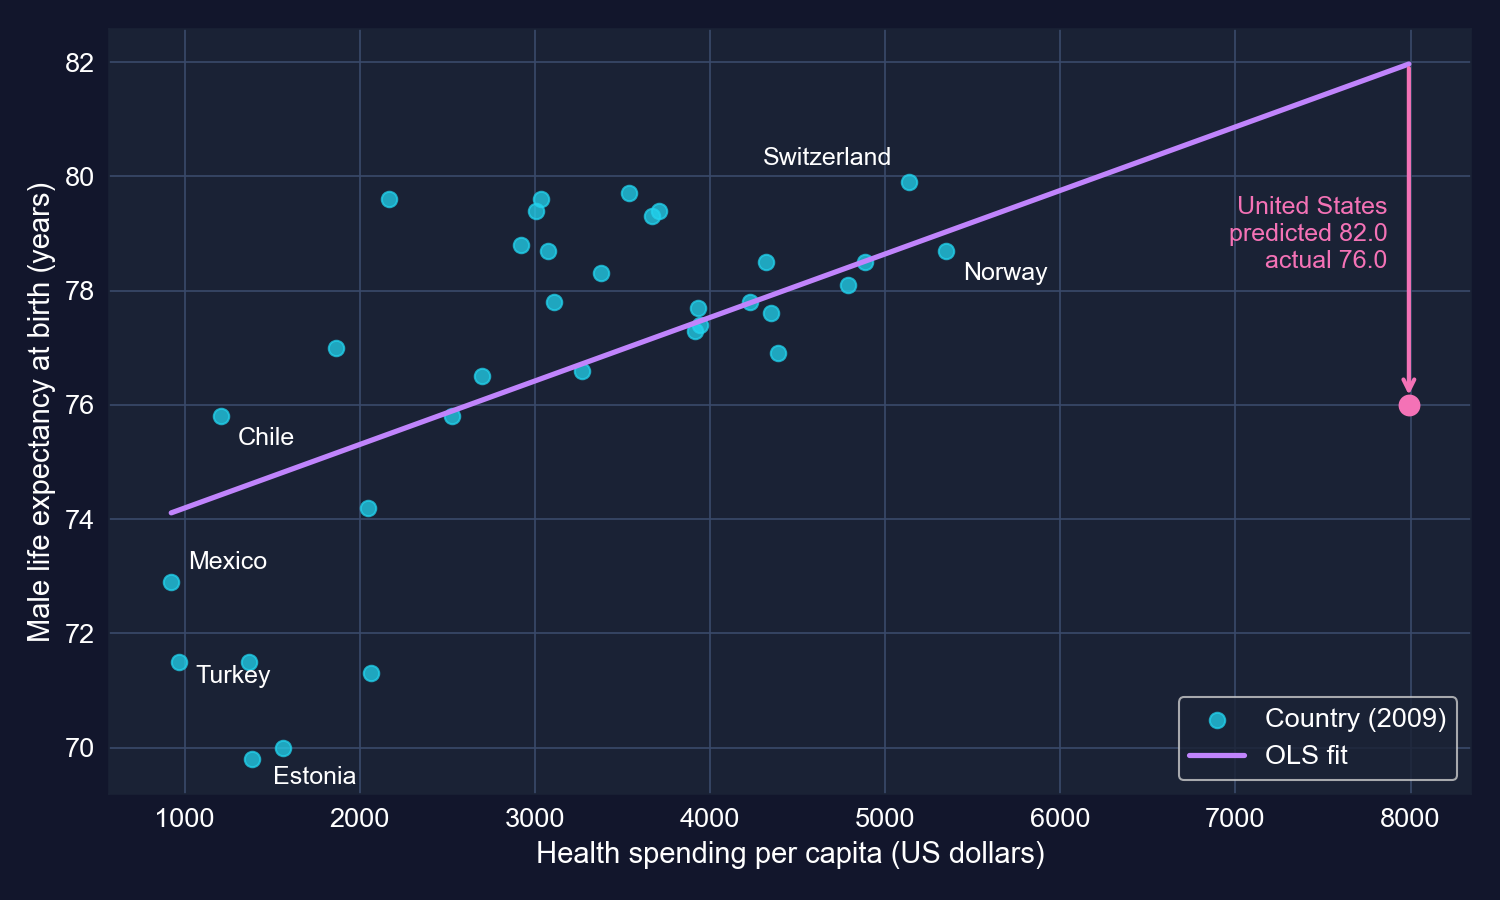
Male life expectancy against health spending, with the OLS line. The USA sits far below the line at the far right.
At $7,990 the line predicts 82.0 years; the USA records 76.0. Its residual of −6.0 years is the largest of all 34 countries.
Why the robust SE is larger: big residuals at extreme spending
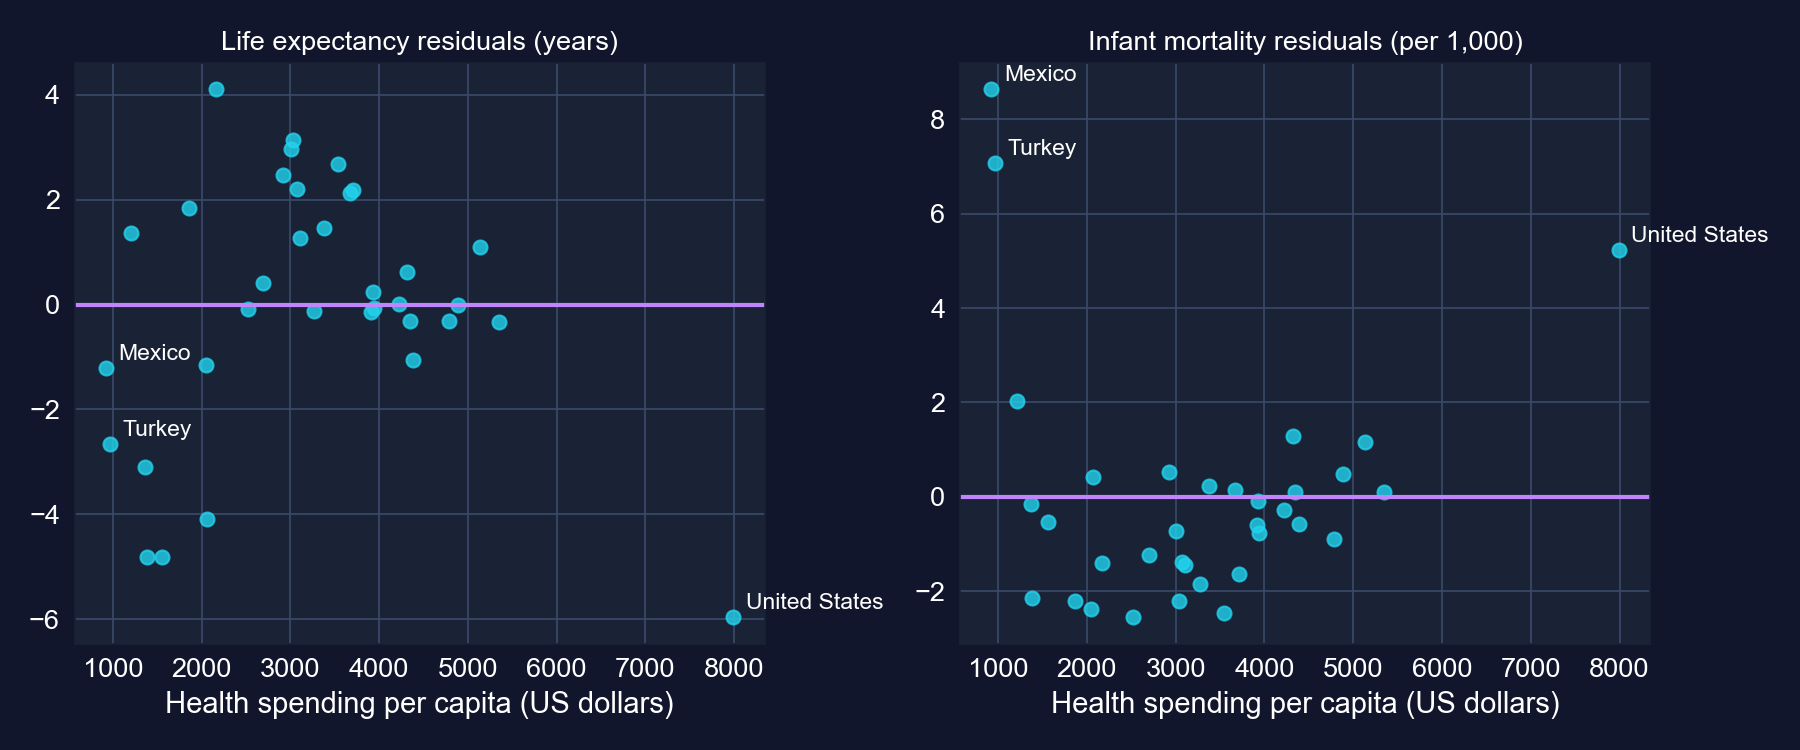
HC1 weights each squared residual by \((x_i-\bar x)^2\). The USA is both the most extreme spender and the worst-fitting country, so it inflates the robust SE.
Code: infant mortality on health spending
# continues from the previous block
model_infmort = pf.feols("infmort ~ hlthpc", data=data_health)                     # classical SEs
model_infmort_robust = pf.feols("infmort ~ hlthpc", data=data_health, vcov="HC1")  # robust SEs
model_infmort.summary()                           # slope, classical SE, t, p
model_infmort_robust.summary()                    # same slope, HC1 SE, t, p
slope_inf = model_infmort.coef()["hlthpc"]        # infant deaths per 1,000 births per extra dollar
print(f"per $1,000: {slope_inf*1000:.2f}; from $2,000 to $4,000: {slope_inf*2000:.2f}")Output: the verdict flips with robust standard errors
| Variable | Coef. | SE (iid) | \(t\) | \(p\) | SE (HC1) | \(t\) | \(p\) |
|---|---|---|---|---|---|---|---|
Intercept |
6.702 | 1.064 | 6.30 | < 0.001 | 1.877 | 3.57 | 0.001 |
hlthpc |
−0.000693 | 0.000298 | −2.33 | 0.027 | 0.000515 | −1.35 | 0.188 |
N = 34 · \(R^2 = 0.145\) · 95% CI for the slope: [−0.001299, −0.000086] (iid), [−0.001741, 0.000356] (HC1)
- Units: −0.69 infant deaths per 1,000 births for every extra $1,000 per person
- Classical SEs: significant at 5% (\(t = -2.33\))
- HC1: the SE is 1.7× larger, \(t = -1.35\), \(p = 0.19\), and the CI includes zero
Same slope, opposite verdicts. With robust SEs, the data cannot rule out a zero association.
The USA again: 6.4 infant deaths where the line predicts 1.2
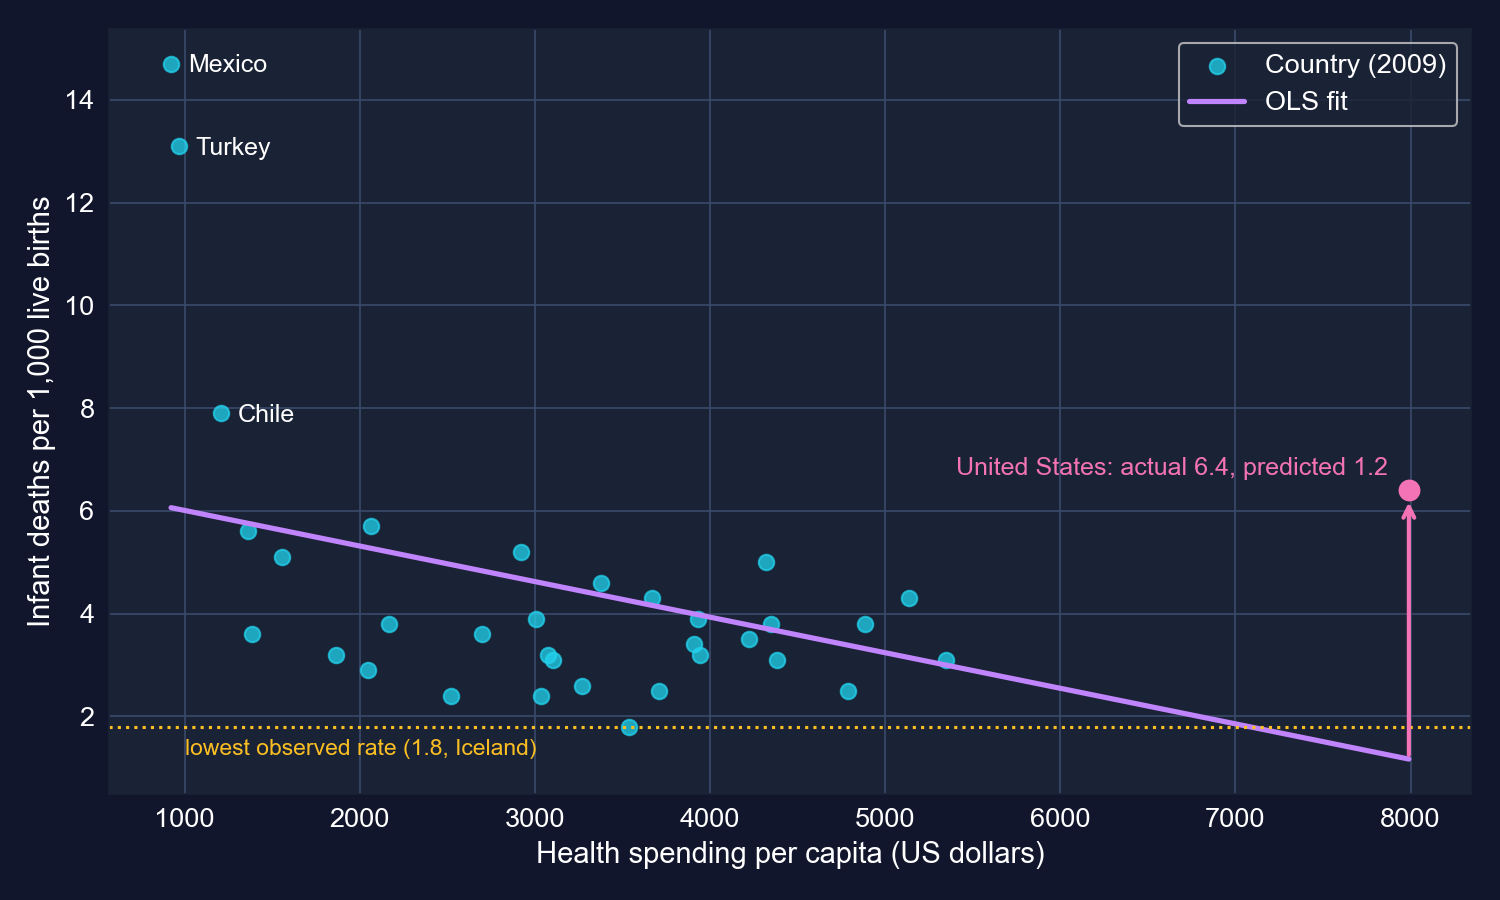
Infant mortality against health spending. The line’s prediction for the USA falls below the lowest rate observed anywhere in the sample.
The prediction for the USA (1.2) is lower than any country actually achieves (Iceland, 1.8). A straight line extrapolated to $7,990 promises the impossible.
Interpreting the infant-mortality slope: magnitude vs evidence
- Economic magnitude (the chapter’s example): going from $2,000 to $4,000 per person predicts 1.39 fewer deaths per 1,000 births, i.e. about 139 fewer infant deaths a year in a country with 100,000 births
- Statistical evidence: with robust SEs we cannot distinguish that slope from zero (\(p = 0.19\))
- Fit: spending explains only 14.5% of the variation; Mexico and Turkey’s high rates dominate the cloud
Economically large if true, statistically weak in this sample. Report both, and do not let a big number stand in for evidence.
Robustness check: the same regressions without the USA
| Outcome | Sample | Slope per $1,000 | HC1 \(t\) | \(p\) | \(R^2\) |
|---|---|---|---|---|---|
| Life expectancy | all 34 | 1.11 | 2.40 | 0.023 | 0.320 |
| Life expectancy | without USA (33) | 1.69 | 5.60 | < 0.001 | 0.507 |
| Infant mortality | all 34 | −0.69 | −1.35 | 0.188 | 0.145 |
| Infant mortality | without USA (33) | −1.20 | −2.46 | 0.019 | 0.302 |
Not in the chapter: the same pf.feols model with vcov="HC1" on 33 countries, mirroring the chapter’s own outlier check in 8.2.
One country flattens both slopes and hides the infant-mortality association. Dropping it is not automatically right, but you must know it matters.
Code: the USA prediction and the drop-one check
# continues from the previous block
resid = data_health["lifeexp"] - model_lifeexp.predict()       # actual minus fitted, by country
print(data_health.assign(resid=resid)
      .nsmallest(3, "resid")[["code", "lifeexp", "resid"]])     # USA has the largest shortfall
us = data_health[data_health["code"] == "USA"]                   # the United States row
print(model_lifeexp.predict(newdata=us),                         # life expectancy at $7,990
      model_infmort.predict(newdata=us))                         # infant mortality at $7,990
no_us = data_health[data_health["code"] != "USA"]                # not in the chapter: 33 countries
for y in ["lifeexp", "infmort"]:                                 # same model for both outcomes
    fit = pf.feols(f"{y} ~ hlthpc", data=no_us, vcov="HC1")      # robust SEs, as before
    print(y, round(fit.coef()["hlthpc"] * 1000, 2),              # slope per $1,000
round(fit.tstat()["hlthpc"], 2), round(fit._r2, 3)) # robust t and R²Why 8.1 is an association, not the effect of spending
What the regression captures
- how life expectancy and infant mortality line up with spending across 34 countries in one year
What it cannot separate
- income: rich countries spend more and have better nutrition, housing and education
- how money is spent: prices, insurance coverage, administrative costs
- lifestyle, inequality, environment, reverse causation (sicker populations may spend more)
1.11 years per $1,000 is a cross-country association. It is not what a country would gain by raising its health budget by $1,000.
Case 8.2 · How does health spending rise with income?
Cross-section · income elasticity · influential observations
The question: is health care a necessity, a luxury, or in between?
\[\text{hlthpc}_i = \beta_1 + \beta_2\,\text{gdppc}_i + u_i\]
| Variable | Mean | Std. dev. | Min | Max |
|---|---|---|---|---|
gdppc (US$) |
33,054.0 | 12,916.8 | 13,806 (Mexico) | 82,901 (Luxembourg) |
hlthpc (US$) |
3,255.6 | 1,493.7 | 923 (Mexico) | 7,990 (USA) |
N = 34 · OECD, 2009 · Table 8.2 of the chapter
Both variables are in dollars per person, so the slope is a marginal propensity: how many cents of health spending go with one more dollar of GDP.
Code: health spending on GDP, classical and robust SEs
!pip install -q pyfixest                      # pyfixest is not preinstalled in Colab
import pandas as pd                           # tabular data
import pyfixest as pf                         # OLS with robust SEs
url = "https://raw.githubusercontent.com/quarcs-lab/data-open/master/AED/AED_HEALTH2009.DTA"
data_health = pd.read_stata(url)              # 34 OECD countries in 2009
print(data_health[["gdppc", "hlthpc"]].describe().T.round(1))   # Table 8.2
model_hlthpc = pf.feols("hlthpc ~ gdppc", data=data_health)                     # classical SEs
model_hlthpc_robust = pf.feols("hlthpc ~ gdppc", data=data_health, vcov="HC1")  # robust SEs
model_hlthpc_robust.summary()                 # same slope, HC1 inference
slope = model_hlthpc.coef()["gdppc"]          # dollars of health spending per dollar of GDP
x_bar, y_bar = data_health["gdppc"].mean(), data_health["hlthpc"].mean()   # sample means
print("elasticity at the means:", slope * x_bar / y_bar) # slope × x̄ / ȳOutput: $90 per $1,000 of GDP, with a robust SE 2.3× larger
| Variable | Coef. | SE (iid) | \(t\) | \(p\) | SE (HC1) | \(t\) | \(p\) |
|---|---|---|---|---|---|---|---|
Intercept |
284.9 | 455.6 | 0.63 | 0.536 | 862.4 | 0.33 | 0.743 |
gdppc |
0.0899 | 0.0129 | 6.99 | < 0.001 | 0.0292 | 3.08 | 0.004 |
N = 34 · \(R^2 = 0.604\) · 95% CI for the slope: [0.0637, 0.1161] (iid), [0.0304, 0.1494] (HC1)
- Units: each extra $1,000 of GDP per person goes with $90 more health spending per person, about 9 cents per dollar
- Robust inference: \(t\) falls from 6.99 to 3.08, still significant (\(p = 0.004\)), but the robust CI runs from $30 to $149 per $1,000
- Fit: GDP per capita accounts for 60% of the cross-country variation in health spending
The positive slope survives robust SEs, but the classical output overstates the precision by more than half.
Method review: from a dollar slope to an income elasticity
\[\eta = \frac{\partial\, \text{hlthpc}}{\partial\, \text{gdppc}}\cdot\frac{\overline{\text{gdppc}}}{\overline{\text{hlthpc}}} = 0.0899 \times \frac{33{,}054}{3{,}256} \approx 0.91\]
- At the sample means, a 1% higher GDP per capita goes with about 0.91% higher health spending
- Normal good means \(\eta > 0\): spending rises with income. Any positive slope already says that
- Necessity (\(0 < \eta < 1\)) vs luxury (\(\eta > 1\)): spending rises less, or more, than proportionally
- In a linear model the elasticity changes along the line; at the means is one point of evaluation
\(\eta \approx 0.91\) says health spending rises roughly in proportion to income in this sample, close to the border between necessity and luxury.
Code: drop the USA and Luxembourg, then each one alone
# continues from the previous block
data_health_subset = data_health[(data_health["code"] != "LUX") &
                                 (data_health["code"] != "USA")]    # 32 countries
model_hlthpc_subset = pf.feols("hlthpc ~ gdppc", data=data_health_subset)        # classical SEs
model_hlthpc_subset_robust = pf.feols("hlthpc ~ gdppc", data=data_health_subset,
                                      vcov="HC1")                     # robust SEs
model_hlthpc_subset_robust.summary()                                  # slope, HC1 SE, R²
sub = data_health_subset                                              # shorter name
b_sub = model_hlthpc_subset.coef()["gdppc"]                           # subset slope
print("elasticity:", b_sub * sub["gdppc"].mean() / sub["hlthpc"].mean())   # at subset means
for code in ["USA", "LUX"]:                                           # not in chapter: drop one
    fit = pf.feols("hlthpc ~ gdppc", data=data_health[data_health["code"] != code], vcov="HC1")
    print("without", code, round(fit.coef()["gdppc"], 4),
round(fit.tstat()["gdppc"], 2), round(fit._r2, 3)) # slope, robust t, R²Output: without two countries the slope rises 41% and \(R^2\) reaches 0.93
| Variable | Coef. | SE (iid) | \(t\) | \(p\) | SE (HC1) | \(t\) | \(p\) |
|---|---|---|---|---|---|---|---|
Intercept |
−883.3 | 208.9 | −4.23 | < 0.001 | 213.4 | −4.14 | < 0.001 |
gdppc |
0.1267 | 0.0064 | 19.69 | < 0.001 | 0.0076 | 16.65 | < 0.001 |
N = 32 (USA and Luxembourg excluded) · \(R^2 = 0.928\) · 95% CI for the slope: [0.1136, 0.1399] (iid), [0.1112, 0.1423] (HC1)
- Slope: $90 → $127 per $1,000 of GDP (+41%)
- \(R^2\): 0.604 → 0.928; the robust SE is now only 1.2× the classical SE
- Elasticity at the subset means: \(0.1267 \times 31{,}117 / 3{,}060 \approx\) 1.29
Remove two countries and the slope, the fit, the SE gap and the economic story (necessity → luxury) all change.
Two lines, two stories
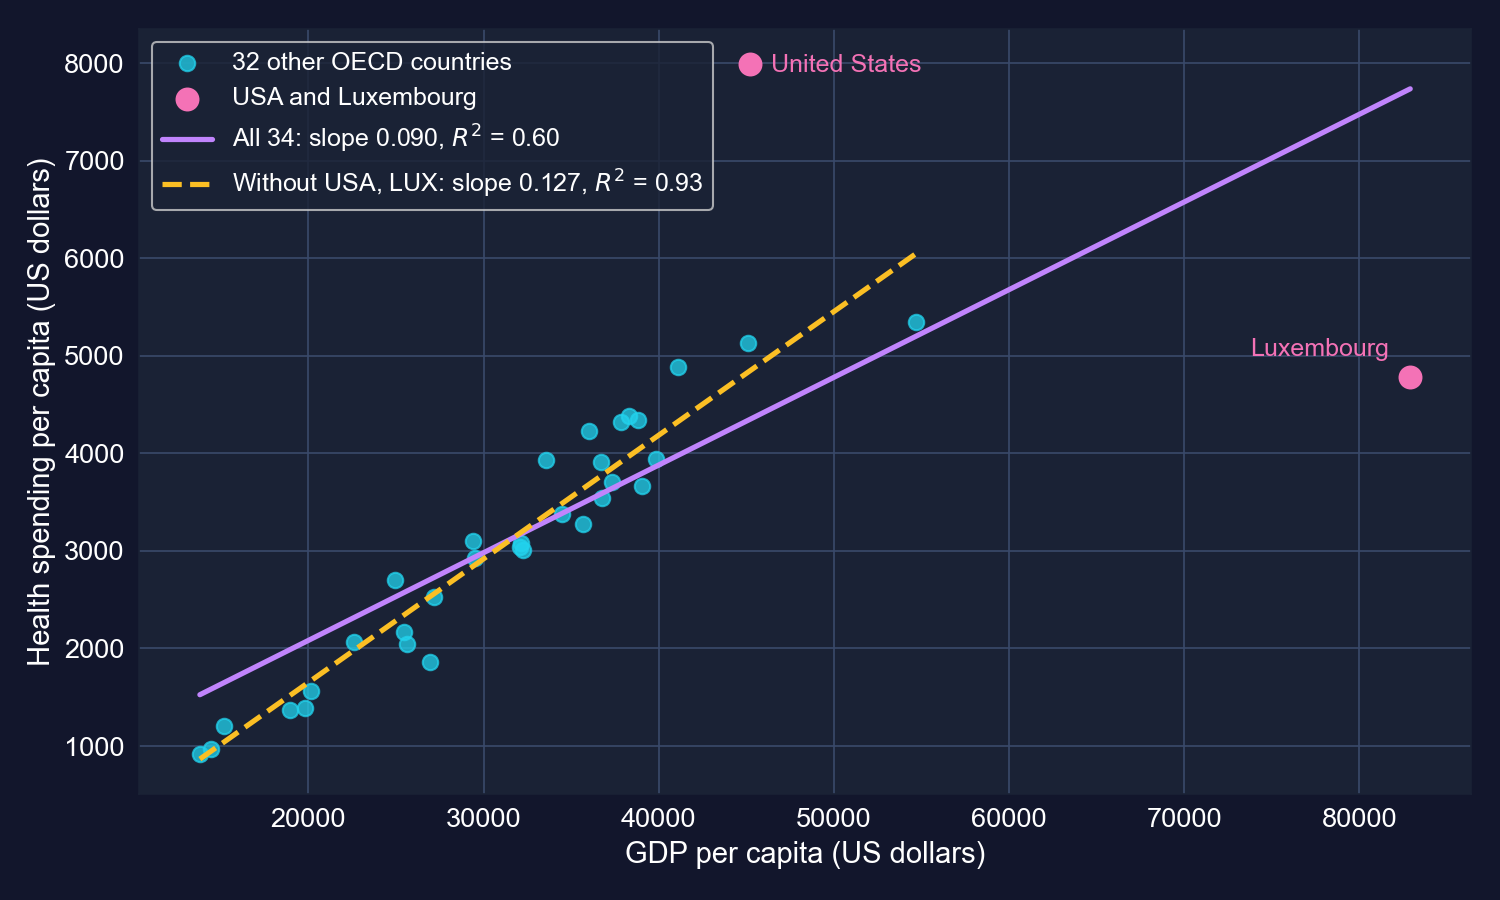
Health spending against GDP per capita. Purple: OLS on all 34 countries. Yellow dashed: OLS on the 32 countries without the USA and Luxembourg.
The USA sits far above any line; Luxembourg sits far to the right and below. Together they tilt the full-sample line and loosen the fit.
Anatomy of influence: drop each country on its own
| Sample | N | Slope | HC1 \(t\) | \(R^2\) | What changes |
|---|---|---|---|---|---|
| All countries | 34 | 0.0899 | 3.08 | 0.604 | — |
| Without USA | 33 | 0.0814 | 3.37 | 0.701 | fit improves, slope barely moves |
| Without Luxembourg | 33 | 0.1413 | 8.33 | 0.826 | slope jumps by 57% |
| Without both | 32 | 0.1267 | 16.65 | 0.928 | both effects |
Not in the chapter: the same HC1 regression on each subsample.
The USA is an outlier in \(y\): a huge residual that mostly adds noise. Luxembourg is a high-leverage point in \(x\) that drags the slope down.
Reading the robustness check correctly
- \(R^2 = 0.60\) is not a “weak fit” for a cross-section of 34 countries; GDP explains most of the variation
- Removing the two worst-fitting points mechanically raises \(R^2\): you deleted the largest residuals
- The subset line describes “the other 32 countries”, not a “true” relationship that the outliers were hiding
- Legitimate reasons to exclude: a data error, or a unit from a different population (a tiny financial centre whose GDP counts cross-border commuters’ output)
- The honest report shows both fits and says why they differ
Outlier checks are for understanding a slope, not for choosing the sample that gives the nicest \(R^2\).
Caveats for 8.2
- Association, not causation: GDP and health spending both reflect institutions, demographics and prices
- One year (2009): a recession year; GDP fell more than health budgets in many countries
- Functional form: a straight line in dollars imposes a varying elasticity; logs (Chapter 9) are the standard alternative
- Small N: with 34 observations, two countries move every statistic, as we just saw
Health spending rises with income, at roughly 9–13 cents per dollar depending on two countries. Everything finer than that needs more data or more structure.
Case 8.3 · How risky is Coca-Cola stock?
Financial time series · CAPM beta · testing \(\beta = 1\) and \(\alpha = 0\)
The theory: only market risk earns a premium
\[\underbrace{R_A - R_F}_{\text{asset excess return}} = \alpha_A + \beta_A\,\underbrace{(R_M - R_F)}_{\text{market excess return}} + u\]
- \(\beta_A\) = systematic risk: how much the asset moves with the market. The market itself has \(\beta = 1\)
- \(\beta > 1\): aggressive, amplifies market swings; \(\beta < 1\): defensive, dampens them
- \(\alpha_A\) = return beyond what \(\beta\) justifies. The CAPM predicts \(\alpha = 0\)
- \(u\) = firm-specific (idiosyncratic) shocks, which diversification removes
The CAPM hands us two hypotheses that are more interesting than “the slope is zero”: \(\beta = 1\) and \(\alpha = 0\).
The data: 354 months of excess returns, May 1983 – October 2012
| Variable (monthly) | Meaning | Mean | Std. dev. |
|---|---|---|---|
rm_rf |
market excess return, \(R_M - R_F\) | 0.555% | 4.556% |
rko_rf |
Coca-Cola excess return, \(R_A - R_F\) | 1.018% | 6.160% |
rf |
one-month Treasury bill rate | 0.350% | 0.221% |
N = 354 · returns are stored as decimals (0.05 = 5%) · the file also holds Target (rtgt_rf) and Walmart (rwmt_rf)
Coca-Cola is more volatile than the market (6.2% vs 4.6% a month), yet we will find it is less risky in the CAPM sense.
Coca-Cola and the market move together, but not one-for-one
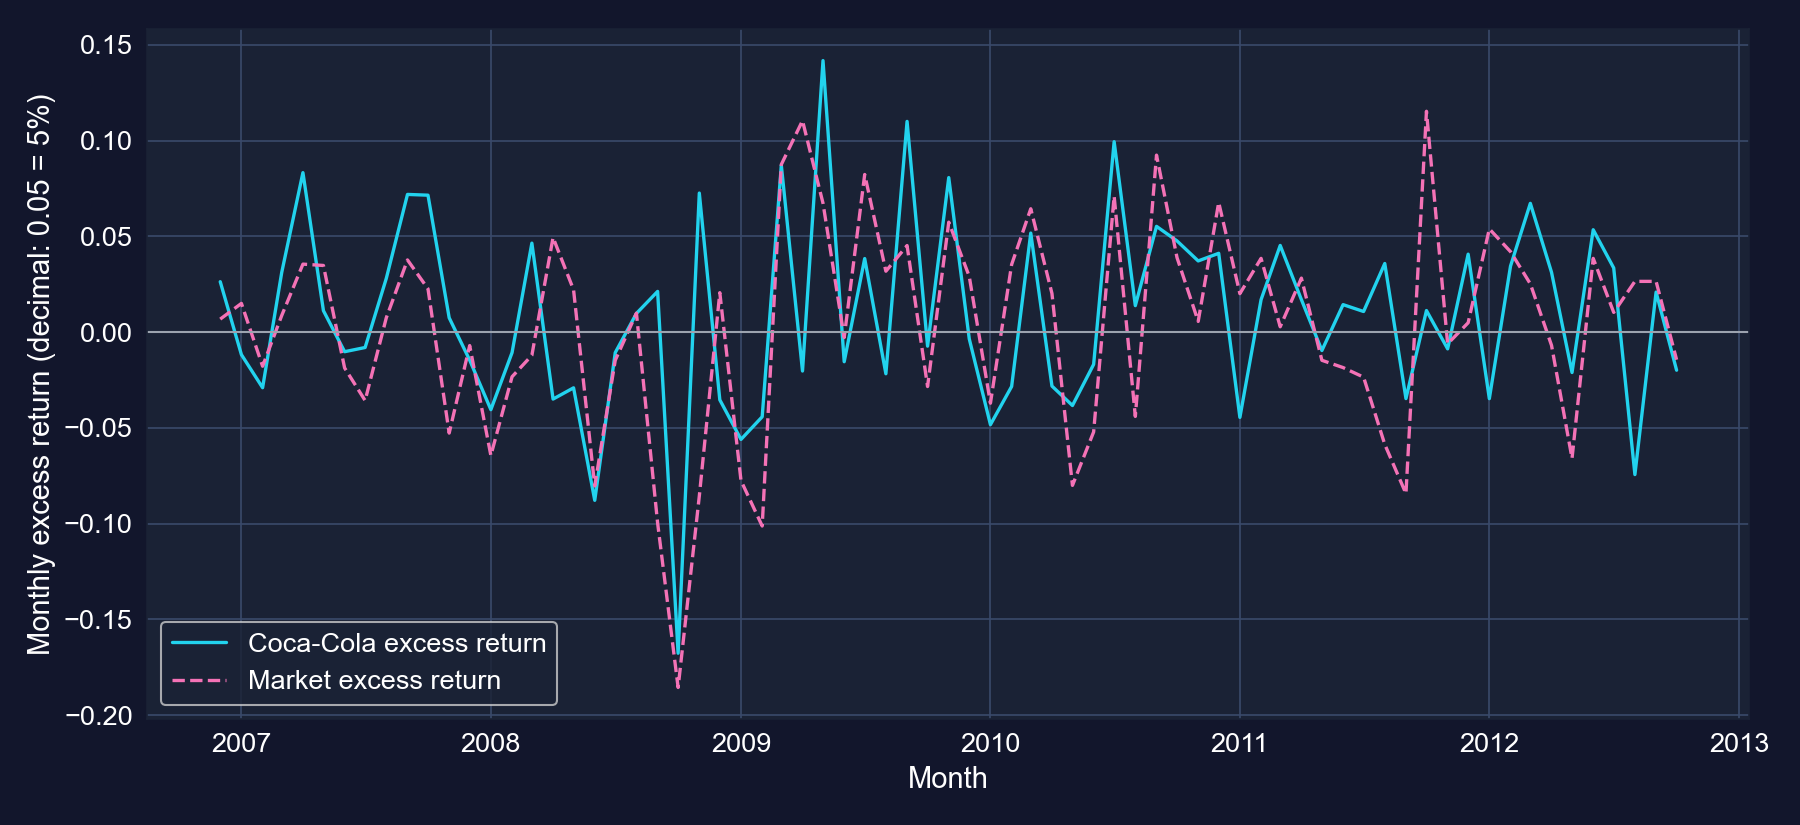
Monthly excess returns, December 2006 – October 2012 (the last 20% of the sample, as in the chapter’s Figure 8.3 Panel A).
The two lines share the big swings (2008–09), but Coca-Cola also moves on its own news. The regression measures how much of each.
Code: estimate the CAPM for Coca-Cola
!pip install -q pyfixest                      # pyfixest is not preinstalled in Colab
import pandas as pd                           # tabular data
import pyfixest as pf                         # OLS with robust SEs
from scipy import stats                       # t distribution for custom tests
url = "https://raw.githubusercontent.com/quarcs-lab/data-open/master/AED/AED_CAPM.DTA"
data_capm = pd.read_stata(url)                # 354 monthly returns, May 1983 – Oct 2012
print(data_capm[["rm_rf", "rko_rf", "rf"]].describe().T.round(4))   # Table 8.3 (excerpt)
model_capm = pf.feols("rko_rf ~ rm_rf", data=data_capm)                     # classical SEs
model_capm_robust = pf.feols("rko_rf ~ rm_rf", data=data_capm, vcov="HC1")  # robust SEs
model_capm_robust.summary() # alpha (Intercept), beta (rm_rf), R²Output: \(\hat\beta = 0.61\), and a positive \(\hat\alpha\)
| Variable | Coef. | SE (iid) | \(t\) | \(p\) | SE (HC1) | \(t\) | \(p\) |
|---|---|---|---|---|---|---|---|
Intercept (\(\alpha\)) |
0.00681 | 0.00295 | 2.31 | 0.022 | 0.00290 | 2.35 | 0.019 |
rm_rf (\(\beta\)) |
0.6063 | 0.0644 | 9.41 | < 0.001 | 0.0770 | 7.88 | < 0.001 |
N = 354 · \(R^2 = 0.201\) · 95% CI for \(\beta\): [0.4796, 0.7330] (iid), [0.4549, 0.7577] (HC1)
- Beta 0.61: a month when the market’s excess return is 1 percentage point higher goes with a Coca-Cola excess return about 0.61 points higher
- Alpha 0.0068: about 0.68% per month that the market exposure does not explain
- The robust SE for \(\beta\) is 1.2× the classical SE; both reject \(\beta = 0\) overwhelmingly
Coca-Cola co-moves with the market at about 61 cents on the market’s dollar. Both CIs lie entirely below 1.
Reading beta: three equivalent ways
- Scenario: market excess return +10% → predicted Coca-Cola excess return \(0.0068 + 0.606 \times 0.10 \approx\) +6.7%; market −10% → −5.4%
- Correlation × relative volatility: \(\hat\beta = r_{xy}\,\dfrac{s_y}{s_x} = 0.448 \times 1.352 = 0.606\)
- Risk split: \(R^2 = 0.201\), so the market accounts for 20% of the variance of Coca-Cola’s excess return; 80% is idiosyncratic
Coca-Cola is more volatile than the market, but most of that volatility is its own. The part that moves with the market is only 61% as large as the market’s.
Code: test \(\beta = 1\) and annualize alpha
# continues from the previous block
b = model_capm_robust.coef()["rm_rf"]             # estimated beta
se = model_capm_robust.se()["rm_rf"]              # robust standard error of beta
t_beta1 = (b - 1) / se                            # H0: beta = 1 (as risky as the market)
df = model_capm._N - 2                            # degrees of freedom, n − 2
print("t =", t_beta1, " p =", 2 * stats.t.sf(abs(t_beta1), df))   # two-sided p-value
alpha = model_capm.coef()["Intercept"]            # monthly alpha, in decimals
print("alpha x 12 =", 12 * alpha)                 # simple annualization (the chapter's 8.2%)
print("compounded =", (1 + alpha) ** 12 - 1) # compounding twelve monthly returnsOutput: beta is significantly below 1; alpha is about 8% a year
| Hypothesis | Estimate | SE type | \(t\) | \(p\) | Verdict at 5% |
|---|---|---|---|---|---|
| \(H_0: \beta = 1\) | 0.6063 | classical | −6.11 | < 0.001 | reject |
| \(H_0: \beta = 1\) | 0.6063 | HC1 | −5.11 | < 0.001 | reject: defensive |
| \(H_0: \alpha = 0\) | 0.00681 | classical | 2.31 | 0.022 | reject |
| \(H_0: \alpha = 0\) | 0.00681 | HC1 | 2.35 | 0.019 | reject |
Alpha annualized: 12 × 0.68% ≈ 8.2% (simple) or 8.5% (compounded)
The data say clearly that Coca-Cola is a defensive stock. They also say it earned more than its beta justified, which the CAPM says should not happen.
80% of Coca-Cola’s month-to-month risk is its own
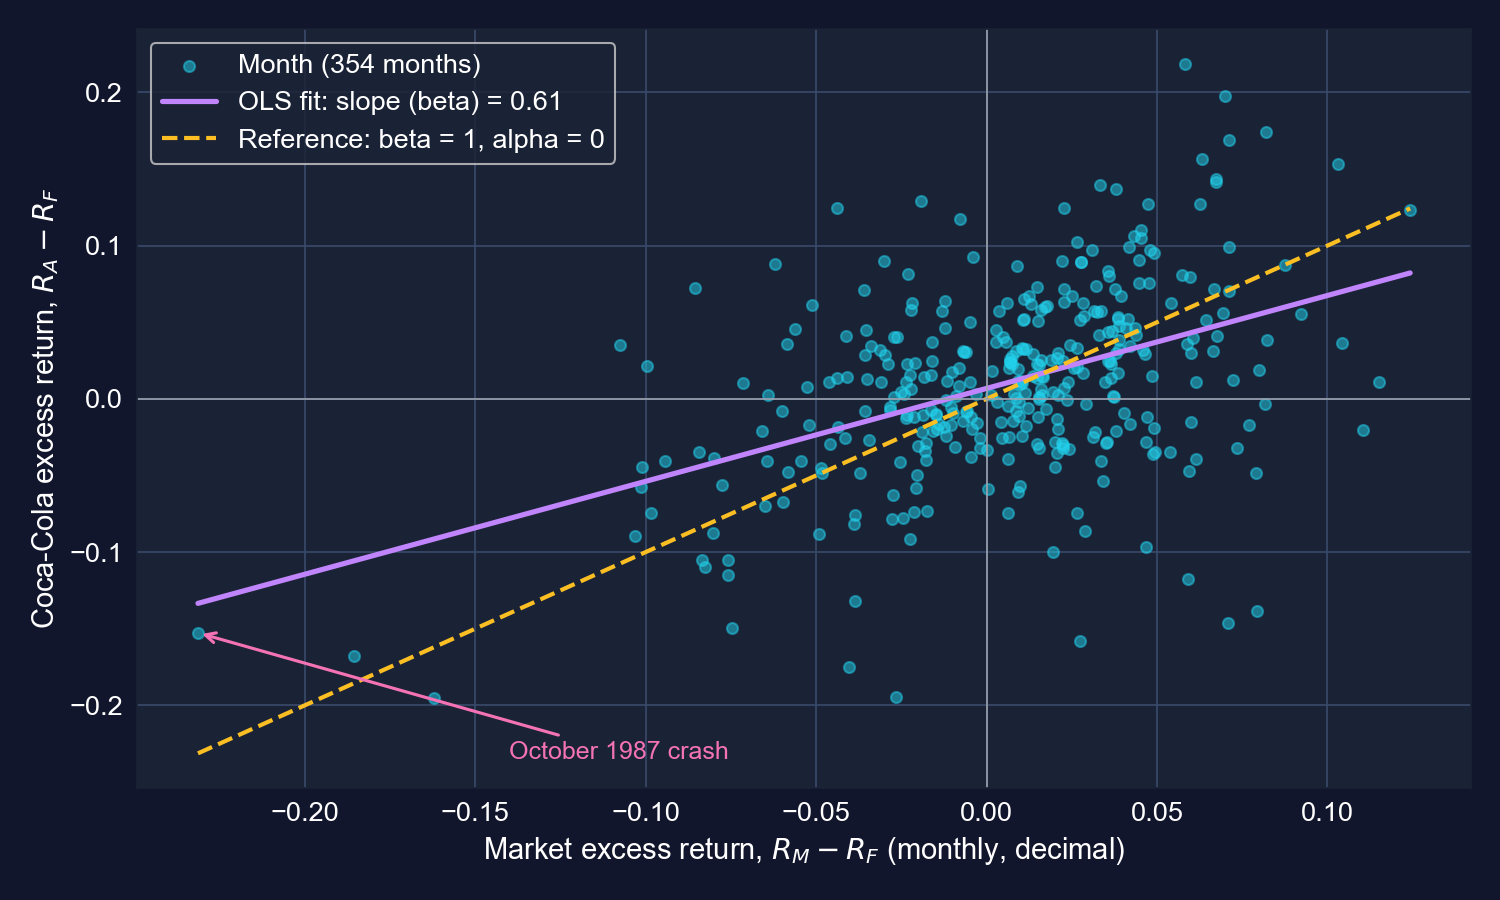
Coca-Cola’s excess return against the market’s, 354 months. Purple: OLS line (β = 0.61). Yellow dashed: what β = 1 and α = 0 would look like.
The fitted line is flatter than the β = 1 reference and crosses zero slightly above the origin. The wide vertical scatter is idiosyncratic risk, about 80% of the variance.
Why is alpha positive? Three readings
- The model is incomplete: other priced risk factors (size, value, momentum) are missing, so “alpha” is compensation for risks the CAPM ignores
- Genuine outperformance: Coca-Cola beat its risk-adjusted benchmark over 1983–2012
- Selection after the fact: Coca-Cola is famous because it did well. Studying a known winner over its winning period guarantees a positive alpha
One significant alpha in one hand-picked stock is weak evidence against the CAPM. Tests of the CAPM use many assets at once.
Code: the same regression for other stocks and other periods
# continues from the previous block — not in the chapter: simple comparisons, same estimator
for y in ["rko_rf", "rwmt_rf", "rtgt_rf"]:                    # Coca-Cola, Walmart, Target
    fit = pf.feols(f"{y} ~ rm_rf", data=data_capm, vcov="HC1")    # CAPM for each stock
    print(y, fit.coef().round(4).to_dict(), round(fit._r2, 3))    # alpha, beta, R²
half = len(data_capm) // 2                                    # split the 354 months in two
for name, part in [("1983–1998", data_capm.iloc[:half]), ("1998–2012", data_capm.iloc[half:])]:
    fit = pf.feols("rko_rf ~ rm_rf", data=part, vcov="HC1")       # Coca-Cola, each half
print(name, fit.coef().round(4).to_dict(), fit.pvalue().round(3).to_dict())Output: betas differ across stocks and drift over time
| Regression (HC1 SEs) | Months | \(\hat\alpha\) | \(p(\alpha)\) | \(\hat\beta\) | SE(\(\beta\)) | \(R^2\) |
|---|---|---|---|---|---|---|
| Coca-Cola, full sample | 354 | 0.0068 | 0.019 | 0.606 | 0.077 | 0.201 |
| Walmart, full sample | 354 | 0.0080 | 0.017 | 0.748 | 0.091 | 0.236 |
| Target, full sample | 354 | 0.0044 | 0.240 | 1.067 | 0.116 | 0.333 |
| Coca-Cola, 1983–1998 | 177 | 0.0112 | 0.002 | 0.844 | 0.095 | 0.344 |
| Coca-Cola, 1998–2012 | 177 | 0.0011 | 0.800 | 0.437 | 0.113 | 0.117 |
Not in the chapter: the same HC1 CAPM regression on other columns of AED_CAPM.DTA and on two halves of the sample (May 1983 – Jan 1998, Feb 1998 – Oct 2012).
Target is about as risky as the market; the two staples are defensive. Coca-Cola’s beta halved over time, and its alpha came from the first half.
Caveats for 8.3
- Standard errors: for monthly returns HC1 is reasonable: the residuals show almost no autocorrelation (lag-1 correlation −0.04)
- The CAPM itself does not assume returns are independent over time; the classical OLS standard errors do. That is a statement about inference, not about the model
- Time-varying beta: one beta for 30 years averages over very different periods (0.84 vs 0.44)
- Fat tails: crash months such as October 1987 carry a lot of weight in a least-squares fit
- Market proxy: a value-weighted index stands in for “the market portfolio” the theory refers to
\(\hat\beta = 0.61\) is a well-measured average sensitivity over 1983–2012. Use it to describe the past, not as a constant of nature.
Case 8.4 · Does Okun’s Law hold for the U.S.?
Macro time series · testing \(\beta_2 = -2\) · structural breaks
The question: how much growth do we lose when unemployment rises?
\[\text{rgdpgrowth}_t = \beta_1 + \beta_2\,\text{uratechange}_t + u_t\]
| Variable | Meaning | Mean | Std. dev. | Min | Max |
|---|---|---|---|---|---|
rgdpgrowth |
real GDP growth (%) | 3.06 | 2.04 | −2.54 (2009) | 7.24 (1984) |
uratechange |
change in unemployment rate (pp) | −0.03 | 0.99 | −2.14 (1984) | 3.53 (2009) |
N = 59 · annual U.S. data, 1961–2019 · Table 8.4 of the chapter
The benchmark is \(\beta_2 = -2\): each extra percentage point of unemployment goes with about 2 percentage points less growth.
Code: estimate Okun’s Law with classical and robust SEs
!pip install -q pyfixest                      # pyfixest is not preinstalled in Colab
import pandas as pd                           # tabular data
import pyfixest as pf                         # OLS with robust SEs
url = "https://raw.githubusercontent.com/quarcs-lab/data-open/master/AED/AED_GDPUNEMPLOY.DTA"
data_gdp = pd.read_stata(url)                 # annual U.S. data, 1961–2019
print(data_gdp[["rgdpgrowth", "uratechange"]].describe().T.round(2))   # Table 8.4
model_okun = pf.feols("rgdpgrowth ~ uratechange", data=data_gdp)                     # classical
model_okun_robust = pf.feols("rgdpgrowth ~ uratechange", data=data_gdp, vcov="HC1")  # robust
model_okun_robust.summary() # intercept, slope, HC1 SE, R²Output: slope −1.59, and \(R^2 = 0.59\)
| Variable | Coef. | SE (iid) | \(t\) | \(p\) | SE (HC1) | \(t\) | \(p\) |
|---|---|---|---|---|---|---|---|
Intercept |
3.008 | 0.171 | 17.59 | < 0.001 | 0.170 | 17.69 | < 0.001 |
uratechange |
−1.589 | 0.175 | −9.09 | < 0.001 | 0.163 | −9.75 | < 0.001 |
N = 59 · \(R^2 = 0.592\) · 95% CI for the slope: [−1.939, −1.239] (iid), [−1.915, −1.263] (HC1)
- Slope: a year in which unemployment rises by 1 percentage point has growth about 1.59 percentage points lower
- Intercept 3.0: predicted growth in a year when unemployment is unchanged, roughly the economy’s trend growth
- HC1 SE is slightly smaller than the classical SE (0.93×): robust is not always bigger
A strong, tight association: unemployment changes alone account for 59% of the year-to-year variation in growth.
Reading the coefficients in percentage points
- Unemployment 5% → 6% (+1 pp): predicted growth falls from 3.0% to \(3.008 - 1.589 \approx\) 1.4%
- Break-even: unemployment is predicted to stay flat only when growth is about 3.0%
- Zero growth goes with a predicted rise in unemployment of \(3.008 / 1.589 \approx\) 1.9 pp
- Percent vs percentage point: growth is a percent change; the regressor is a change in a rate, so its unit is the percentage point
Okun’s Law is a statement about percentage points. “Unemployment up 1%” would mean from 5% to 5.05%, a completely different claim.
Code: test the −2 benchmark and inspect the residuals
# continues from the previous block
from scipy import stats                                   # t distribution
b = model_okun.coef()["uratechange"]                      # slope estimate
se = model_okun.se()["uratechange"]                       # classical SE, as in the chapter
t_okun = (b - (-2.0)) / se                                # H0: beta2 = -2
print("t =", t_okun, " p =", 2 * stats.t.sf(abs(t_okun), model_okun._N - 2))
pred = model_okun.predict()                               # fitted growth, year by year
resid = data_gdp["rgdpgrowth"] - pred                     # actual minus predicted
late = (data_gdp["year"] >= 2010).values                  # the 2010s
print("2010s below prediction:", (resid[late] < 0).sum(), "of", late.sum())
print("mean actual vs predicted:", data_gdp["rgdpgrowth"][late].mean(), pred[late].mean())Output: −2 is rejected at 5%, though the estimate is not far from it
| Test of \(H_0: \beta_2 = -2\) | Estimate | SE | \(t\) | \(p\) | 95% CI |
|---|---|---|---|---|---|
| Classical SEs | −1.589 | 0.175 | 2.35 | 0.022 | [−1.939, −1.239] |
| HC1 SEs | −1.589 | 0.163 | 2.52 | 0.014 | [−1.915, −1.263] |
- Both CIs exclude −2, but only just: −2 lies 0.06–0.09 below their lower ends
- At the 1% level we would not reject −2 (\(p > 0.01\) either way)
- Economically, −1.59 vs −2 is a difference of 0.4 points of growth per point of unemployment
Statistically different from −2 at 5%, economically close. The U.S. relationship in 1961–2019 is somewhat weaker than the rule of thumb.
Every year of negative growth had rising unemployment
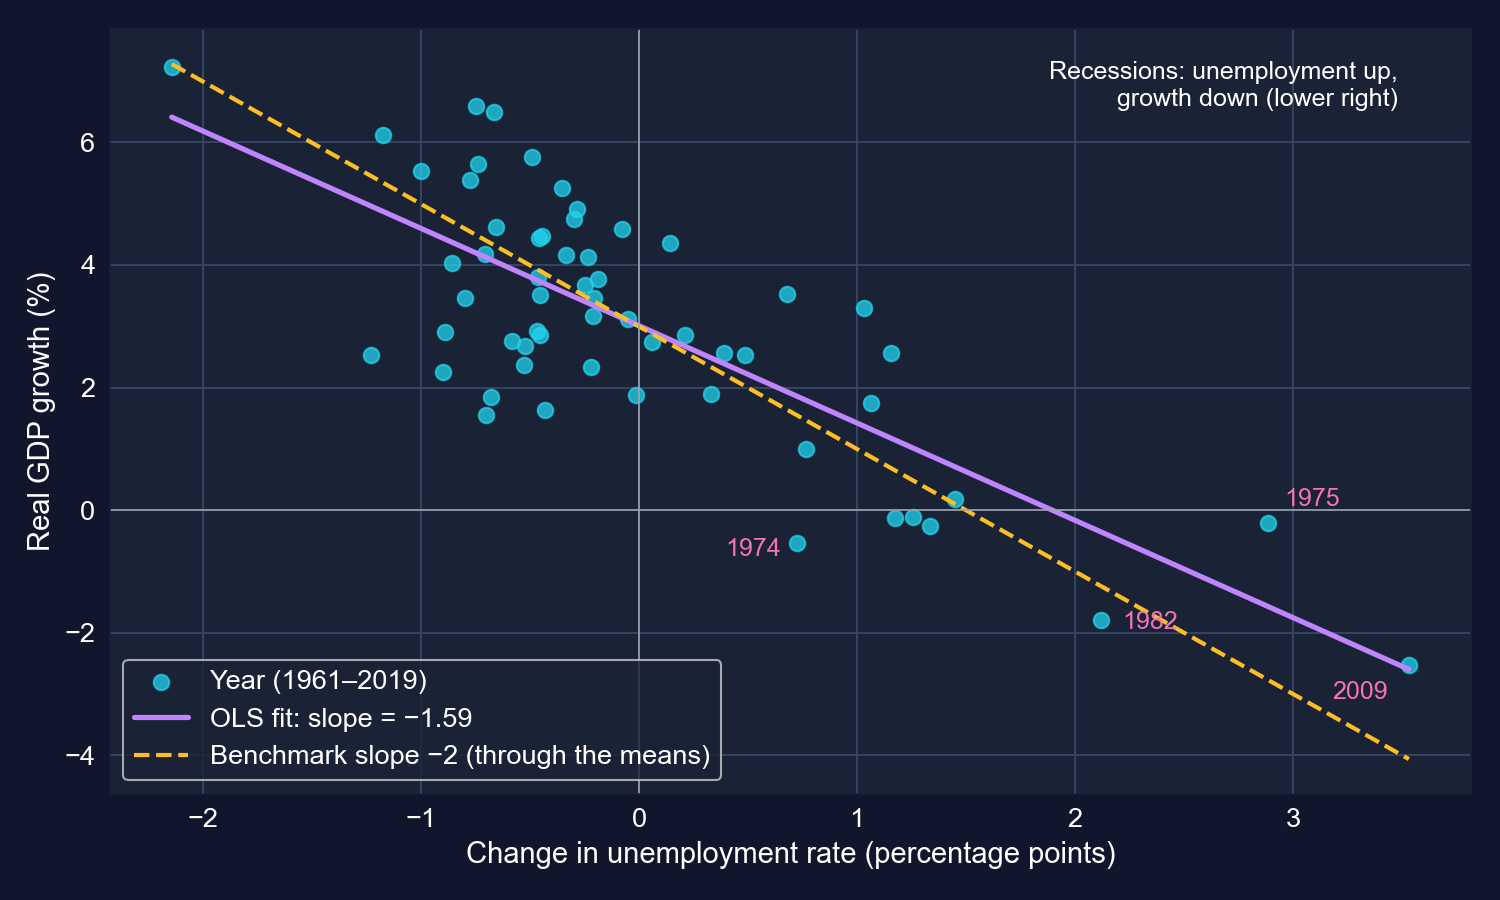
GDP growth against the change in unemployment, one point per year. Purple: OLS line (−1.59). Yellow dashed: a line with slope −2 drawn through the sample means.
Recessions sit in the lower right: unemployment up, growth down. All 7 years with negative growth (1974, 1975, 1980, 1982, 1991, 2008, 2009) had unemployment rising.
Actual vs predicted: the line works until the 2010s
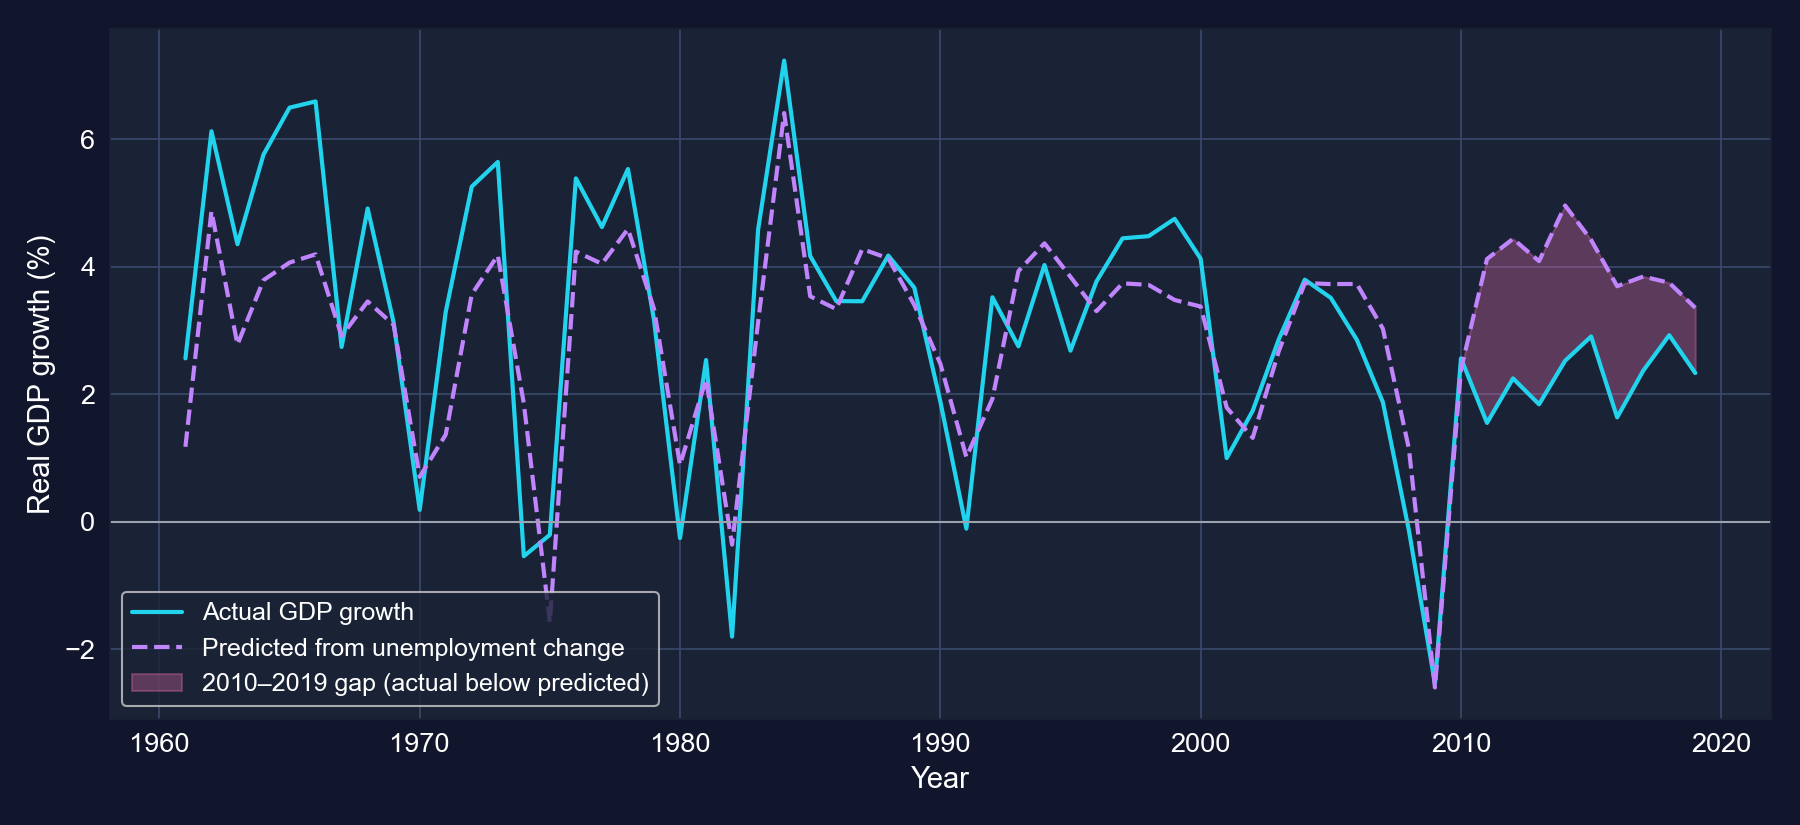
Actual real GDP growth and the growth predicted from unemployment changes, 1961–2019. Shaded: the gap in 2010–2019.
From 2010 to 2019 actual growth fell below the prediction in 9 of 10 years, by 1.6 points on average (2.3% actual vs 3.9% predicted).
Was the fit “excellent” before 2008?
| Period | Years | Root-mean-squared error | Mean residual |
|---|---|---|---|
| 1961–2007 | 47 | 1.16 | +0.37 |
| 2008–2019 | 12 | 1.70 | — |
| 2010–2019 | 10 | — | −1.62 |
Computed from the chapter’s fitted model; no re-estimation.
- Before 2008 the typical miss was still about 1.2 points of growth, e.g. 1974: −0.5% actual vs +1.9% predicted
- After 2008 the misses are larger and one-signed, the signature of a shift in the relationship
The relationship was good, not excellent, before 2008, and it broke down in a systematic way afterwards. One line for 59 years hides that.
Caveats for 8.4: time series need time-series inference
- Autocorrelation: the residuals’ lag-1 correlation is 0.47; good and bad years come in runs
- HC1 corrects for heteroskedasticity but not for autocorrelation; the textbook fix is HAC (Newey–West) SEs, used in Chapters 13 and 17
- Structural break: one slope for 1961–2019 averages over at least two regimes
- Not causal: both growth and unemployment respond to the same demand and supply shocks; Okun’s Law is a regularity, not a lever
With autocorrelated errors, both the classical and HC1 SEs are likely too small, so the rejection of −2 at 5% is less secure than it looks.
Reading it right
Act III · The resolution
Four cases, side by side
| Case | Slope, in its units | \(R^2\) | SE ratio, HC1 / classical | Does HC1 change the verdict? | Main threat |
|---|---|---|---|---|---|
| 8.1 life expectancy | +1.11 years per $1,000 | 0.32 | 1.62 | no (\(p\) 0.023) | USA; income confounding |
| 8.1 infant mortality | −0.69 deaths per 1,000 per $1,000 | 0.14 | 1.73 | yes: \(p\) 0.027 → 0.188 | USA, Mexico, Turkey |
| 8.2 health spending | +$90 per $1,000 of GDP | 0.60 | 2.27 | no (\(p\) 0.004) | USA, Luxembourg |
| 8.3 CAPM | \(\beta = 0.61\) (unit-free) | 0.20 | 1.19 | no | time-varying beta |
| 8.4 Okun | −1.59 pp per pp | 0.59 | 0.93 | no | autocorrelation, break |
Robust SEs matter most in small cross-sections with high-leverage countries, least in the long time series.
Testing the hypothesis that matters, not just \(\beta = 0\)
| Case | Null hypothesis | Why it matters | Robust \(t\) | Verdict at 5% |
|---|---|---|---|---|
| 8.1–8.2 | \(\beta_2 = 0\) | is there any association? | 2.40, −1.35, 3.08 | reject, not reject, reject |
| 8.3 | \(\beta = 1\) | is the stock as risky as the market? | −5.11 | reject: defensive |
| 8.3 | \(\alpha = 0\) | does the CAPM price this stock? | 2.35 | reject (but see selection) |
| 8.4 | \(\beta_2 = -2\) | does the rule of thumb hold? | 2.52 | reject, narrowly |
Theory supplies the interesting null. The \(t\)-statistic is the same formula with a different number subtracted.
One country, two case studies: what the USA does to the slopes
| Regression | All countries | Without the USA | Change |
|---|---|---|---|
| Life expectancy on spending, per $1,000 | 1.11 | 1.69 | slope +52%, \(R^2\) 0.32 → 0.51 |
| Infant mortality on spending, per $1,000 | −0.69 | −1.20 | becomes significant with HC1 (\(p\) 0.019) |
| Health spending on GDP, per $1,000 | $89.9 | $81.4 | \(R^2\) 0.60 → 0.70 |
The USA spends the most and gets less than the line predicts. Whether it belongs in the sample is a question about the population you want to describe.
The tempting mistake — and the correction
Objection. “The USA and Luxembourg are outliers. Drop them and the true relationship appears: \(R^2 = 0.93\).”
Response. Deleting the two largest residuals raises \(R^2\) by construction. The 32-country line describes the other 32 countries; it is not truer, it answers a narrower question. The USA is a real health system, and its distance from the line is the most policy-relevant fact in the dataset.
Use outlier checks to learn which observations drive a result and why, then report every version you looked at.
Five questions to ask of any bivariate slope
- Units: what does one unit of \(x\) and of \(y\) mean, and how big is the slope in a meaningful unit?
- Uncertainty: classical or robust? Does the verdict change? For time series, is HAC needed?
- Influence: which observations sit far from \(\bar x\) or far from the line, and what happens without them?
- Hypothesis: is \(\beta = 0\) the interesting null, or does theory supply a better one, such as \(\beta = 1\) or \(\beta = -2\)?
- Interpretation: is this an association, or does something in the design justify a causal reading?
Each case in this chapter failed at least one question on the first pass. Asking all five is the craft.
What to carry forward
- One estimator,
pf.feols, fits cross-sectional, financial and macro data alike - Add
vcov="HC1"for cross-sections; for time series, look ahead to HAC standard errors - Translate every slope into meaningful units before judging its size
- Find the influential observations, refit without them, and report both
- Test the hypothesis theory gives you, and keep economic and statistical significance apart
Next: Chapter 9 puts the variables in logs, so slopes become elasticities and percentage effects directly.