House prices depend on size and bedrooms and age and lot size — all at once.
A bivariate regression of price on bedrooms alone says each bedroom is worth $23,667. But bigger houses also have more bedrooms. How much is the bedroom really worth, once we hold size fixed? Multiple regression is the tool that separates tangled effects.
Where we’re going
Look first — scatterplot matrix and correlations before any model
Estimate a multiple regression by OLS with pyfixest
Interpret each slope as a partial effect — holding the others constant
Compare models with \(R^2\) vs adjusted \(R^2\) (and AIC/BIC)
Diagnose confounding and perfect collinearity
Six ideas anchor this chapter
Multiple regression — \(\hat{y} = b_1 + b_2 x_2 + \cdots + b_k x_k\); each slope is a partial effect
Correlation matrix — every pairwise \(r\) at a glance, before modeling
Control variable — added to keep a confounder from biasing the focal slope
Confounder — drives both \(x\) and \(y\), faking a relationship if omitted
Adjusted \(R^2\) — \(R^2\) with a penalty for extra regressors
Perfect collinearity — one regressor is an exact combination of others → inestimable
A multiple-regression slope answers “all else equal” — the question economics actually asks.
From one variable to many
Act II · The investigation
The bedrooms coefficient is a trap
29 house sales in Davis, California (1999), with size, bedrooms, bathrooms, lot size, age, month sold.
On its own, bedrooms looks like a $23,667 driver. The suspicion: that number is really size showing up in disguise. To find out, we first look at how the variables move together.
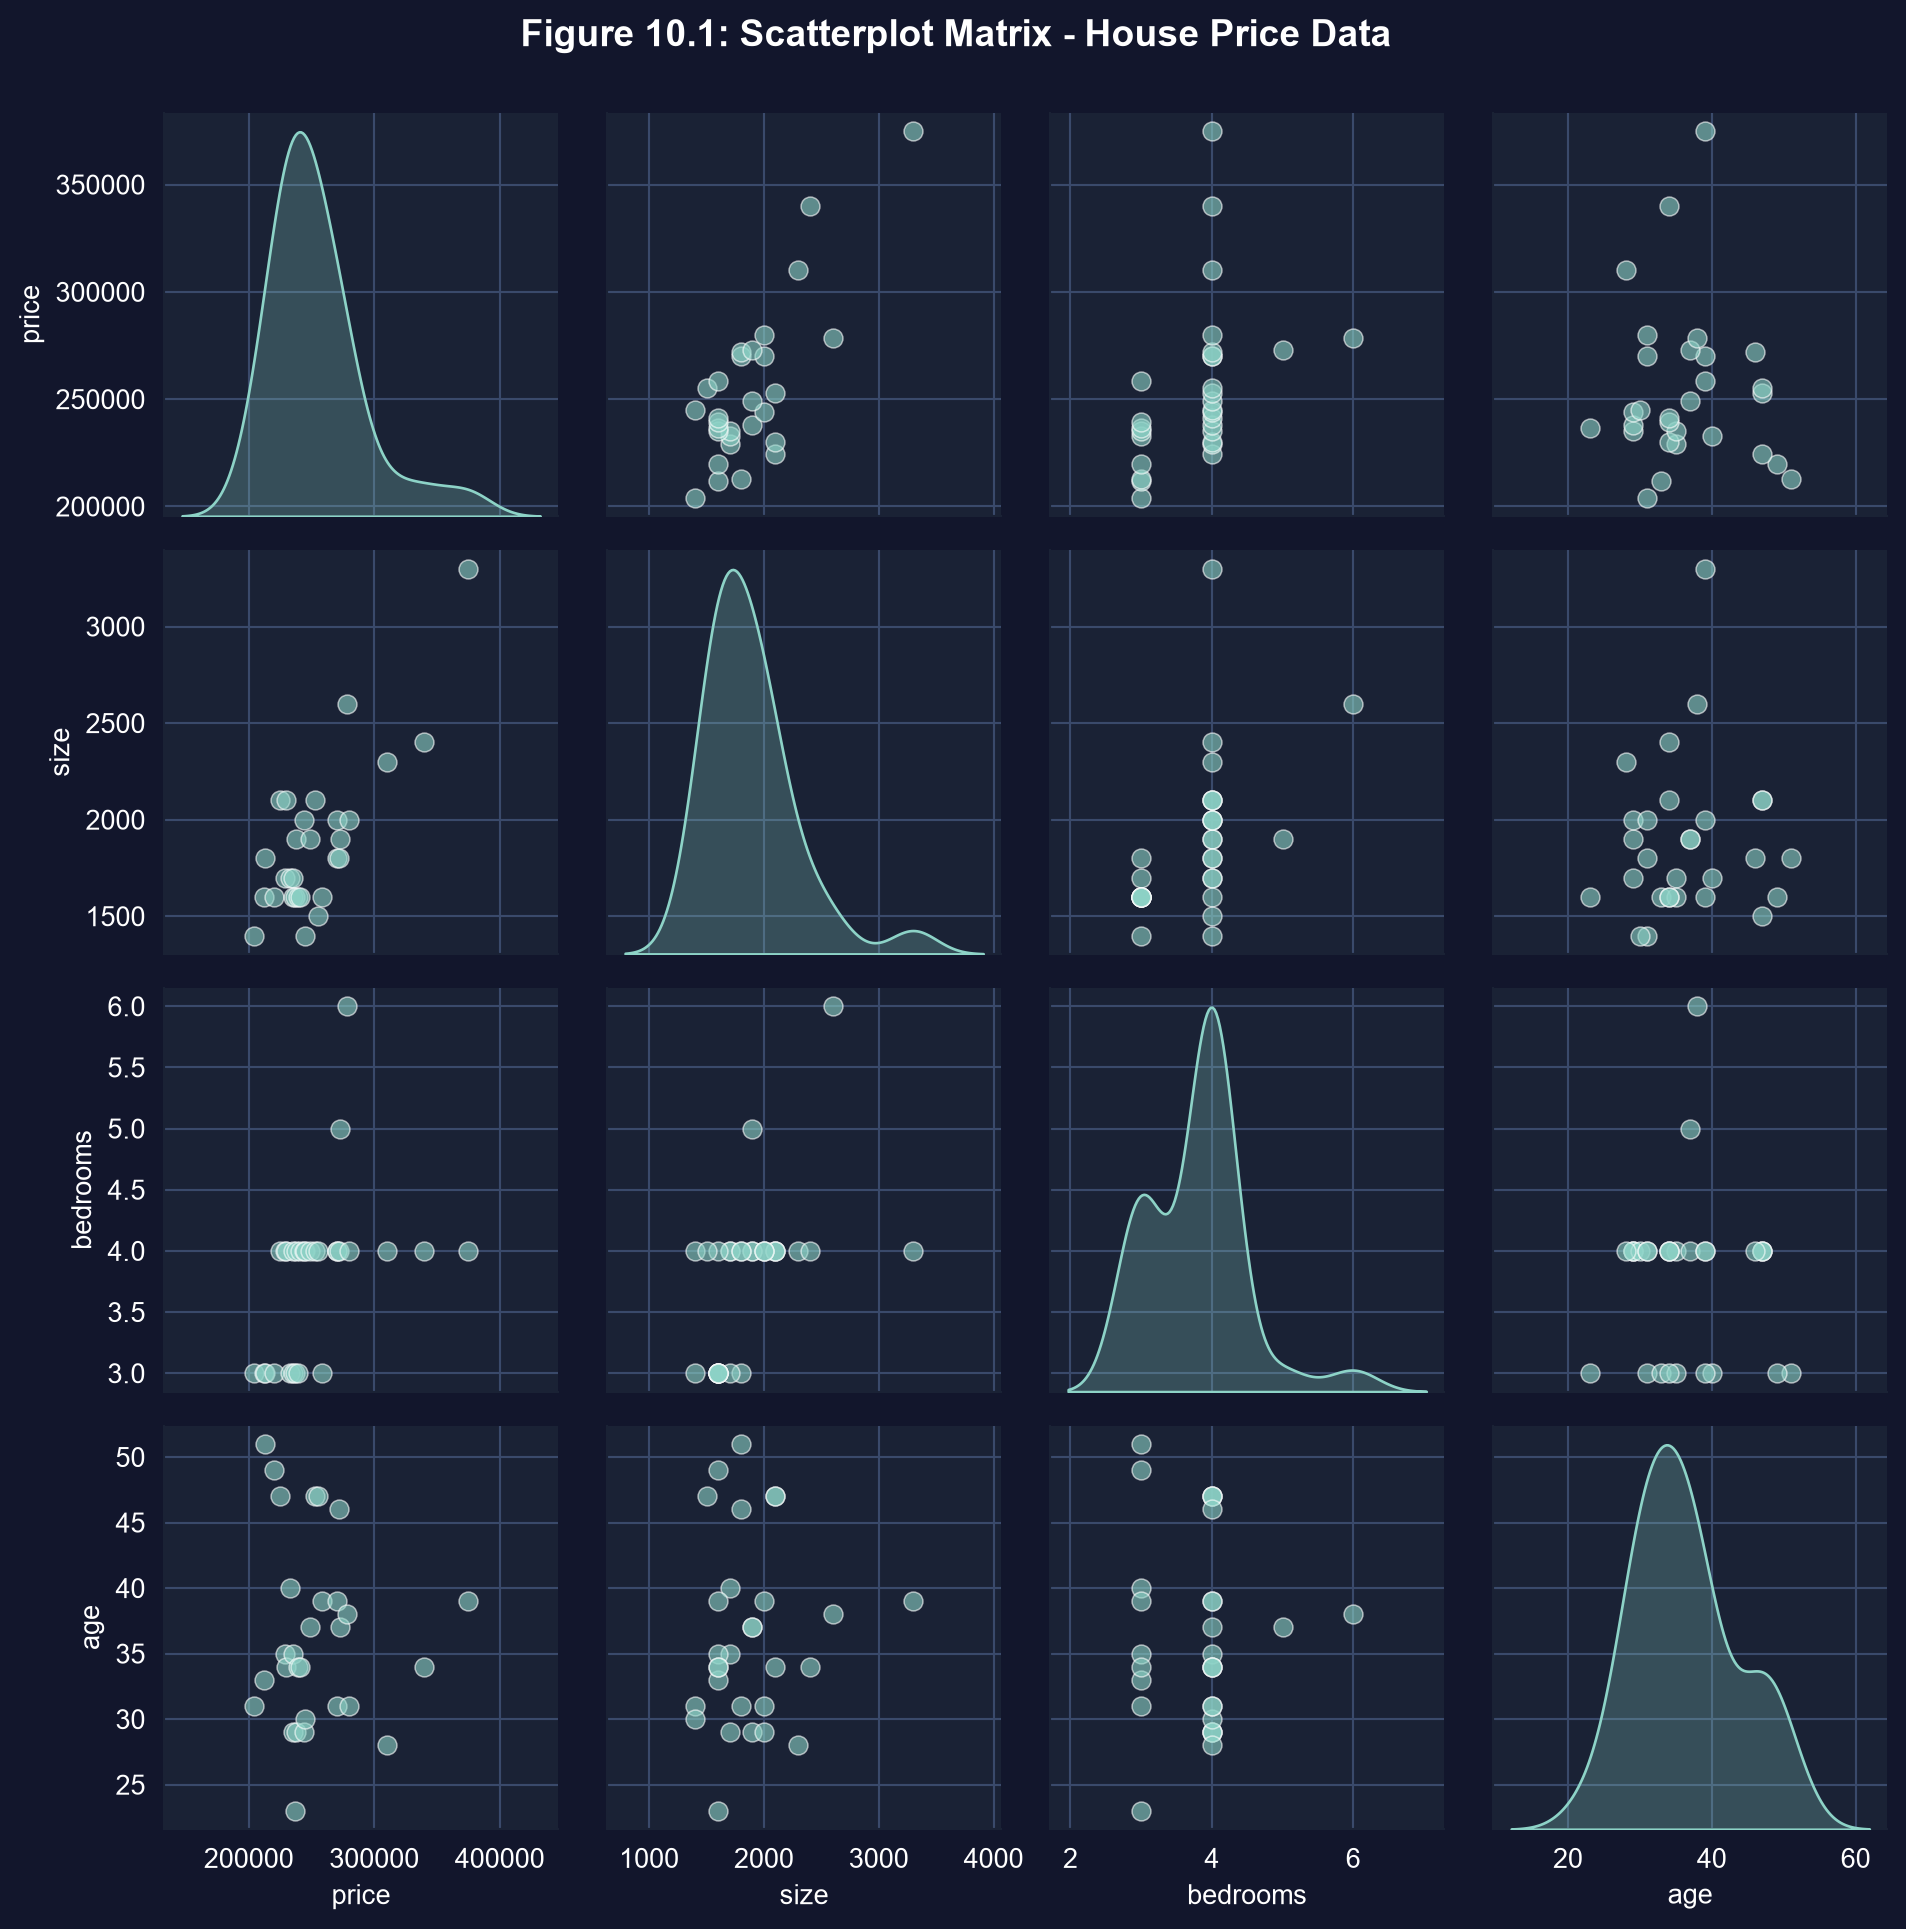
Step 1 — see every pair at once with a scatterplot matrix
import pandas as pd # tabular dataimport seaborn as sns # statistical visualizationurl ="https://raw.githubusercontent.com/quarcs-lab/data-open/master/AED/AED_HOUSE.DTA"data = pd.read_stata(url) # 29 Davis, CA house salesplot_vars = ["price", "size", "bedrooms", "age"] # columns to cross-plotg = sns.pairplot(data[plot_vars], # every two-way scatter + KDE on the diagonal diag_kind="kde", plot_kws={"color": "#1fb2dd"}) # brand cyan markers
Each off-diagonal panel is one two-way scatter; the diagonal shows each variable’s distribution. Price climbs with size most clearly.
Look before you model: the matrix shows which predictors move with price — and with each other.
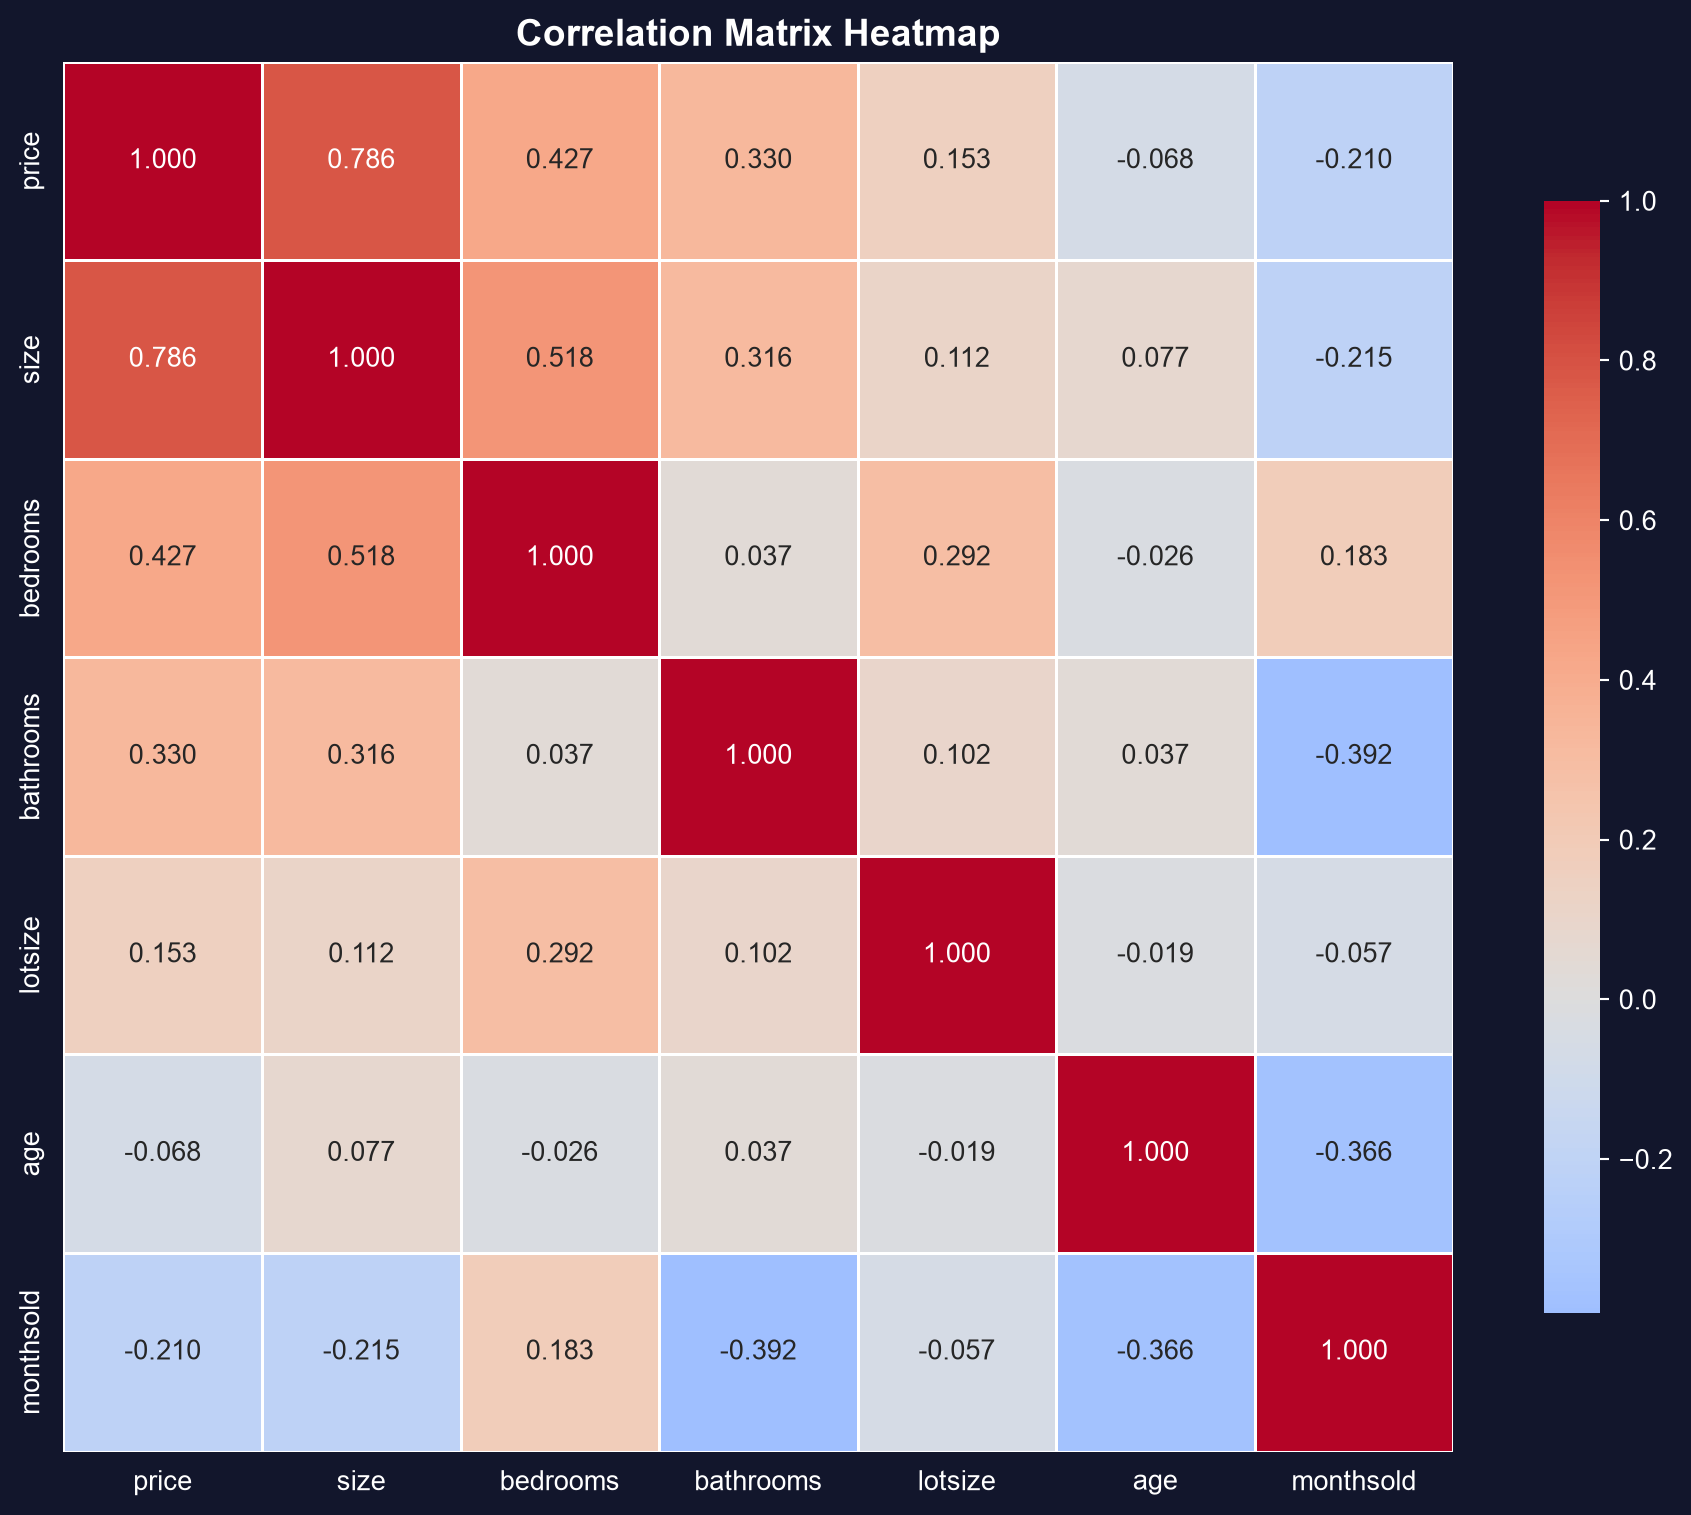
Step 2 — quantify the pairwise links with a correlation matrix
import pandas as pd # tabular dataimport seaborn as sns # heatmapurl ="https://raw.githubusercontent.com/quarcs-lab/data-open/master/AED/AED_HOUSE.DTA"data = pd.read_stata(url) # load the 29 house salescorr_vars = ["price", "size", "bedrooms", "bathrooms", "lotsize", "age"]corr = data[corr_vars].corr() # pandas .corr() → pairwise correlation matrixsns.heatmap(corr, annot=True, fmt=".2f", # print each r in its cell cmap="coolwarm", center=0) # diverging colours around 0corr # show the raw matrix too
Size is the strongest predictor — and it moves with bedrooms
Correlation heatmap of the six variables. Price–size is the hottest cell; size–bedrooms is warm.
\(r(\text{price},\text{size}) = 0.79\) · \(r(\text{price},\text{bedrooms}) = 0.43\) · \(r(\text{size},\text{bedrooms}) = 0.52\) — size and bedrooms overlap, so their effects will be hard to separate.
Step 3 — fit the full multiple regression with pyfixest
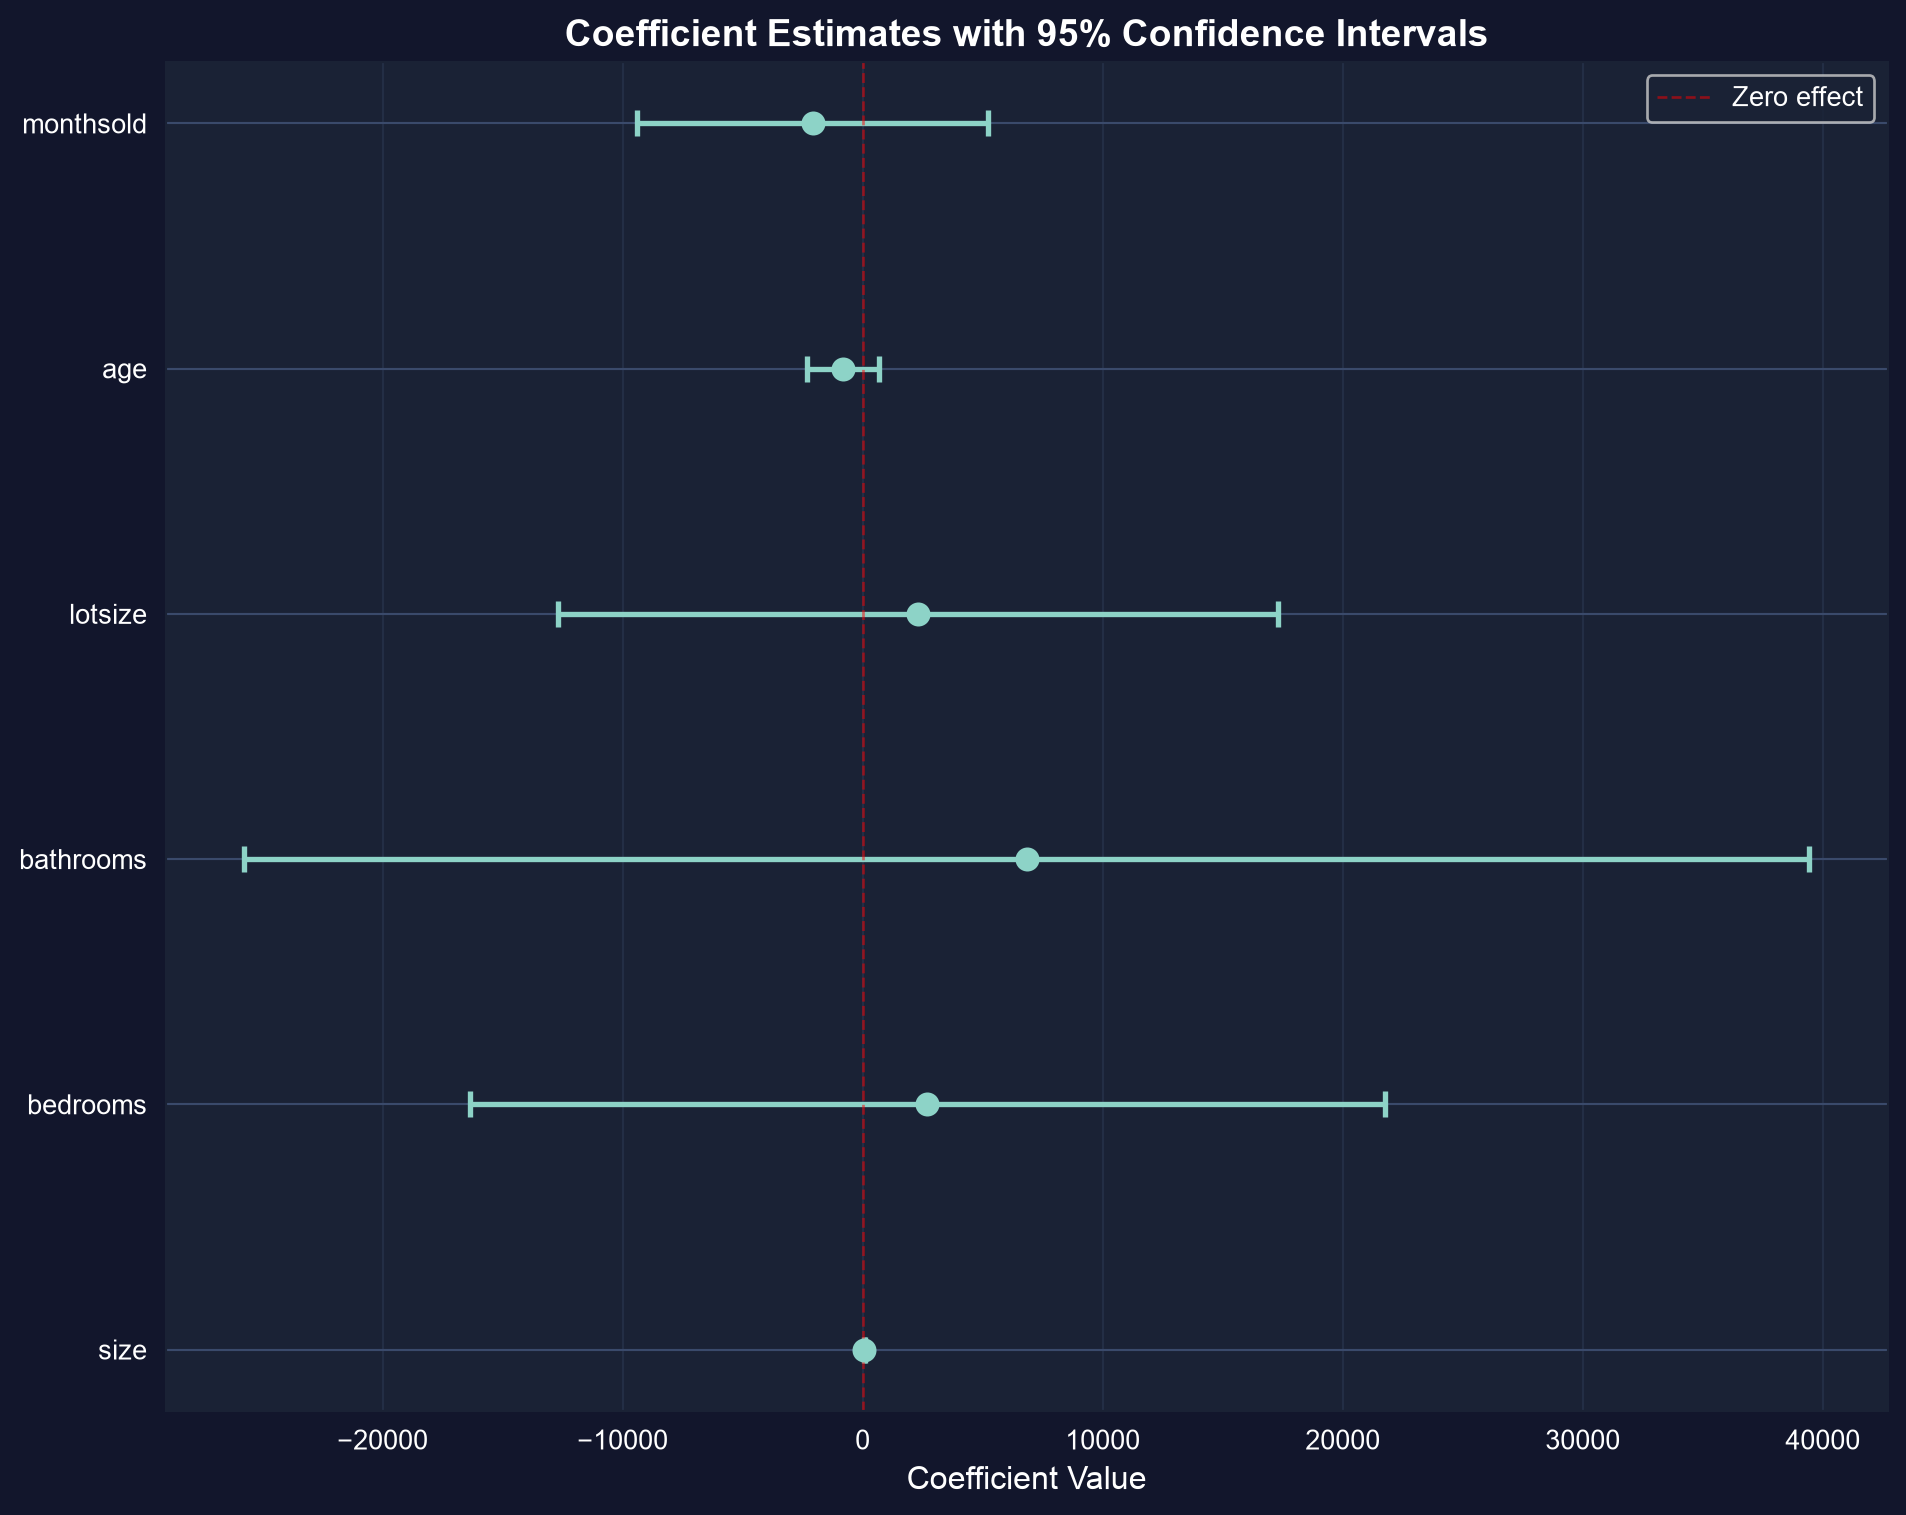
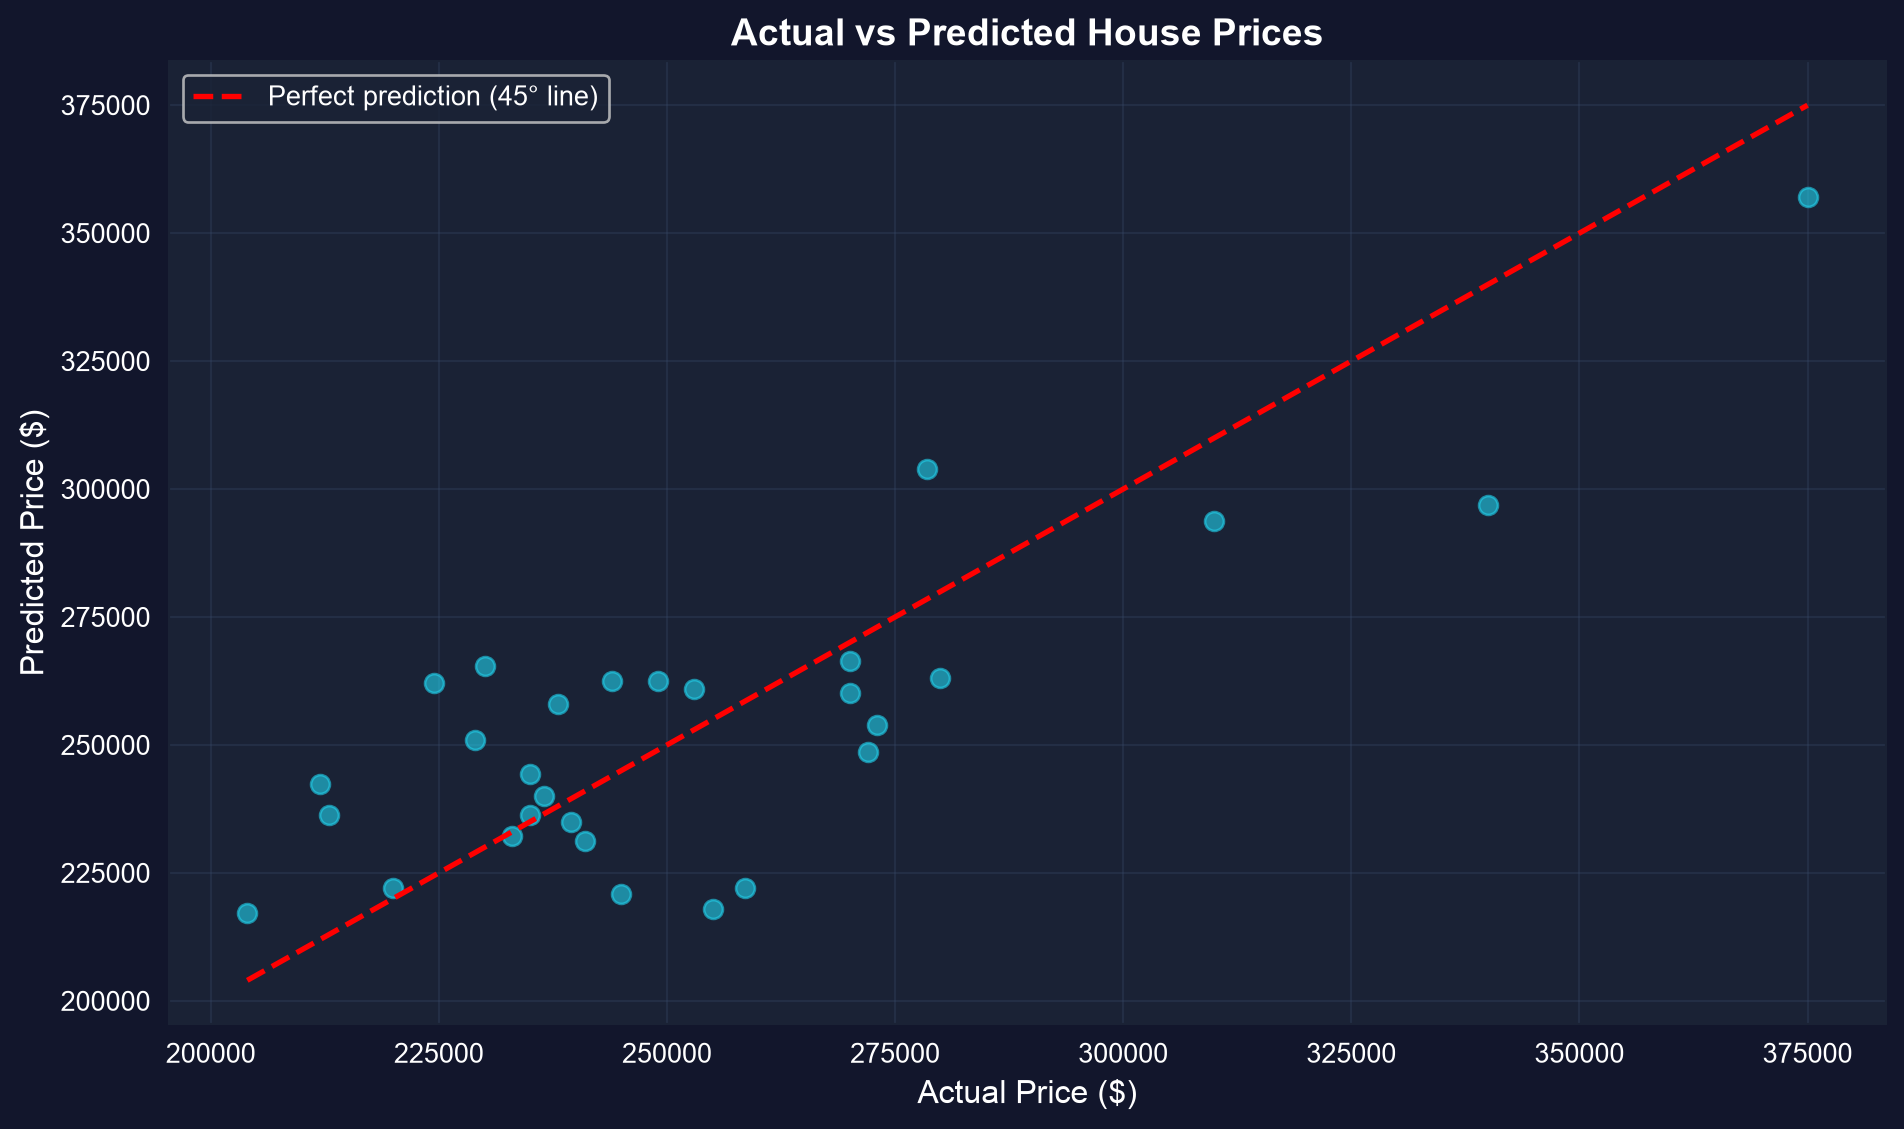
!pip install -q pyfixest # install pyfixest in Colab (-q = quiet; not preinstalled)import pandas as pd # tabular dataimport pyfixest as pf # pyfixest → OLS regression, R-style formulasurl ="https://raw.githubusercontent.com/quarcs-lab/data-open/master/AED/AED_HOUSE.DTA"data = pd.read_stata(url) # load the 29 Davis, CA house salesfit = pf.feols("price ~ size + bedrooms + bathrooms + lotsize + age + monthsold", data=data) # OLS with six regressors at oncefit.summary() # partial slopes, SEs, t, p, R²
On \(n = 29\) houses, the five extra predictors barely earn their keep — the simple model is competitive.
With few observations, parsimony wins: don’t buy a lower \(\bar{R}^2\) with variables that add nothing.
Reading it right
Act III · The resolution
When a coefficient simply cannot exist
Objection. “If more predictors help, why not add size_twice = 2 × size?”
Response.Perfect collinearity.size_twice carries zero new information, so OLS has no unique solution — the software drops one of the pair (pyfixest warns which). Like identical twins with one set of measurements: distinct names, identical data. Watch for it whenever one regressor is an exact combination of others.
Correlation among regressors is normal; an exact linear dependence is fatal to estimation.
What to carry forward
Each multiple-regression slope is a partial effect — the change in \(y\) per unit of \(x_j\), others held fixed.
Look before you model: scatterplot matrix (sns.pairplot) + correlation matrix (.corr()).
Omitting a confounder biases the focal slope; adding it as a control corrects it ($23,667 → $1,553).
Compare specifications with adjusted \(R^2\), AIC, and BIC — not plain \(R^2\).
Perfect collinearity makes a model inestimable; moderate correlation just widens standard errors.
Hold the others constant — then the slope tells the truth.