Act I · The tension
The classical standard-error formula assumes errors are independent and equally spread. Real data rarely cooperate: cross-sections are heteroskedastic, grouped data are clustered, time series are autocorrelated.
Under all three, OLS coefficients stay unbiased — the line is still right. What breaks is the standard error: the \(t\)-stats, \(p\)-values, and intervals built on it become untrustworthy. This chapter fixes the uncertainty, then asks what regression can and cannot predict.
Coefficients stay put; this chapter is about trusting the numbers around them.
Act II · The investigation
The OLS point estimate is unbiased under all three. Only the standard error needs the correction.
vcov="HC1"!pip install -q pyfixest # pyfixest isn't preinstalled in Colab (-q = quiet)
import pandas as pd # tabular data
import pyfixest as pf # pyfixest → OLS with robust SEs, R-style formulas
url = "https://raw.githubusercontent.com/quarcs-lab/data-open/master/AED/AED_HOUSE.DTA"
data = pd.read_stata(url) # 29 Davis, CA house sales (1999)
f = "price ~ size + bedrooms + bathrooms + lotsize + age + monthsold"
default = pf.feols(f, data=data) # classical SEs (assume homoskedasticity)
robust = pf.feols(f, data=data, vcov="HC1") # SAME coefficients, heteroskedastic-robust SEsEach extra square foot is worth about $68 in sale price, and it is strongly significant either way: robust SE for size is 15.36 vs. default 15.39 (\(p = 0.0002\)).
The biggest adjustments are bathrooms (robust SE ~23% larger) and lotsize (~26% smaller) — but both stay far from significance under either method.
A rule of thumb: if robust SEs move more than ~30%, heteroskedasticity is real — report the robust ones.
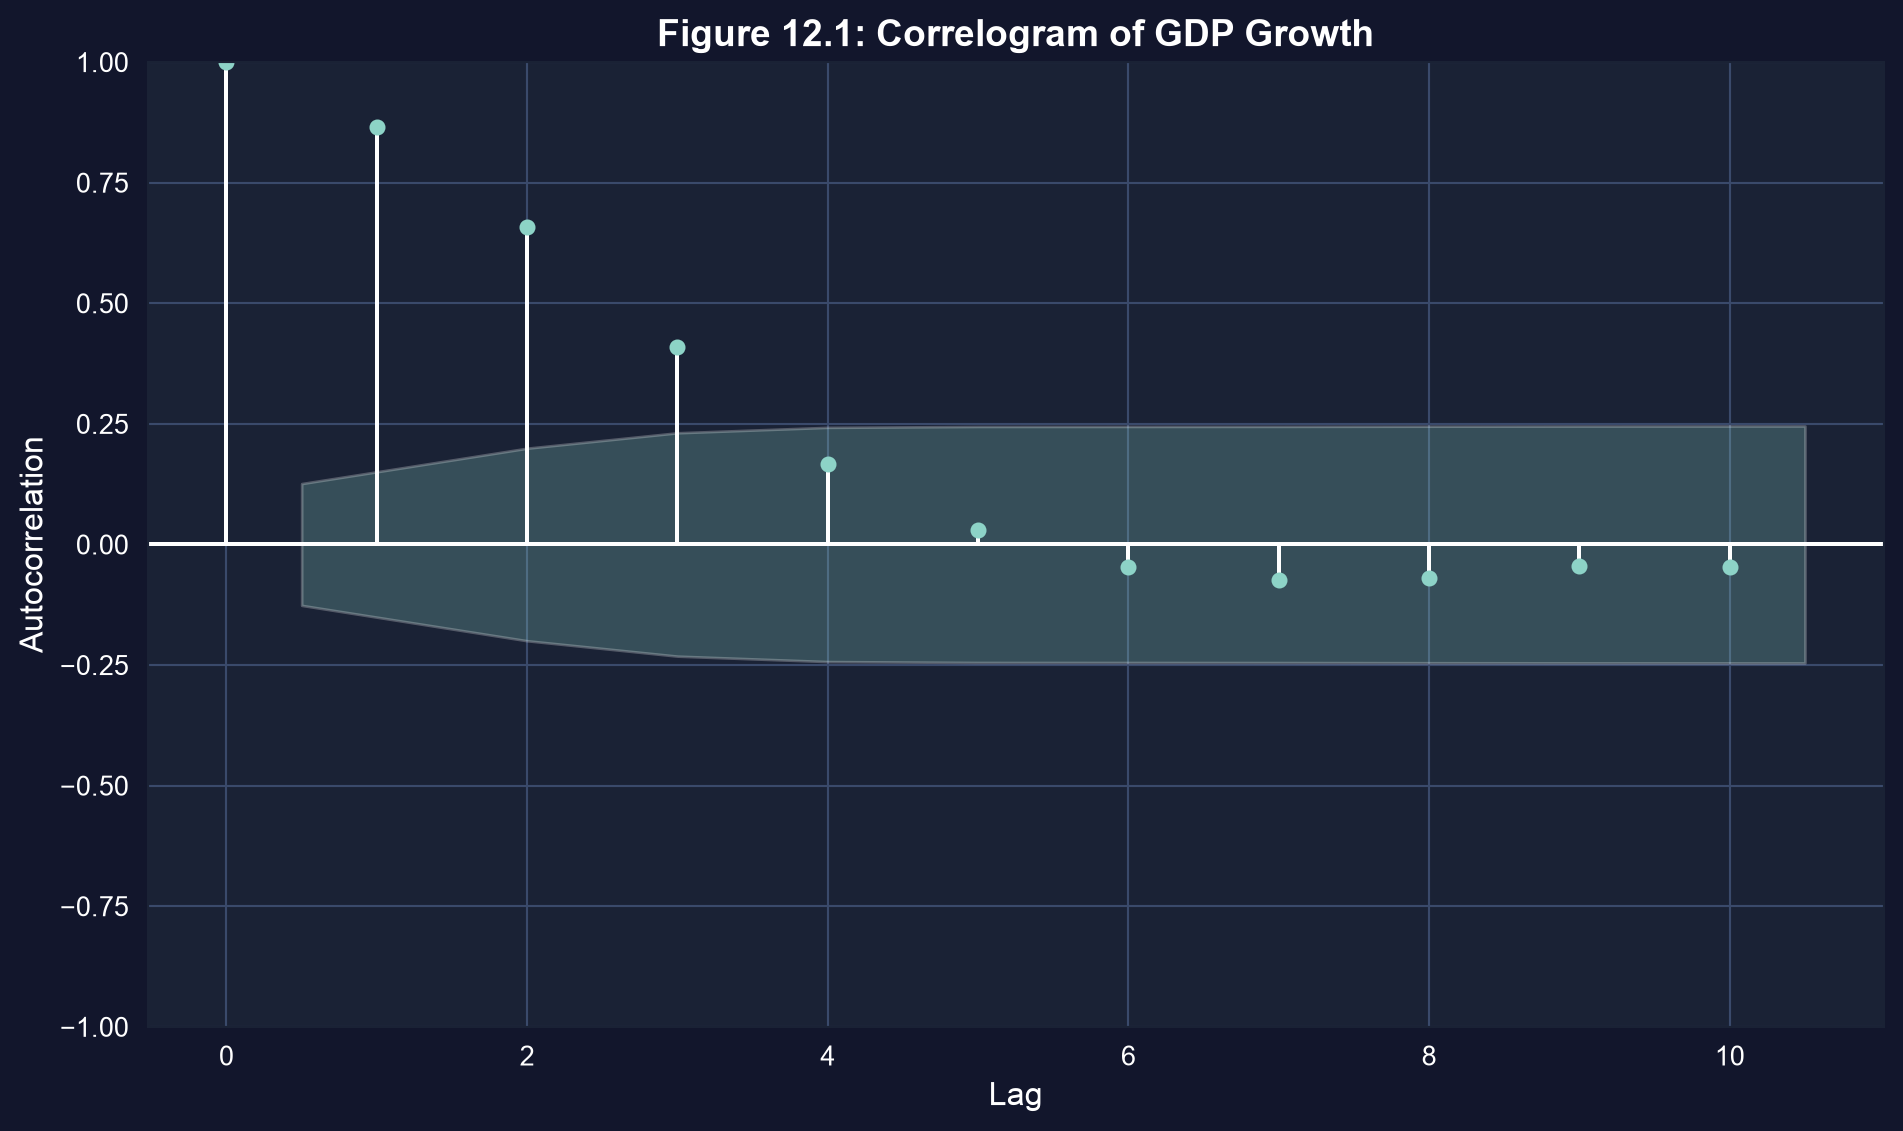
Correlogram of U.S. real GDP-per-capita growth (T = 241). Bars outside the shaded band are statistically significant; a positive lag-1 value means fast-growth quarters cluster (each value is a year-over-year rate, so neighbors overlap).
Positive autocorrelation means consecutive observations aren’t independent — so there is less information than the sample count suggests.
import numpy as np # numerics
from statsmodels.regression.linear_model import OLS as smOLS # for HAC covariance
url = "https://raw.githubusercontent.com/quarcs-lab/data-open/master/AED/AED_REALGDPPC.DTA"
growth = pd.read_stata(url)["growth"].dropna() # real GDP-per-capita growth series
n = len(growth); m = int(0.75 * n**(1/3)) # Newey–West lag rule m ≈ 0.75·T^(1/3) → 4
se_default = growth.std() / np.sqrt(n) # assumes independence (too small here)
fit = smOLS(growth, np.ones(n)).fit( # intercept-only model = the mean growth rate
cov_type="HAC", cov_kwds={"maxlags": m}) # HAC-corrected covariance
print(se_default, fit.bse.iloc[0]) # HAC SE is LARGER — honest about serial dependenceThe same fitted line answers two different questions, with very different precision:
\[\underbrace{E[Y\mid X^*]}_{\text{average outcome}} \qquad\text{vs.}\qquad \underbrace{Y\mid X^* = E[Y\mid X^*] + u^*}_{\text{one individual outcome}}\]
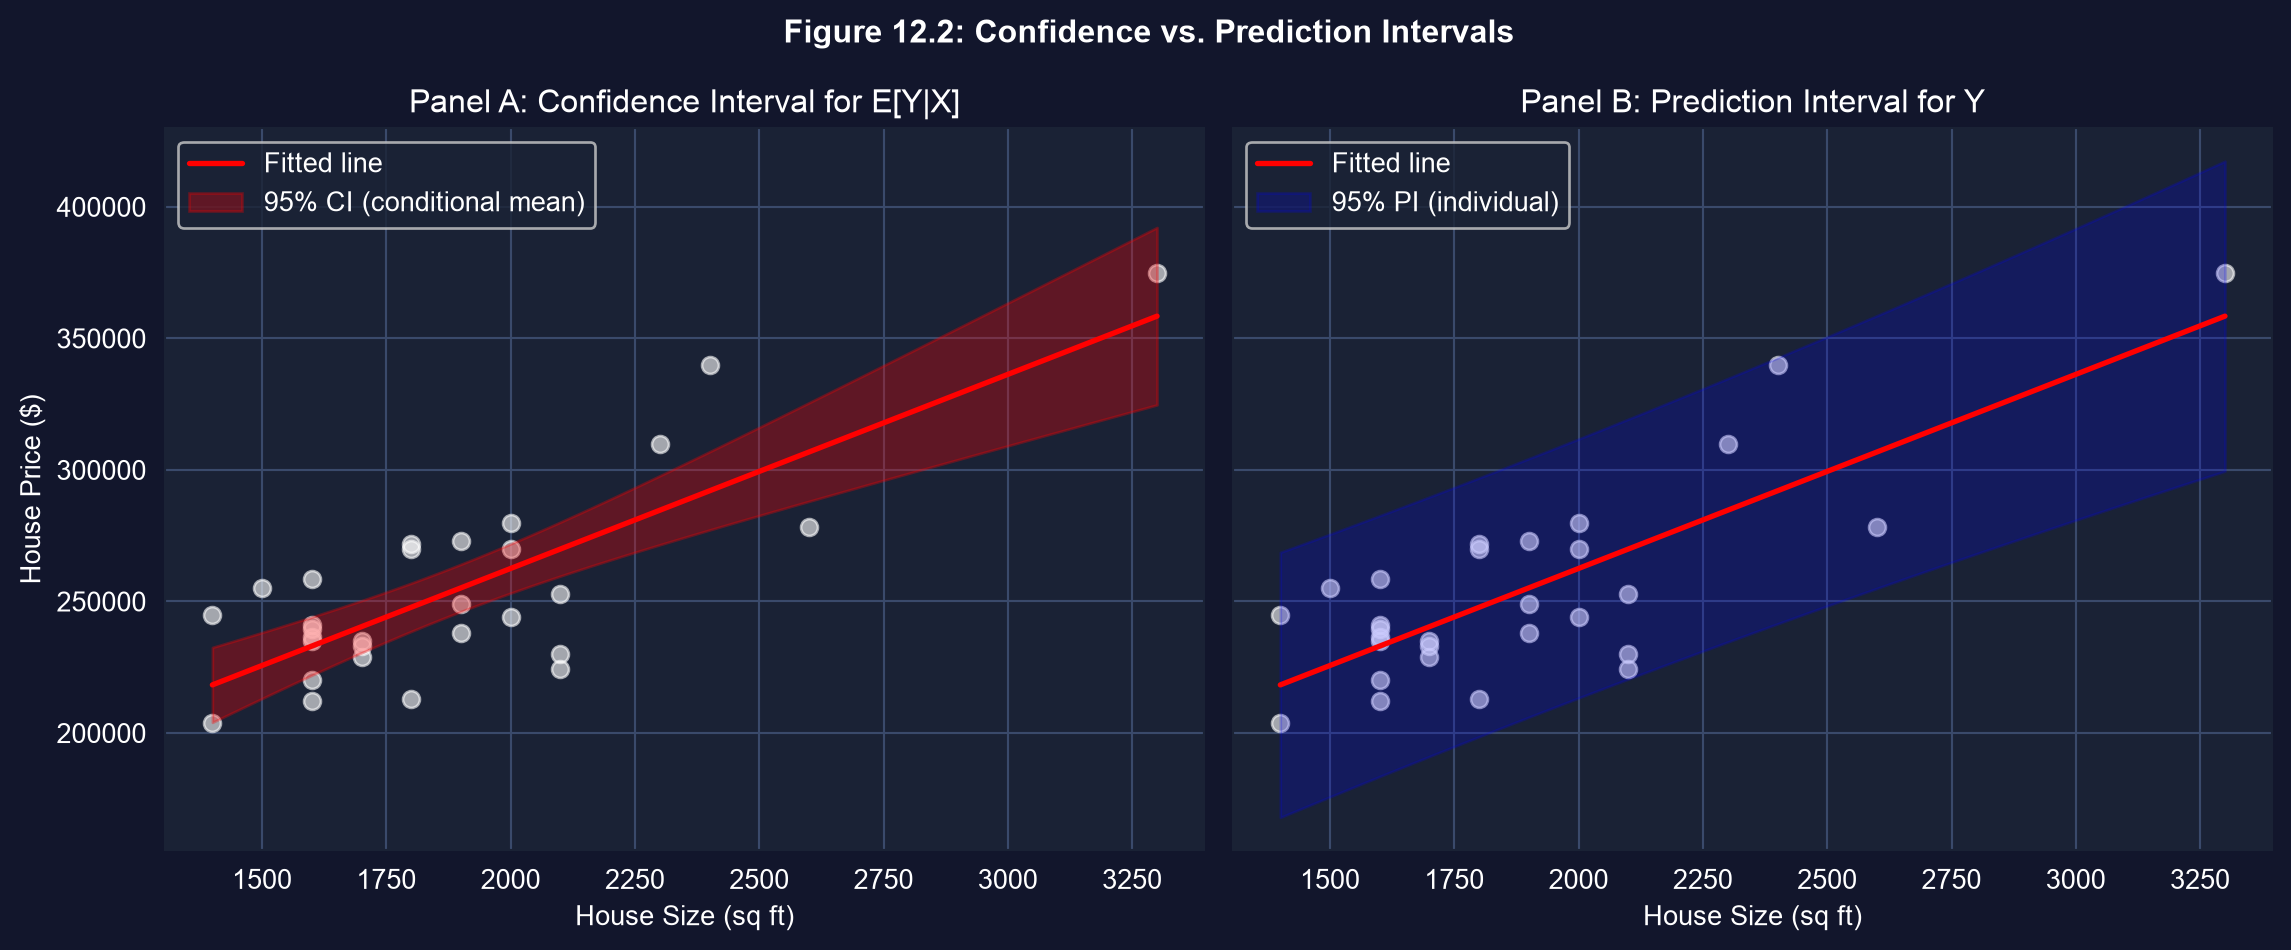
The individual carries an extra, irreducible term \(u^*\) — the “\(1+\)” under the square root that never shrinks, even with infinite data.
from scipy import stats # t-distribution for interval widths
fit = pf.feols("price ~ size", data=data) # simple regression on size
x = data["size"].values; xbar = x.mean() # ingredients for the SE formulas
Sxx = ((x - xbar)**2).sum(); n = len(data)
s_e = np.sqrt((fit._u_hat**2).sum() / (n - 2)) # RMSE — the irreducible noise floor s_e
pred = fit.predict(newdata=pd.DataFrame({"size": [2000]}))[0] # point prediction at 2000 sq ft
t = stats.t.ppf(0.975, n - 2) # 95% critical value, df = n − 2
se_cm = s_e * np.sqrt(1/n + (2000 - xbar)**2 / Sxx) # conditional-MEAN SE
se_pi = s_e * np.sqrt(1 + 1/n + (2000 - xbar)**2 / Sxx) # INDIVIDUAL SE (note the leading 1)
print(pred, t*se_cm, t*se_pi) # point, CI half-width, PI half-widthPanel A: the narrow 95% CI for the average 2{,}000-sq-ft price. Panel B: the much wider 95% PI for one house. The funnel widens away from the data’s center.
For a 2{,}000-sq-ft house: point ≈ $263k · CI ≈ [$253k, $272k] · PI ≈ [$213k, $312k]. More data narrows the CI, barely touches the PI.
No robust SE repairs a bad sample. Always ask whether the sample represents the population you care about.
Act III · The resolution
Under the classical assumptions, OLS is BLUE (Best Linear Unbiased Estimator) by the Gauss–Markov theorem. When homoskedasticity or independence fails, OLS stays unbiased but is no longer most efficient — feasible GLS (FGLS) can be tighter.
In practice, most applied work keeps OLS with robust SEs: the efficiency loss is small, and a misspecified GLS weighting model can do more harm than good.
Default to OLS + robust SEs. Reach for FGLS only when you trust the error-variance model.
Instead of trusting a normal approximation, resample the data with replacement ~1,000 times, re-estimate each time, and read the 2.5th and 97.5th percentiles of the resulting coefficients as a 95% CI.
The bootstrap assumes no normality and works for awkward statistics — ideal for small samples like these \(n = 29\) houses.
| Decision | \(H_0\) true | \(H_0\) false |
|---|---|---|
| Reject \(H_0\) | Type I error (\(\alpha\)) | Correct — power |
| Don’t reject | Correct | Type II error (\(\beta\)) |
Tightening \(\alpha\) cuts false positives but raises \(\beta\) — fewer real effects detected. Power \(= 1-\beta\) is the probability of catching a true effect.
With only \(n=29\), the bedrooms test failed to reject (\(p=0.773\)) — likely a Type II miss, not proof of “no effect”.
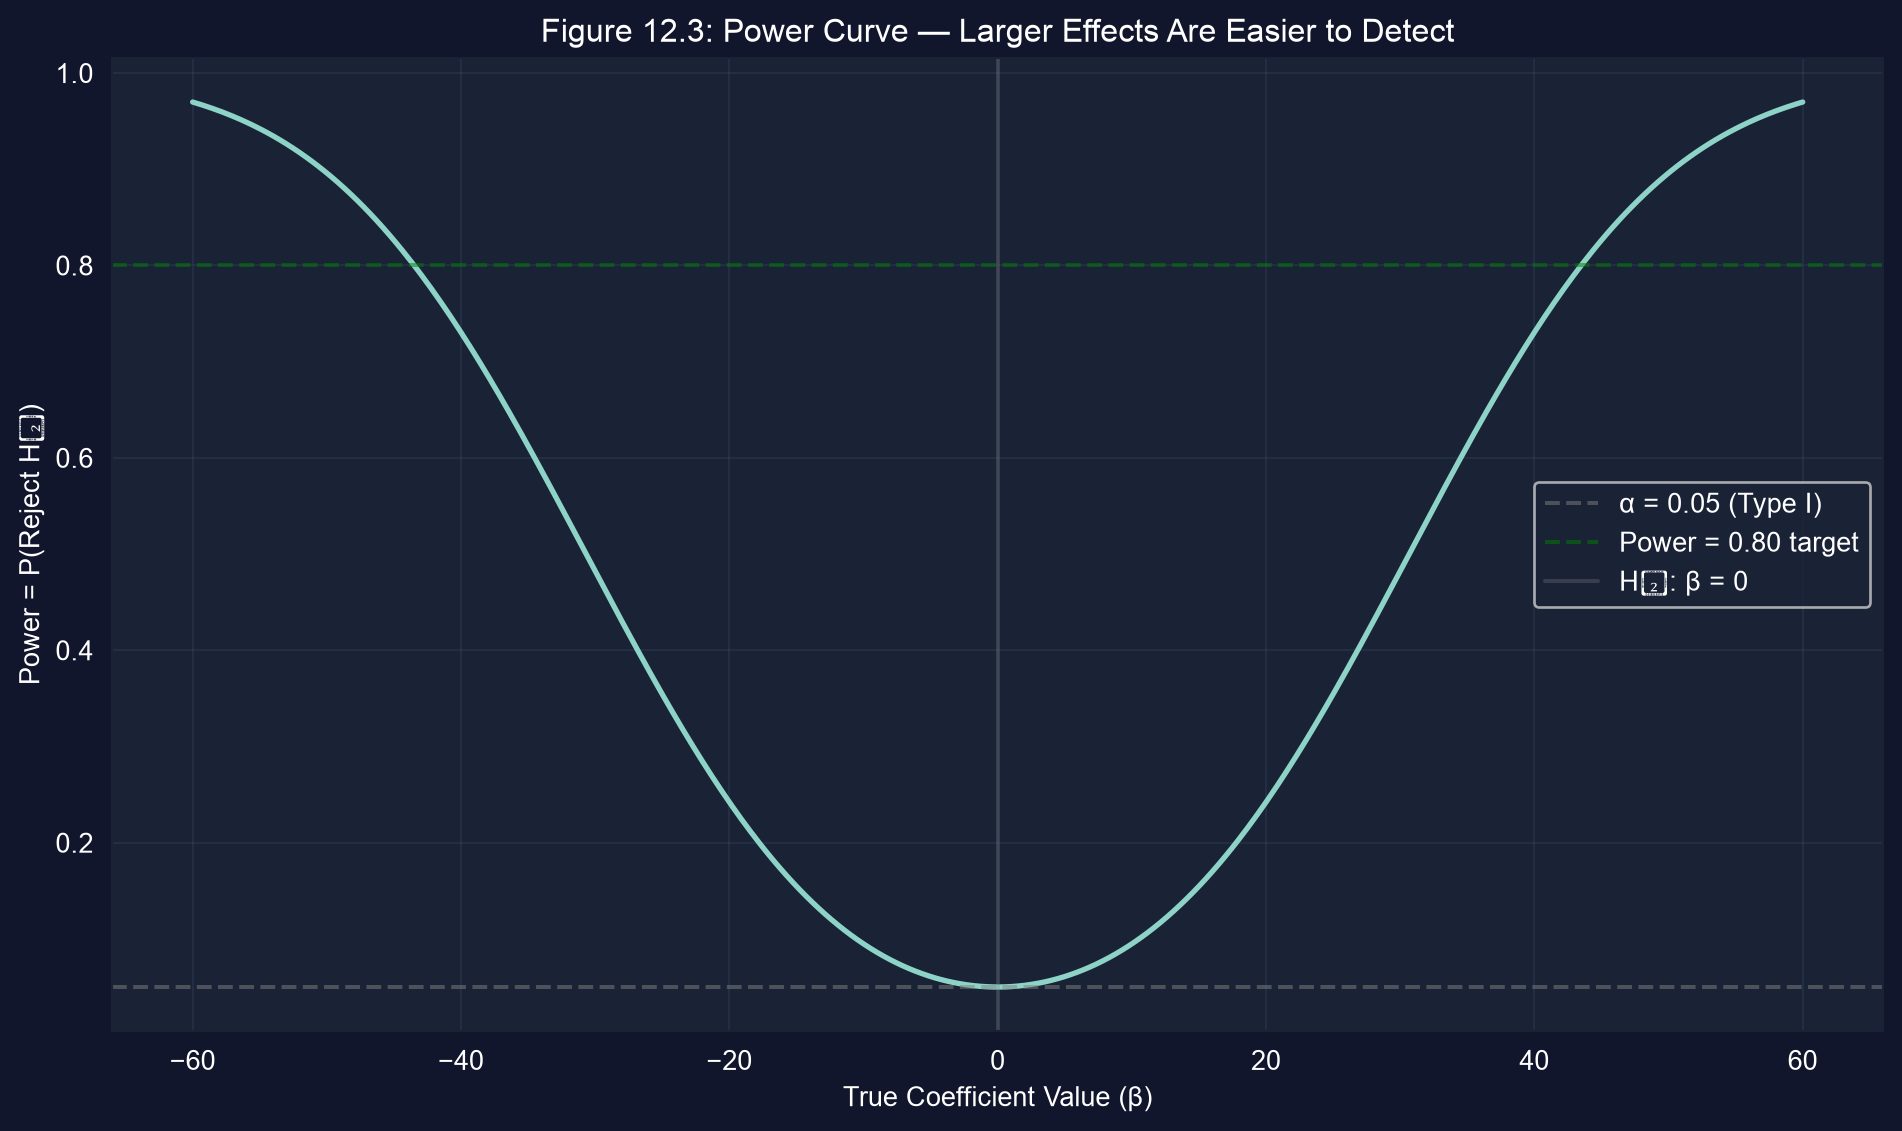
Power curve at \(n=30\), SE \(=15\), \(\alpha=0.05\). Power equals \(\alpha\) at \(\beta=0\) and climbs toward 1 as the true effect grows.
from scipy import stats; import numpy as np # distributions + numerics
alpha, se, n = 0.05, 15, 30 # significance, hypothetical SE, sample size
tcrit = stats.t.ppf(1 - alpha/2, df=n - 1) # two-sided critical value
betas = np.linspace(-60, 60, 500) # grid of true effect sizes to evaluate
ncp = betas / se # non-centrality: effect in SE units
power = 1 - (stats.t.cdf(tcrit - ncp, n - 1) # P(reject | true β) under the alternative
- stats.t.cdf(-tcrit - ncp, n - 1))
# here power reaches the 0.80 target only around |β| ≈ 43.5 — small effects need a bigger n
print(betas[(betas > 0) & (power >= 0.80)].min())vcov= keyword, or an intercept-only HAC fit for a time-series mean.