Nine questions, one toolkit
Act I · The tension
Regression describes — but can it explain why?
By now we can fit a line, add controls, and read a slope. But a slope is an association: schools with better-educated parents score higher; countries with stronger property rights are richer. Does the regressor cause the outcome?
This chapter works through nine case studies on real data. The first four push observational regression as far as it goes. The last four bring in a research design (an RCT, difference-in-differences, a regression discontinuity, or an instrumental variable) that turns a slope into a causal claim.
The question running through every case is the same: where does the variation in the regressor come from?
Nine case files — click any case to jump to it
| Case | Question | Method | Headline result |
|---|---|---|---|
| 13.1 | What drives school test scores? | Multiple regression | +73.9 API points per year of parent ed. |
| 13.2 | Constant returns to scale? | Cobb–Douglas, HAC SEs | elasticities sum to 1.04 (p = 0.636) |
| 13.3 | Why did the Phillips curve break? | Omitted variables bias | +0.265 = −0.128 + 1.146 × 0.343 |
| 13.4 | What determines fuel economy? | Log-log, clustered SEs | weight elasticity −0.56 |
| 13.5 | Does cost-sharing cut spending? | RCT | 95% plan: −$1,108 vs free care |
| 13.6 | Did free care help child nutrition? | Diff-in-differences | +0.52 weight-for-age z-units |
| 13.7 | Does holding a seat help a party? | Regression discontinuity | +4.8 percentage points |
| 13.8 | Do institutions cause prosperity? | Instrumental variables | IV 0.94 vs OLS 0.52 |
| 13.9 | How does raw data become final data? | Read, merge, clean | — |
The climb: from description to causation
- Describe (13.1, 13.4): conditional associations, with controls and honest SEs
- Impose structure (13.2): a theory-based functional form makes the coefficients interpretable as elasticities and gives a testable restriction
- Diagnose bias (13.3): the omitted-variables formula tells us how much a missing regressor distorts a slope
- Design for causation (13.5–13.8): an RCT, DiD, RD or IV builds a credible counterfactual
Controls can only close the confounders we measure. A design closes the ones we don’t.
One estimator, three ways to be honest about uncertainty
| SE type | pyfixest syntax | Use when errors are… | Cases |
|---|---|---|---|
| Heteroskedasticity-robust | vcov="HC1" |
independent, unequal variance (cross-sections) | 13.1, 13.7, 13.8 |
| HAC (Newey–West) | vcov="NW" + time_id, lag |
autocorrelated over time (time series) | 13.2, 13.3 |
| Cluster-robust | vcov={"CRV1": "group"} |
correlated within groups | 13.4 (maker), 13.5 (family), 13.6 (community) |
The coefficient is identical under all three. Only the standard errors, and therefore the \(t\)-statistics, \(p\)-values and confidence intervals, change.
Match the standard error to how the data were generated. In 13.4, clustering makes the SEs 6–9× larger than HC1.
Five ideas anchor this chapter
- Production function: inputs \(\to\) output. Cobb–Douglas \(Q = AK^{\beta_2}L^{\beta_3}\) is linear in logs
- Constant returns to scale: doubling every input doubles output, i.e. \(\beta_2 + \beta_3 = 1\)
- Selection bias: treated and untreated units differ before treatment; random assignment removes the difference
- Parallel trends: the DiD assumption that, without treatment, both groups would have moved together
- Counterfactual: the unobserved “what would have happened”; every design imputes it differently
A credible causal estimate is not a better regression. It is a better source of variation.
Act II-a · Observational regression, pushed to its limits
Cases 13.1–13.4 · describe, structure, diagnose
Case 13.1 · What drives school performance?
Multiple regression · cross-section · HC1 standard errors
The question: family background or school resources?
Data. 807 California high schools, 1999 (AED_API99.DTA). The Academic Performance Index (API) runs from 200 to 1000; the state target is 800.
| Variable | Meaning |
|---|---|
api99 |
Academic Performance Index, 1999 (outcome) |
edparent |
average parent education, in years |
meals |
% of students in the free / reduced-price lunch program (poverty proxy) |
englearn |
% English learners |
yearround |
1 if the school runs a multi-track year-round calendar |
credteach, emerteach |
% of teachers with full / emergency credentials |
Every regressor is the result of choices by families, districts or teachers, so expect associations, not causal effects.
Most schools fall well short of the 800 target
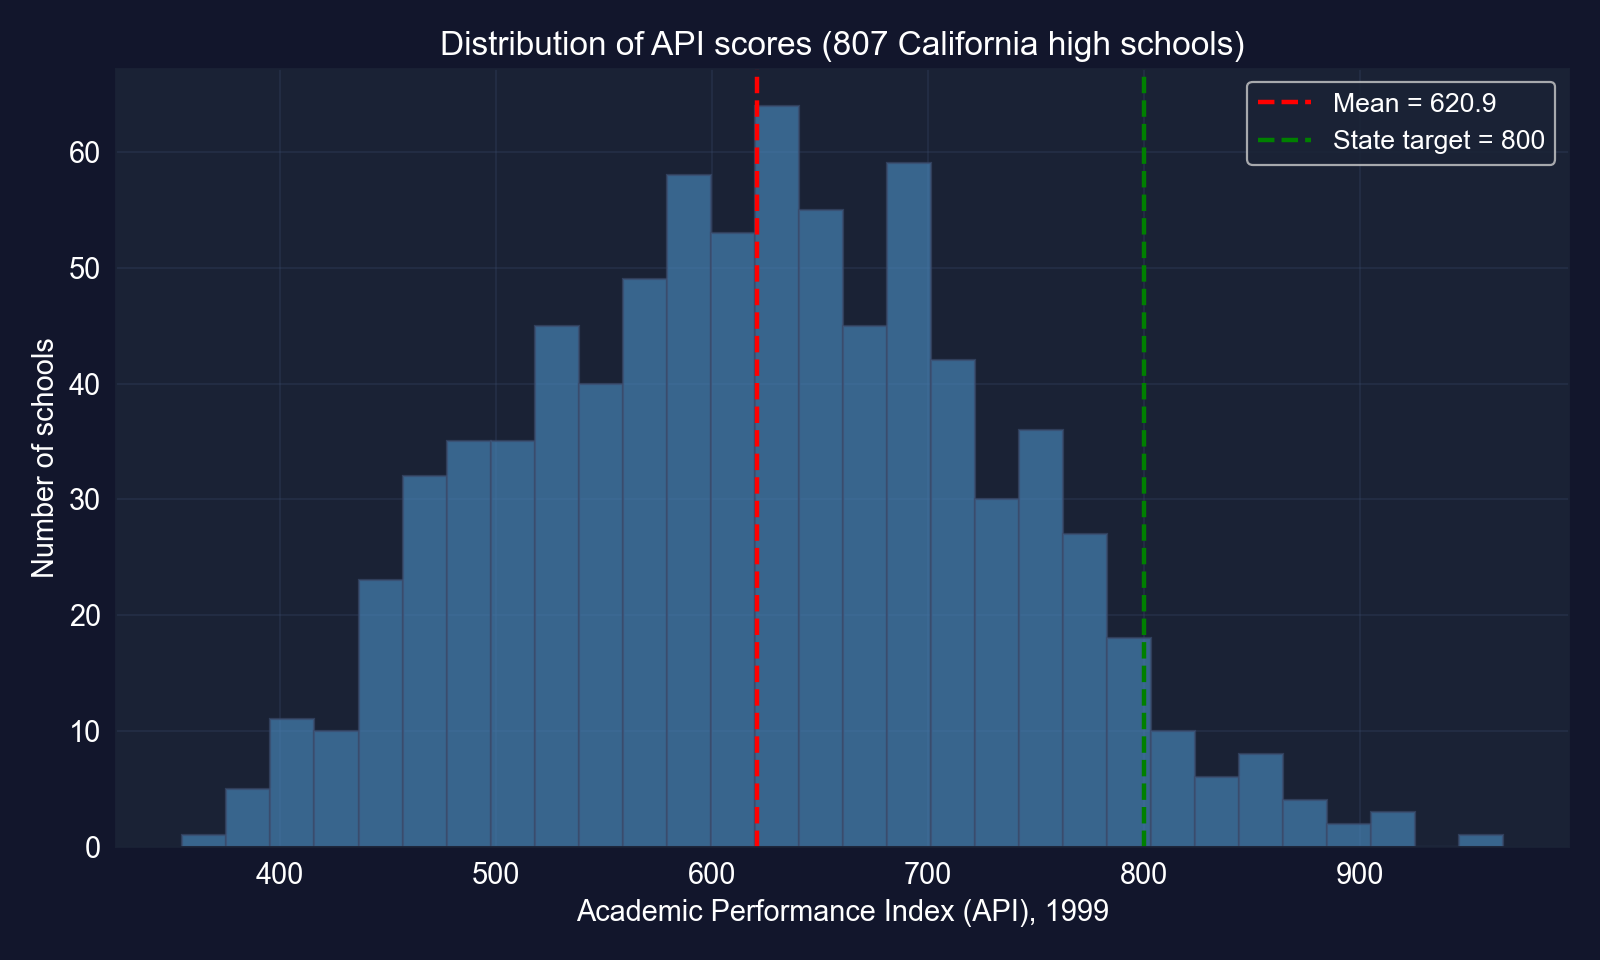
Distribution of 1999 API scores across 807 high schools. Red: mean (620.9); green: the state target of 800.
The mean school scores about 621, and only 4.8% of schools reach 800, so the outcome varies enough to explain.
Code: load the data and fit the bivariate regression
!pip install -q pyfixest                    # pyfixest is not preinstalled in Colab
import pandas as pd                         # tabular data
import pyfixest as pf                       # OLS / IV with R-style formulas
# 807 California high schools, 1999
url = "https://raw.githubusercontent.com/quarcs-lab/data-open/master/AED/AED_API99.DTA"
data_api = pd.read_stata(url)               # read the Stata file into a DataFrame
vars_api = ["api99", "edparent", "meals", "englearn", "yearround", "credteach", "emerteach"]
data_api[vars_api].describe()               # summary statistics for the 7 variables
fit_api_biv = pf.feols("api99 ~ edparent", data=data_api, vcov="HC1")  # bivariate OLS
fit_api_biv.summary() # intercept, slope, robust SE, R²Output: one predictor explains 83.5% of the variation
| Coef. | SE | \(t\) | |
|---|---|---|---|
| Intercept | −400.314 | 15.993 | −25.03 |
edparent |
79.529 | 1.219 | 65.25 |
N = 807 · HC1 SEs · \(R^2 = 0.835\) · 95% CI for slope: [77.14, 81.92]
Each additional year of average parent education is associated with 79.5 more API points.
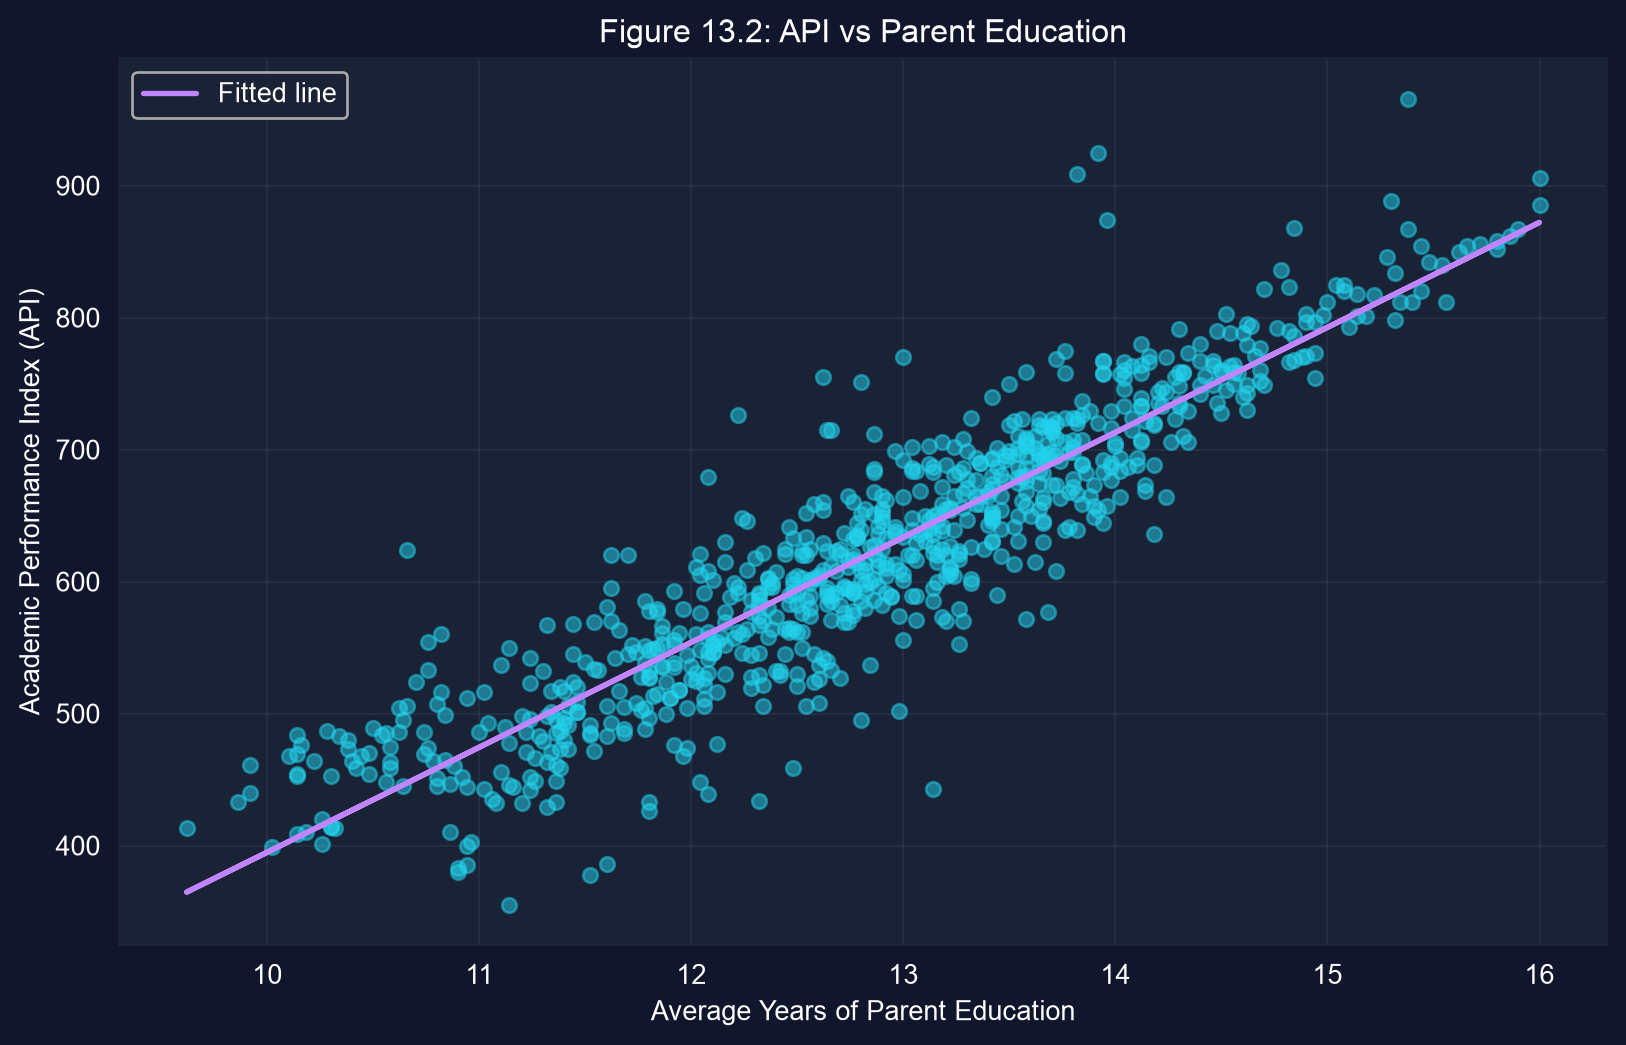
A huge, precise slope, but edparent also stands in for income, language and neighbourhood. Next, we add controls.
Code: are the regressors themselves correlated?
# continues from the previous block (data_api, vars_api already defined)
import seaborn as sns                       # statistical plotting (heatmap)
import matplotlib.pyplot as plt             # figure handling
corr_matrix = data_api[vars_api].corr()     # pairwise Pearson correlations
print(corr_matrix.round(2))                 # numeric matrix, 2 decimals
sns.heatmap(corr_matrix, annot=True, fmt=".2f", cmap="coolwarm", center=0)  # coloured matrix
plt.show() # display the heatmapBefore adding controls, check how strongly they move together. That decides how precisely their separate effects can be estimated.
Output: the regressors are strongly correlated
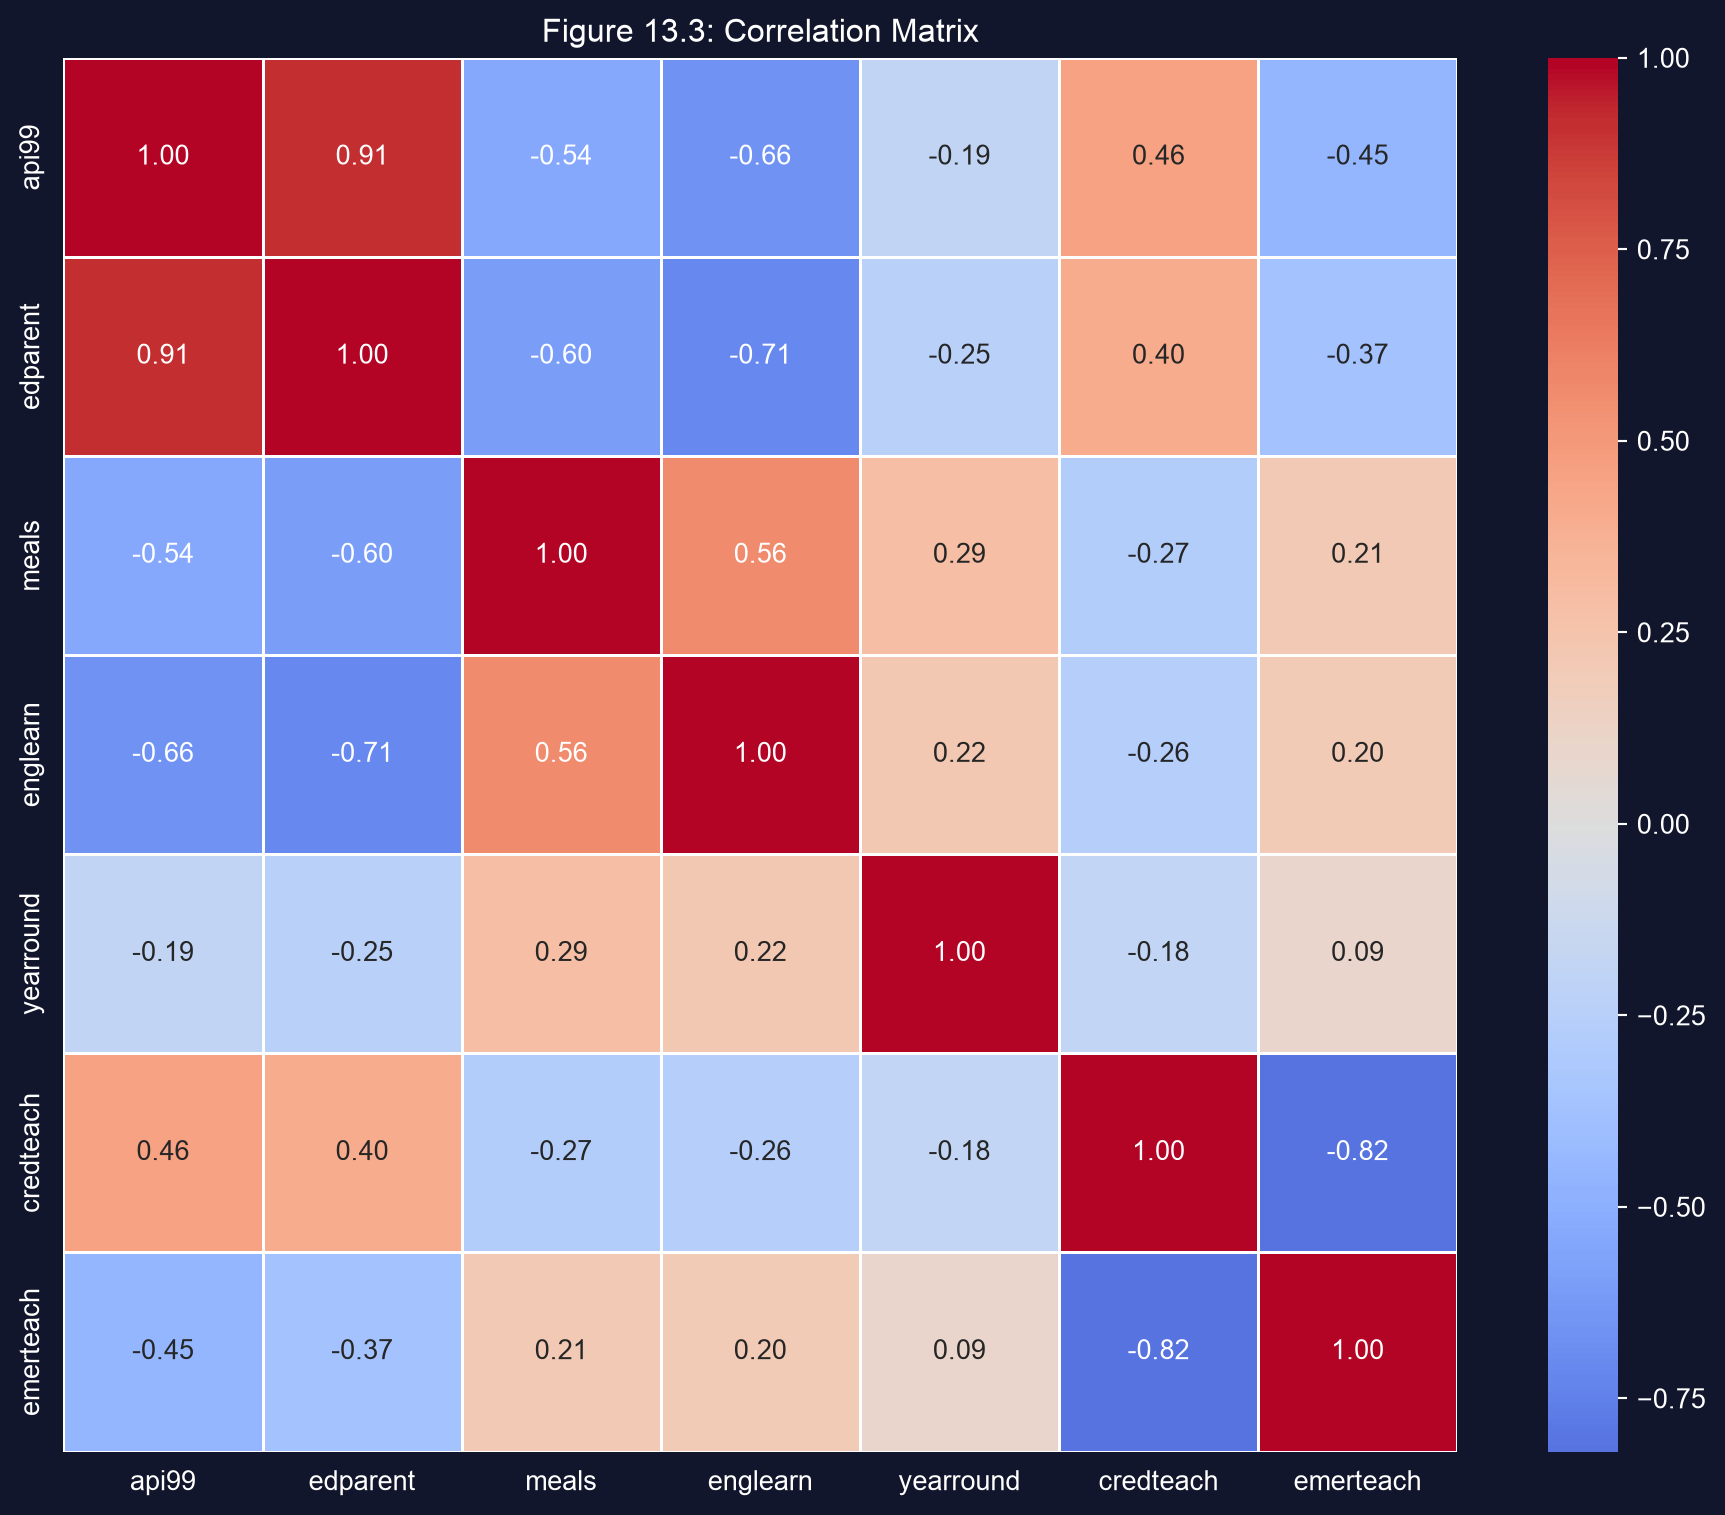
| Pair | \(r\) |
|---|---|
api99–edparent |
0.91 |
api99–englearn |
−0.66 |
api99–meals |
−0.54 |
edparent–englearn |
−0.71 |
edparent–meals |
−0.60 |
credteach–emerteach |
−0.82 |
Parent education, poverty and English learners largely describe the same schools, so their separate effects will be hard to pull apart.
Code: the multiple regression
# continues from the previous block
fit_api_mult = pf.feols("api99 ~ edparent + meals + englearn + yearround + credteach + emerteach",
                        data=data_api, vcov="HC1")   # six regressors, robust SEs
fit_api_mult.summary()                               # full coefficient table
coef_df = pd.DataFrame({                             # compact table of results
    "Coefficient": fit_api_mult.coef(),              # point estimates
    "Std Error": fit_api_mult.se(),                  # HC1 standard errors
    "t-stat": fit_api_mult.tstat(),                  # coefficient / SE
    "p-value": fit_api_mult.pvalue()                 # two-sided p-values
}).round(3)
print(coef_df)Output: parent education survives every control
| Variable | Coef. | SE | \(t\) | \(p\) | 95% CI |
|---|---|---|---|---|---|
| Intercept | −345.328 | 44.027 | −7.84 | < 0.001 | [−431.75, −258.91] |
edparent |
73.942 | 1.835 | 40.29 | < 0.001 | [70.34, 77.54] |
meals |
0.079 | 0.092 | 0.86 | 0.390 | [−0.10, 0.26] |
englearn |
−0.358 | 0.177 | −2.02 | 0.044 | [−0.71, −0.01] |
yearround |
25.956 | 10.752 | 2.41 | 0.016 | [4.85, 47.06] |
credteach |
0.387 | 0.349 | 1.11 | 0.268 | [−0.30, 1.07] |
emerteach |
−1.470 | 0.358 | −4.11 | < 0.001 | [−2.17, −0.77] |
N = 807 · HC1 SEs · \(R^2 = 0.853\) (vs 0.835 with edparent alone)
With five controls, the parent-education slope falls only from 79.5 to 73.9, and the controls add just 1.8 points of \(R^2\).
Reading the coefficients (1): what “holding constant” means
edparent73.9: comparing schools with the same poverty, language, calendar and credential mix, one more year of parent education goes with 73.9 more API pointsmeals0.08 (\(p = 0.39\)): on its own, poverty correlates \(-0.54\) with API, but once parent education is held fixed it adds no separate predictive information- That does not mean poverty is irrelevant: it overlaps heavily with
edparent(\(r = -0.60\)), so the data cannot separate the two
A partial effect answers “compared with otherwise-similar schools…”, and the answer depends on which variables we hold fixed.
Reading the coefficients (2): collinearity and sign changes
emerteach−1.47 per percentage point: more emergency-credentialed teachers, lower scores (\(p < 0.001\))- Its mirror image
credteachis insignificant (\(p = 0.27\)): the two are correlated \(-0.82\), so they compete for the same variation yearround+26.0 (\(p = 0.016\)): year-round schools score 26 points higher conditional on the rest, although the simple correlation is negative (\(-0.19\))
Collinear regressors share credit unpredictably, and conditioning can flip a sign, which previews the omitted-variables lesson of 13.3.
Why these are associations, not causal effects
What the regression holds fixed
- the six measured characteristics
- nothing else
What it cannot hold fixed
- family income, home resources, private tutoring
- which families choose which districts
- how teachers sort toward easier schools
edparent is a proxy for a whole bundle of advantages, so 73.9 is a conditional association, not “the effect of sending parents back to school”.
Case 13.2 · Does doubling inputs double output?
Cobb–Douglas production function · log-log model · HAC standard errors
The question: returns to scale in U.S. manufacturing
The Cobb–Douglas production function maps capital \(K\) and labor \(L\) into output \(Q\):
\[Q = A\,K^{\beta_2}\,L^{\beta_3}\]
| If \(\beta_2 + \beta_3\) is… | Returns to scale | Doubling both inputs… |
|---|---|---|
| \(= 1\) | constant | doubles output |
| \(> 1\) | increasing | more than doubles output |
| \(< 1\) | decreasing | less than doubles output |
Returns to scale come down to a single number, \(\beta_2 + \beta_3\), which we can estimate and test.
Taking logs turns a multiplicative model into a linear regression
\[\ln Q = \underbrace{\ln A}_{\beta_1} + \beta_2 \ln K + \beta_3 \ln L + u\]
The model is now linear in its parameters, so OLS applies. Each slope is an elasticity: \(\beta_2 = \partial \ln Q / \partial \ln K\), the percentage change in output per 1% change in capital, holding labor fixed.
Logs do two jobs here: they make the model estimable by OLS, and they make the coefficients unit-free elasticities.
The data: 24 years of output, capital and labor (1899 = 100)
| Index in 1922 | Value | Growth since 1899 |
|---|---|---|
| Output \(Q\) | 240 | 2.4× |
| Capital \(K\) | 431 | 4.3× |
| Labor \(L\) | 161 | 1.6× |
Why HAC standard errors?
- Time series: booms, recessions and technology shocks persist, so errors are autocorrelated
- Volatility differs across periods (e.g. World War I), so errors are heteroskedastic
- Newey–West (HAC) SEs allow for both; the chapter uses 3 lags
Capital grew much faster than output or labor. How the regression splits output growth between the two inputs is the elasticity question.
Code: log-transform and estimate with Newey–West SEs
!pip install -q pyfixest                    # pyfixest is not preinstalled in Colab
import numpy as np                          # np.log for the transform
import pandas as pd                         # tabular data
import pyfixest as pf                       # OLS with R-style formulas
url = "https://raw.githubusercontent.com/quarcs-lab/data-open/master/AED/AED_COBBDOUGLAS.DTA"
data_cobb = pd.read_stata(url)              # 24 years of U.S. manufacturing, 1899–1922
data_cobb["lnq"] = np.log(data_cobb["q"])   # log output
data_cobb["lnk"] = np.log(data_cobb["k"])   # log capital
data_cobb["lnl"] = np.log(data_cobb["l"])   # log labor
data_cobb["_time"] = range(len(data_cobb))  # time index required by Newey–West
fit_cobb = pf.feols("lnq ~ lnk + lnl", data=data_cobb,
                    vcov="NW", vcov_kwargs={"time_id": "_time", "lag": 3})  # HAC SEs, 3 lags
fit_cobb.summary() # elasticities, HAC SEs, R²Output: labor’s elasticity is about 3.5× capital’s
| Variable | Coef. | HAC SE | \(t\) | \(p\) | 95% CI |
|---|---|---|---|---|---|
| Intercept | −0.177 | 0.398 | −0.45 | 0.660 | [−1.000, 0.646] |
lnk (capital) |
0.233 | 0.063 | 3.72 | 0.001 | [0.103, 0.363] |
lnl (labor) |
0.807 | 0.135 | 6.00 | < 0.001 | [0.529, 1.086] |
N = 24 · Newey–West SEs, 3 lags · \(R^2 = 0.957\)
- Holding labor fixed, a 1% increase in capital is associated with ≈ 0.23% more output
- Holding capital fixed, a 1% increase in labor is associated with ≈ 0.81% more output
Early-1900s manufacturing was labor-driven: the labor elasticity (0.81) is about 3.5 times the capital elasticity (0.23).
Code: test constant returns with the HAC covariance matrix
# continues from the previous block
from scipy import stats                     # F distribution for the p-value
R = np.array([0.0, 1.0, 1.0])               # restriction vector: picks out β_K + β_L
b_hat = fit_cobb.coef().values              # coefficients [Intercept, lnk, lnl]
V_hac = fit_cobb._vcov                      # Newey–West (HAC) covariance matrix
df_resid = fit_cobb._N - len(b_hat)         # residual degrees of freedom: 24 − 3 = 21
f_stat = (R @ b_hat - 1.0)**2 / (R @ V_hac @ R)   # Wald statistic for H0: β_K + β_L = 1
p_value = 1 - stats.f.cdf(f_stat, 1, df_resid)    # p-value from F(1, 21)
print(R @ b_hat, f_stat, p_value) # estimated sum, F, pThe test reuses the HAC covariance matrix, so the inference matches the HAC standard errors on the previous slide.
Output: the data are consistent with constant returns to scale
| Quantity | Value |
|---|---|
| \(\hat\beta_K + \hat\beta_L\) | 1.040 |
| HAC SE of the sum | 0.084 |
| \(F(1, 21)\) | 0.23 |
| \(p\)-value | 0.636 |
| 95% CI for the sum | [0.87, 1.21] |
- \(H_0: \beta_K + \beta_L = 1\) is not rejected at any conventional level
- But the 95% interval spans 0.87 to 1.21: mild decreasing or increasing returns also fit the data
- “Fail to reject” is not “prove”. With 24 years, the test has limited power
The estimate (1.04) is close to 1 and statistically indistinguishable from it, which supports constant returns without proving them.
The fitted model tracks output across 24 years
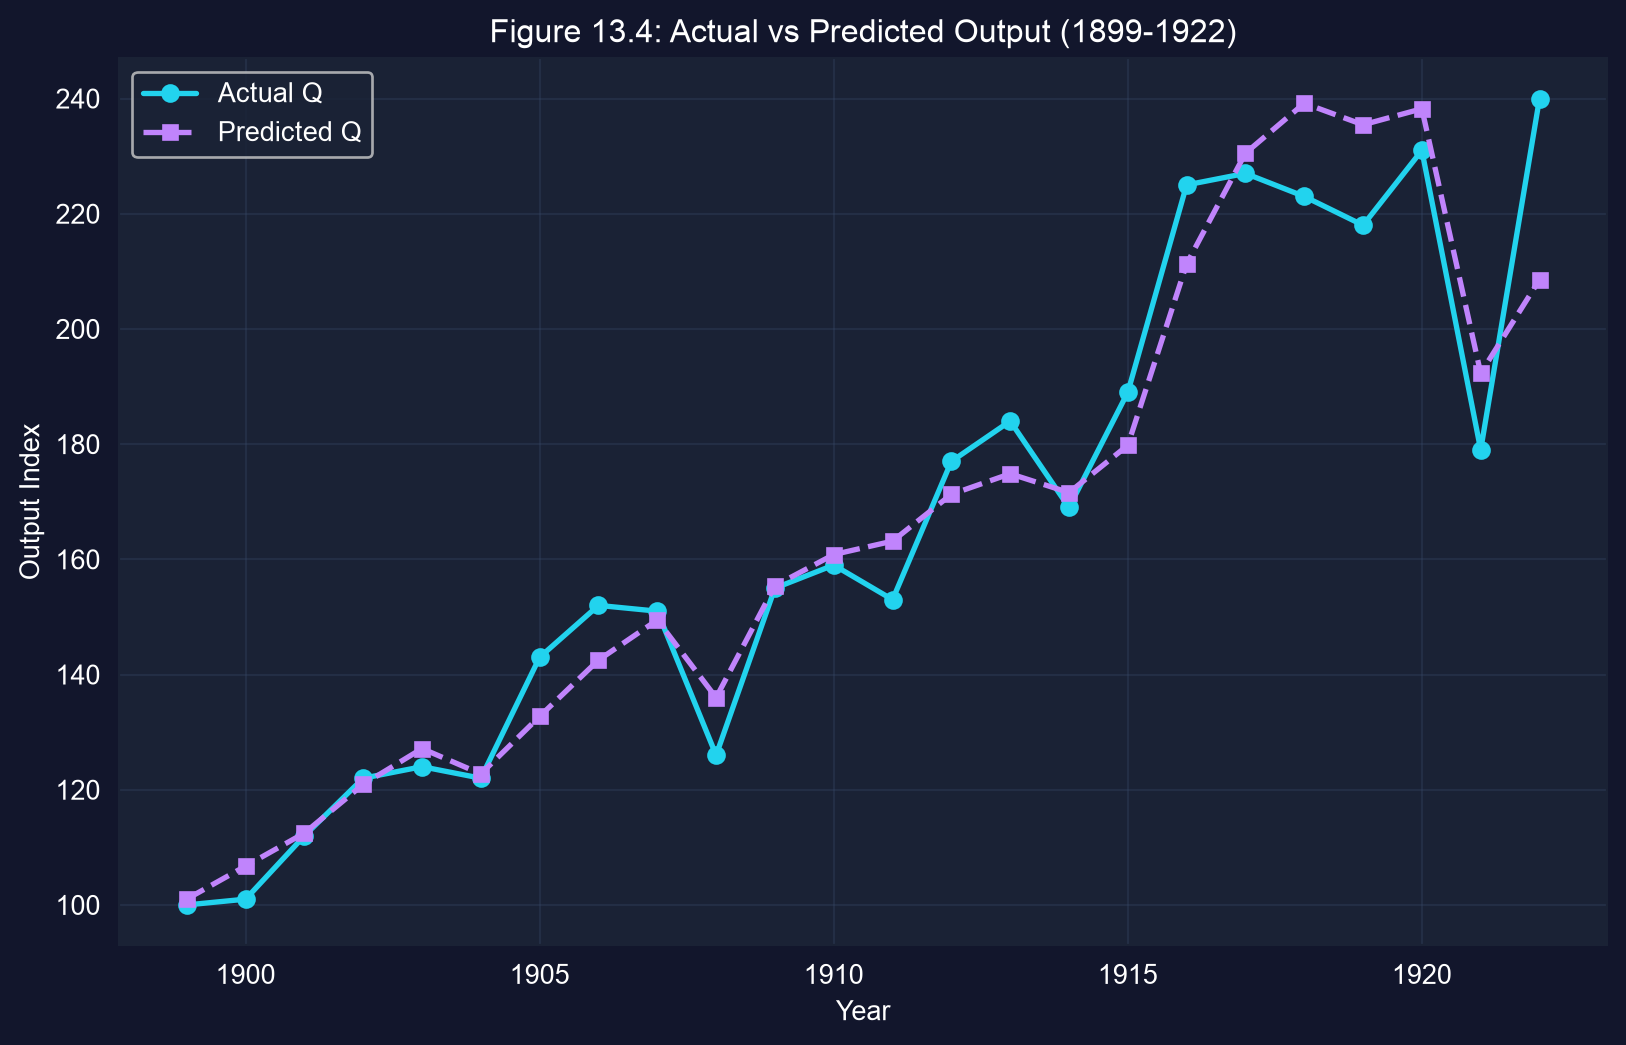
Actual vs predicted output, 1899–1922. Predictions are \(e^{\widehat{\ln Q}}\) multiplied by the retransformation factor \(e^{\hat\sigma^2/2}\).
To predict levels from a log model, exponentiate and rescale by \(e^{\hat\sigma^2/2}\); here \(\hat\sigma = 0.058\), so the correction is tiny (×1.0017).
Caveats: why 24 trending observations call for humility
- Trending series: \(Q\), \(K\) and \(L\) all rise over time, so part of the \(R^2 = 0.957\) is a shared trend, not a production relationship (the spurious-regression worry)
- Technology held constant: \(A\) is a single constant; omitted technical progress that grew with capital would load onto \(\hat\beta_K\)
- Small sample: 24 points, and HAC SEs are themselves noisy with so few years
- Aggregation: one “representative” manufacturing sector stands in for many industries
The CRS test is informative, but treat the separate elasticities as fragile.
Case 13.3 · Why did the Phillips curve break?
Omitted variables bias · time series · HAC standard errors
The question: is there a stable unemployment–inflation trade-off?
- Phillips (1958): lower unemployment went with higher wage inflation, so policymakers saw a menu: choose a point on the curve
- 1970s stagflation: high unemployment and high inflation together, and the menu fell apart
- Friedman–Phelps: the curve shifts with expected inflation; leave expectations out and the curve is misspecified
\[\text{Inflation}_t = \beta_1 + \beta_2\,\text{Urate}_t + \beta_3\,\text{ExpInflation}_t + u_t\]
If expected inflation belongs in the model, omitting it is not harmless. It can distort, even reverse, the unemployment slope.
Code: the pre-1970 Phillips curve
!pip install -q pyfixest                    # pyfixest is not preinstalled in Colab
import pandas as pd                         # tabular data
import pyfixest as pf                       # OLS with R-style formulas
url = "https://raw.githubusercontent.com/quarcs-lab/data-open/master/AED/AED_PHILLIPS.DTA"
data_phillips = pd.read_stata(url)          # U.S. annual data, 1949–2014
data_pre1970 = data_phillips[data_phillips["year"] < 1970].copy()   # 1949–1969
data_pre1970["_time"] = range(len(data_pre1970))                    # time index for HAC
fit_pre = pf.feols("inflgdp ~ urate", data=data_pre1970,
                   vcov="NW", vcov_kwargs={"time_id": "_time", "lag": 3})  # HAC, 3 lags
fit_pre.summary() # slope on unemploymentOutput: before 1970, the trade-off is there
| Coef. | HAC SE | \(p\) | |
|---|---|---|---|
| Intercept | 7.106 | 1.581 | < 0.001 |
urate |
−1.030 | 0.325 | 0.005 |
N = 21 (1949–1969) · NW, 3 lags · \(R^2 = 0.454\)
One percentage point more unemployment is associated with about 1.03 percentage points less inflation.
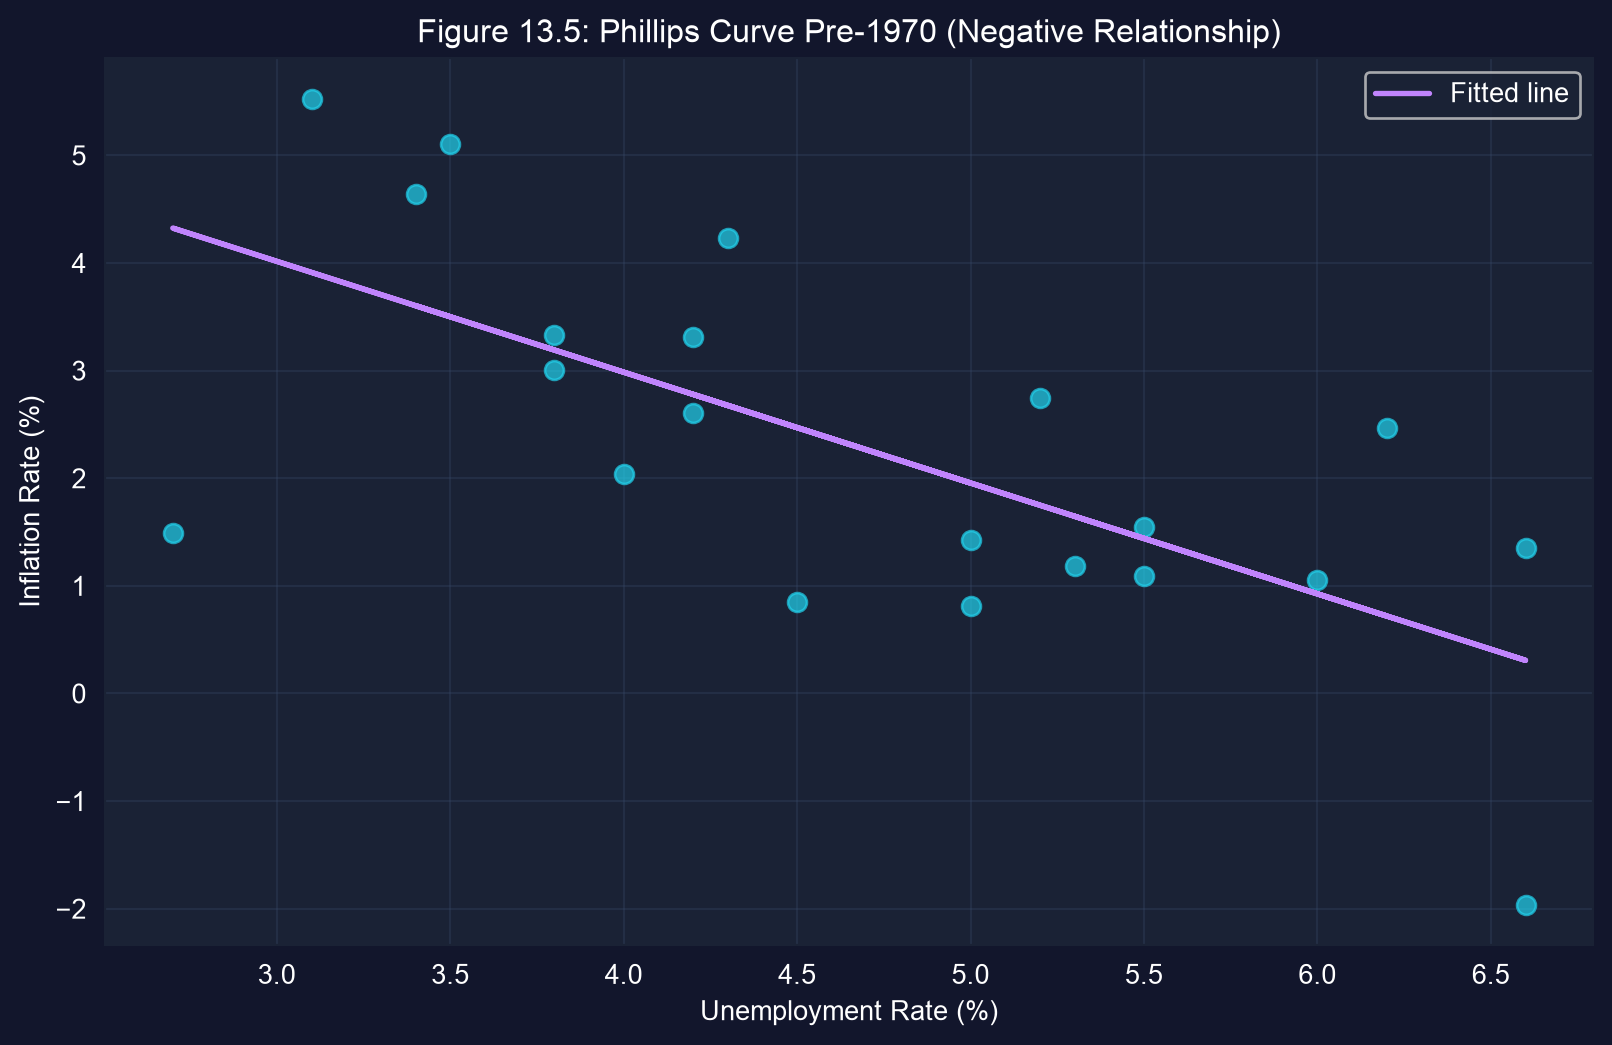
The classic downward-sloping Phillips curve: negative and statistically significant (\(p = 0.005\)).
Code: the same regression after 1970
# continues from the previous block
data_post1970 = data_phillips[data_phillips["year"] >= 1970].copy()  # 1970–2014
data_post1970["_time"] = range(len(data_post1970))                   # time index for HAC
fit_post = pf.feols("inflgdp ~ urate", data=data_post1970,
                    vcov="NW", vcov_kwargs={"time_id": "_time", "lag": 5})  # HAC, 5 lags
fit_post.summary() # has the slope survived?The specification is identical. Only the period changes, and with it the lag length for the longer series.
Output: after 1970, the slope flips sign
| Coef. | HAC SE | \(p\) | |
|---|---|---|---|
| Intercept | 1.928 | 1.868 | 0.308 |
urate |
+0.265 | 0.326 | 0.420 |
N = 45 (1970–2014) · NW, 5 lags · \(R^2 = 0.028\)
The point estimate is now positive, but it is not significant (\(p = 0.42\)), and \(R^2\) collapses from 0.45 to 0.03.
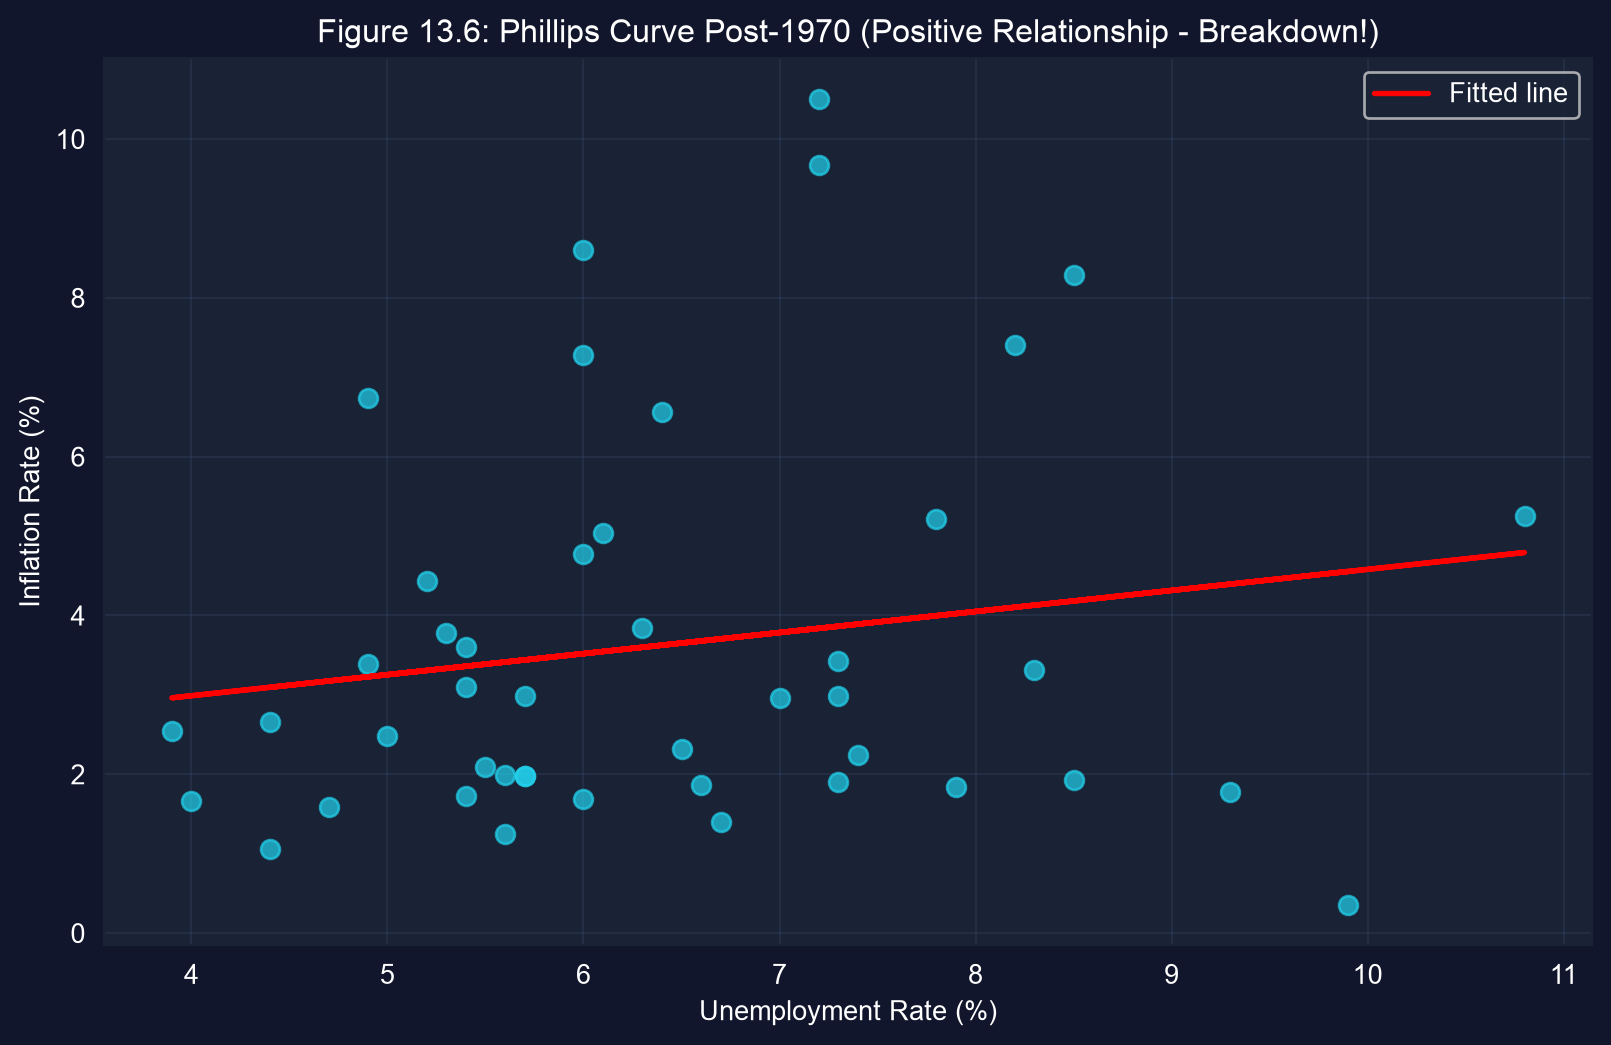
Same two variables, opposite sign. Either the economy changed, or the bivariate model was always missing something.
The OVB formula: what an omitted regressor does to a slope
\[\underbrace{y = \beta_1 + \beta_2 x + \beta_3 z + u}_{\text{long (true) model}} \qquad \underbrace{z = \gamma_1 + \gamma\,x + v}_{\text{auxiliary regression}}\]
Substitute \(z\) into the long model and regress \(y\) on \(x\) alone:
\[E[b_2] = \beta_2 + \underbrace{\beta_3\,\gamma}_{\text{omitted variables bias}}\]
The bias is (effect of the omitted \(z\) on \(y\)) × (how \(z\) moves with the included \(x\)). It vanishes only if \(\beta_3 = 0\) or \(\gamma = 0\).
Code: add expected inflation, then run the auxiliary regression
# continues from the previous block
data_exp = data_post1970.dropna(subset=["inflgdp1yr"]).copy()  # rows with expected inflation
data_exp["_time"] = range(len(data_exp))                       # time index for HAC
fit_augmented = pf.feols("inflgdp ~ urate + inflgdp1yr", data=data_exp,
                         vcov="NW", vcov_kwargs={"time_id": "_time", "lag": 5})  # long model
fit_aux = pf.feols("inflgdp1yr ~ urate", data=data_exp)        # auxiliary: z on x
beta2 = fit_augmented.coef()["urate"]       # true slope on unemployment
beta3 = fit_augmented.coef()["inflgdp1yr"]  # effect of expected inflation
gamma = fit_aux.coef()["urate"]             # how expectations co-move with unemployment
print(beta2 + beta3 * gamma, fit_post.coef()["urate"]) # predicted vs actual short slopeOutput: control for expectations and the negative slope returns
| Variable (long model) | Coef. | HAC SE | \(t\) | \(p\) | 95% CI |
|---|---|---|---|---|---|
| Intercept | 0.270 | 0.634 | 0.43 | 0.672 | [−1.01, 1.55] |
urate (\(\hat\beta_2\)) |
−0.128 | 0.081 | −1.58 | 0.122 | [−0.29, 0.04] |
inflgdp1yr (\(\hat\beta_3\)) |
1.146 | 0.085 | 13.48 | < 0.001 | [0.97, 1.32] |
N = 45 · NW, 5 lags · \(R^2 = 0.881\) · Auxiliary regression: \(\hat\gamma = 0.343\) (SE 0.195, \(p = 0.086\), default SEs)
Expected inflation does most of the work (\(R^2\) jumps from 0.03 to 0.88), and the unemployment slope turns negative again.
The OVB arithmetic explains the sign reversal exactly
\[b_2^{\text{short}} = \hat\beta_2 + \hat\beta_3\,\hat\gamma = -0.128 + 1.146 \times 0.343 = +0.265\]
| Piece | Value | Meaning |
|---|---|---|
| \(\hat\beta_2\) | −0.128 | unemployment slope, holding expectations fixed |
| \(\hat\beta_3\hat\gamma\) | +0.393 | bias from omitting expected inflation |
| \(b_2^{\text{short}}\) | +0.265 | the bivariate post-1970 slope: an exact match |
The bivariate slope gave unemployment credit for expected inflation’s effect. The bias (+0.39) was large enough to flip the sign.
Caveats: the trade-off is restored in sign, not proven
- Imprecision: the augmented slope (\(-0.128\), \(p = 0.12\)) and \(\hat\gamma\) (\(p = 0.086\)) are not significant at 5%
- Measurement: expected inflation is a forecasters’ survey, a proxy for what wage- and price-setters actually expected
- Simultaneity: inflation and unemployment are both outcomes of the same shocks and policies, so this is not a causal structural equation
- Other omitted variables: supply shocks and policy regimes can still bias the long model
The OVB formula is a diagnostic: it tells us the direction and size of the bias from a named omitted variable. It cannot rule out the omitted variables we have not named.
Case 13.4 · What determines fuel economy?
Log-log model · 26,995 vehicles · cluster-robust standard errors
The question: why didn’t fuel economy improve more?
Data. 26,995 vehicle models sold in the U.S., 1980–2006, from 39 manufacturers (AED_AUTOSMPG.DTA). The logs come pre-computed in the data.
mpg: miles per gallon (8.7 to 76.4)curbwt: weight in pounds (1,450 to 6,700)hp,torque: engine power and pulling forceyear: model year (a technology trend)mfr: manufacturer (the clustering variable)
| Top manufacturers | Models |
|---|---|
| GMC | 7,979 |
| Chrysler | 4,172 |
| Ford | 3,709 |
| Toyota | 1,554 |
| Nissan | 1,079 |
| Volkswagen | 831 |
| Honda | 743 |
Engines kept improving, so where did the efficiency gains go? This case links fuel economy to vehicle attributes.
After 1985, the gains went into power, not mileage
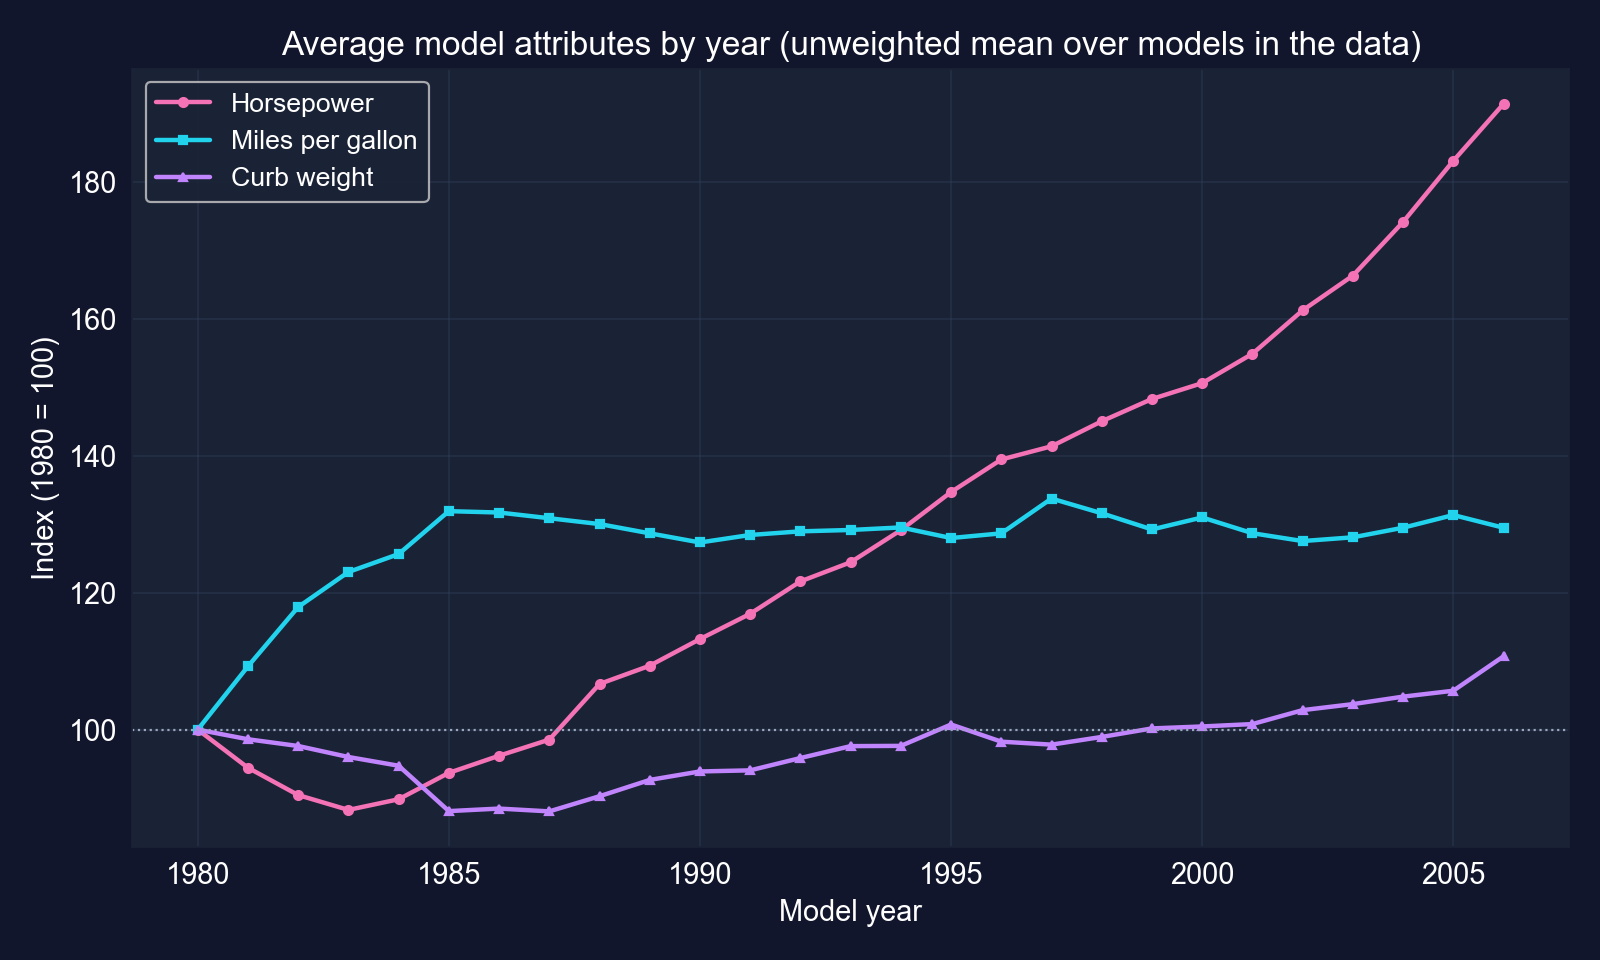
Unweighted average over the models in the data, indexed to 1980 = 100. Average MPG rose about 32% by 1985, then stayed roughly flat while horsepower nearly doubled.
From 1985 to 2006, average horsepower climbed steadily while average MPG barely moved.
Why cluster by manufacturer?
Vehicles from the same manufacturer share engine platforms, engineering teams, design philosophy and testing practices. So their regression errors are correlated within the manufacturer.
Default / HC1 SEs assume
- 26,995 independent pieces of information
- Too-small SEs, too-large \(t\)-stats
Cluster-robust (CRV1) SEs allow
- any correlation inside each of the 39 manufacturers
- independence only across manufacturers
With correlated errors, the effective sample size is closer to the number of clusters than to the number of rows.
Code: log-log regression with SEs clustered by manufacturer
!pip install -q pyfixest                    # pyfixest is not preinstalled in Colab
import pandas as pd                         # tabular data
import pyfixest as pf                       # OLS with R-style formulas
url = "https://raw.githubusercontent.com/quarcs-lab/data-open/master/AED/AED_AUTOSMPG.DTA"
data_auto = pd.read_stata(url)              # 26,995 vehicles, 1980–2006 (logs pre-computed)
print(data_auto[["mpg", "curbwt", "hp", "torque", "year"]].describe())  # summary statistics
print(data_auto["mfr"].value_counts().head(10))                       # observations per maker
# log MPG on log HP, log weight, log torque and a linear year trend
fit_auto = pf.feols("lmpg ~ lhp + lcurbwt + ltorque + year", data=data_auto,
                    vcov={"CRV1": "mfr"})   # cluster-robust SEs by manufacturer
fit_auto.summary()                          # elasticities + clustered SEs
print(data_auto["mfr"].nunique()) # number of clusters: 39Output: weight is the dominant determinant of fuel economy
| Variable | Coef. | CRV1 SE | \(t\) | \(p\) | 95% CI |
|---|---|---|---|---|---|
| Intercept | −20.843 | 1.988 | −10.48 | < 0.001 | [−24.87, −16.82] |
lhp |
−0.181 | 0.065 | −2.79 | 0.008 | [−0.31, −0.05] |
lcurbwt |
−0.562 | 0.057 | −9.94 | < 0.001 | [−0.68, −0.45] |
ltorque |
−0.141 | 0.064 | −2.21 | 0.033 | [−0.27, −0.01] |
year |
0.0152 | 0.0011 | 13.84 | < 0.001 | [0.013, 0.017] |
N = 26,995 · SEs clustered by manufacturer (39 clusters) · \(R^2 = 0.777\)
Weight carries the largest elasticity, and the year trend shows steady technical progress at fixed attributes.
Reading the elasticities: technology was “spent” on weight and power
- Weight −0.56: a 1% heavier vehicle gets ≈ 0.56% lower MPG, holding power, torque and year fixed (the largest effect)
- Horsepower −0.18 and torque −0.14: ≈ 0.18% and ≈ 0.14% lower MPG per 1% increase
- Year +0.0152: at fixed weight, power and torque, MPG rises about 1.5% per model year (\(100 \times (e^{0.0152}-1) = 1.53\%\))
- The paradox resolved: the technology trend kept raising MPG at given attributes, while rising horsepower and weight pulled it back down
Engineers made engines more efficient every year, and buyers took the gains as more powerful (and somewhat heavier) cars.
Clustering makes the standard errors 6–9× larger
| Variable | HC1 SE (ignores clusters) | CRV1 SE (by manufacturer) | Ratio |
|---|---|---|---|
lhp |
0.0071 | 0.0651 | 9.1× |
lcurbwt |
0.0080 | 0.0566 | 7.0× |
ltorque |
0.0076 | 0.0640 | 8.4× |
year |
0.00017 | 0.0011 | 6.4× |
Same coefficients; only vcov changes. HC1 comparison: pf.feols("lmpg ~ lhp + lcurbwt + ltorque + year", data=data_auto, vcov="HC1")
If we ignored the clustering, every \(t\)-statistic would be inflated 6–9×. The torque effect (\(t = 2.21\) clustered) would look like \(t \approx 18.6\).
Caveats: an engineering association, not a causal effect
- Joint choices: weight, power and torque are chosen together by designers, so “a 1% heavier car, all else equal” is a comparison across models, not an experiment
- Few, unbalanced clusters: 39 manufacturers, and GMC alone is about 30% of the rows. Cluster-robust inference works best with many similar-sized clusters
- Not sales-weighted: every model counts equally, regardless of how many units sold
- Overlapping engine measures: horsepower and torque capture related engine traits, which blurs their separate effects
Within these limits, the large weight elasticity and the year trend are robust, and they tell a coherent story.
Act II-b · Four designs that identify causation
Cases 13.5–13.8 · RCT · DiD · RD · IV
Why a raw comparison is not a causal effect
\[\underbrace{E[Y \mid D{=}1] - E[Y \mid D{=}0]}_{\text{observed difference}} = \underbrace{E[Y_1 - Y_0 \mid D{=}1]}_{\text{effect on the treated (ATT)}} + \underbrace{E[Y_0 \mid D{=}1] - E[Y_0 \mid D{=}0]}_{\text{selection bias}}\]
\(Y_1\), \(Y_0\): potential outcomes with and without treatment. We only ever observe one of them per unit. The other is the counterfactual.
Every design in this act is a strategy for driving the selection-bias term to zero.
Four ways to build the counterfactual
| Design | Where the counterfactual comes from | Case |
|---|---|---|
| RCT | a randomly assigned control group | 13.5 RAND health insurance |
| Difference-in-differences | the control group’s change over time | 13.6 South African clinics |
| Regression discontinuity | units just on the other side of a cutoff | 13.7 Senate elections |
| Instrumental variables | variation in treatment driven only by an instrument | 13.8 colonial institutions |
Each design swaps the unverifiable “I controlled for everything” for one specific assumption you can argue about.
Case 13.5 · Does cost-sharing reduce medical spending?
Randomized controlled trial · RAND Health Insurance Experiment · SEs clustered by family
The question: does cheaper care mean more care?
Moral hazard: if insurance makes care cheaper at the point of use, do people use more of it? That question drives every debate about deductibles and co-pays.
Why observational data fail. People choose their insurance:
- those who expect to be sick buy more generous plans
- income, education and health all affect both plan choice and spending
In observational data, “generous plan → higher spending” mixes the plan’s effect with who chose it.
The design: random assignment to insurance plans
RAND Health Insurance Experiment (1974–1982)
- families randomly assigned to plans
- coinsurance (the share of the bill you pay): 0% (free care), 25%, mixed 25/50%, 50%, 95%, or an individual deductible
- followed for 3–5 years
Why it works
- assignment is independent of health, income and preferences
- so the groups are identical in expectation
- selection bias \(= 0\) in expectation, so the difference in means estimates the causal effect of each plan vs free care
Randomization does not equalize the groups exactly. It makes every difference before treatment pure chance, which standard errors already account for.
The data: year 1 of the experiment
| Value | |
|---|---|
| Person-year observations, all years | 20,203 |
| Observations used (year 1 only) | 5,639 |
| Families (clusters) in year 1 | 1,930 |
| Median annual spending (2011 $) | $479 |
| Largest annual spending | $175,831 |
Outcome spending = inpatient + outpatient medical spending in 2011 dollars. Plan dummies: coins25, coinsmixed, coins50, coins95, coinsindiv; free care is the omitted baseline.
Spending is extremely skewed (median $479, maximum $175,831), so group means will be noisy.
Code: load the experiment and compare mean spending by plan
!pip install -q pyfixest                    # pyfixest is not preinstalled in Colab
import pandas as pd                         # tabular data
import pyfixest as pf                       # OLS with R-style formulas
url = "https://raw.githubusercontent.com/quarcs-lab/data-open/master/AED/AED_HEALTHINSEXP.DTA"
data_health = pd.read_stata(url)            # RAND HIE, all years (20,203 person-years)
data_health_y1 = data_health[data_health["year"] == 1]   # first year only: 5,639 obs
spending_by_plan = data_health_y1.groupby("plan")["spending"].agg(["mean", "std", "count"])
print(spending_by_plan) # mean, SD and size of each randomized groupWith random assignment, this simple table of group means is already a causal comparison.
Output: free care has the highest spending
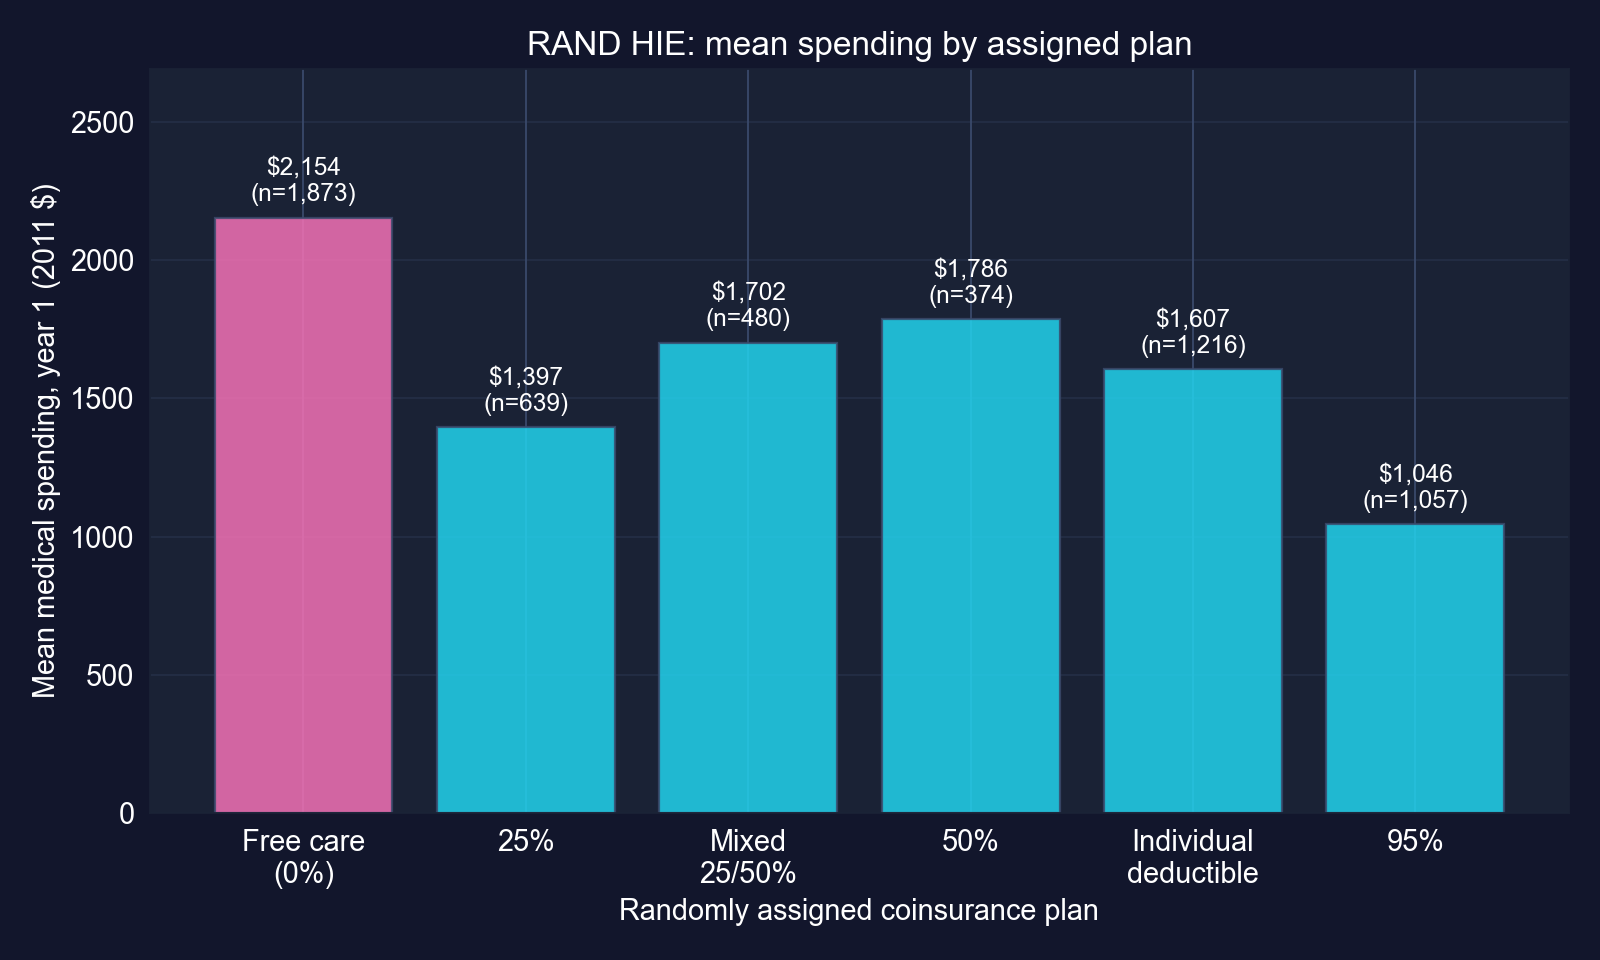
Mean year-1 spending by randomly assigned plan (2011 $), with group sizes.
Every cost-sharing plan spends less than free care, and the 95% plan spends about half.
Code: the RCT regression with SEs clustered by family
# continues from the previous block
# spending on plan dummies; free care (coins0) is the omitted baseline
fit_rct = pf.feols("spending ~ coins25 + coins50 + coins95 + coinsmixed + coinsindiv",
                   data=data_health_y1, vcov={"CRV1": "idfamily"})  # cluster by family
fit_rct.summary() # each coefficient = plan mean − free-care meanA regression on a full set of group dummies reproduces the group means exactly: intercept = baseline mean, slopes = differences from it.
Output: most cost-sharing plans cut spending significantly
| Variable | Coef. ($) | CRV1 SE | \(t\) | \(p\) | 95% CI | % of baseline |
|---|---|---|---|---|---|---|
| Intercept (free care) | 2,153.57 | 118.31 | 18.20 | < 0.001 | [1,921.5, 2,385.6] | — |
coins25 |
−756.91 | 190.04 | −3.98 | < 0.001 | [−1,129.6, −384.2] | −35% |
coins50 |
−367.72 | 618.04 | −0.59 | 0.552 | [−1,579.8, 844.4] | −17% |
coins95 |
−1,107.75 | 150.37 | −7.37 | < 0.001 | [−1,402.6, −812.9] | −51% |
coinsmixed |
−451.70 | 239.42 | −1.89 | 0.059 | [−921.3, 17.9] | −21% |
coinsindiv |
−546.50 | 162.15 | −3.37 | < 0.001 | [−864.5, −228.5] | −25% |
Plans: coins25 25% · coins50 50% · coins95 95% · coinsmixed 25/50% · coinsindiv individual deductible · N = 5,639 · SEs clustered by family (1,930) · \(R^2 = 0.007\)
Three plans are clearly below free care. The 50% plan is not significantly different (\(p = 0.55\)): its CI runs from \(-\$1{,}580\) to \(+\$844\).
Code + output: do the plans matter jointly?
# continues from the previous block
import numpy as np                          # matrix algebra
from scipy.stats import f as f_dist         # F distribution
coef_names = ["coins25", "coins50", "coins95", "coinsmixed", "coinsindiv"]
coefs = np.array([fit_rct.coef()[c] for c in coef_names])        # the 5 plan effects
idx = [list(fit_rct.coef().index).index(c) for c in coef_names]  # their positions
V_sub = fit_rct._vcov[np.ix_(idx, idx)]     # clustered covariance of the 5 effects
f_val = coefs @ np.linalg.inv(V_sub) @ coefs / len(coef_names)   # Wald F statistic
p_val = 1 - f_dist.cdf(f_val, len(coef_names), fit_rct._N - len(fit_rct.coef()))
print(f_val, p_val) # H0: all five plan effects = 0Result: \(F = 11.39\), \(p < 0.001\). We reject that insurance generosity is irrelevant: plan design causally changes spending.
Interpretation: moral hazard is real, and moderate
- Causal reading: because plans were randomized, the −$1,108 for the 95% plan is the effect of facing 95% coinsurance instead of free care, about 51% less spending in year 1
- Magnitude: cost-sharing cuts spending by roughly a quarter to a half, depending on the plan; that is meaningful but not dramatic
- \(R^2 = 0.007\) is irrelevant to causality: individual health shocks drive most of the spending variation. A low \(R^2\) means we predict individuals poorly, not that the effect is biased
- Policy: free care raises use; cost-sharing lowers costs but may also cut necessary care
An RCT turns a difference in means into a causal effect. Precision, not bias, is the remaining problem.
Threats to an RCT: what can still go wrong
- Attrition: if families who dislike their plan drop out (more likely under heavy cost-sharing), the remaining groups are no longer comparable
- Non-compliance and refusal at enrollment can undo the balance that randomization created
- Balance check (not run in the chapter): compare baseline age, income and health across plans; they should differ only by chance
- External validity: six U.S. sites in the 1970s; health care has changed since
- Ethics and cost: randomizing insurance is rarely possible, which is why the next three designs exist
Randomization identifies the effect for the people in the experiment. Its credibility then depends on keeping the randomized groups intact.
Case 13.6 · Did free care improve child nutrition?
Difference-in-differences · South Africa, 1993 vs 1998 · SEs clustered by community
The question: did the 1994 health reform improve child nutrition?
- The policy (1994): post-apartheid South Africa made public primary care free for young children and pregnant women (studied by Tanaka 2014)
- Who could benefit: free care helps only if a clinic is within reach
- Treatment group: children in communities that had a clinic in 1993 (
hightreat = 1); comparison group: children in communities without one - Outcome:
waz, the weight-for-age \(z\)-score, a standard measure of child nutrition
Exposure to the reform depended on where a child lived, which gives a natural treatment and comparison group.
The design: difference out both the level gap and the common trend
| Group | 1993 (pre) | 1998 (post) | Change |
|---|---|---|---|
| High treatment (clinic) | \(\bar Y_{T,0}\) | \(\bar Y_{T,1}\) | \(\Delta_T\) |
| Low treatment (no clinic) | \(\bar Y_{C,0}\) | \(\bar Y_{C,1}\) | \(\Delta_C\) |
\[\text{DiD} = (\bar Y_{T,1} - \bar Y_{T,0}) - (\bar Y_{C,1} - \bar Y_{C,0}) = \Delta_T - \Delta_C\]
The first difference removes permanent gaps between communities. The second removes changes common to everyone (national trends, the economy).
Code: the 2×2 table of means and the DiD by hand
!pip install -q pyfixest                    # pyfixest is not preinstalled in Colab
import pandas as pd                         # tabular data
import pyfixest as pf                       # OLS with R-style formulas
url = "https://raw.githubusercontent.com/quarcs-lab/data-open/master/AED/AED_HEALTHACCESS.DTA"
data_access = pd.read_stata(url)            # 1,071 children aged 0–4; 1993 and 1998
print(data_access.groupby(["hightreat", "post"])["waz"].agg(["mean", "count"]))  # 2×2 means
m = data_access.groupby(["hightreat", "post"])["waz"].mean()  # the four cell means
pre_control, post_control = m[(0, 0)], m[(0, 1)]   # no clinic: 1993, 1998
pre_treat, post_treat = m[(1, 0)], m[(1, 1)]       # clinic: 1993, 1998
did_estimate = (post_treat - pre_treat) - (post_control - pre_control)
print(post_control - pre_control, post_treat - pre_treat, did_estimate) # ΔC, ΔT, DiDOutput: the treated group improved by 0.52 more
Mean waz (n) |
1993 (pre) | 1998 (post) | Change |
|---|---|---|---|
| Low treatment (no clinic) | −0.414 (325) | −0.069 (288) | +0.345 |
| High treatment (clinic) | −0.545 (246) | 0.321 (212) | +0.867 |
| Difference (high − low) | −0.131 | +0.391 | +0.522 |
DiD \(= 0.867 - 0.345 = 0.522\). The same number appears as the difference of the two columns: \(0.391 - (-0.131) = 0.522\).
Children in clinic communities started slightly behind, ended clearly ahead, and gained 0.52 more than the comparison group.
Naive vs design: two shortcuts, two different biases
| Comparison | Estimate | What it gets wrong |
|---|---|---|
| After-only gap (1998: high − low) | 0.391 | ignores that treated children started 0.131 lower, so it is biased down |
| Before–after, treated only | 0.867 | credits the reform with the common improvement (+0.345), so it is biased up |
| Difference-in-differences | 0.522 | removes both the baseline gap and the common trend |
Each single difference is contaminated by one confounder. Using both differences removes both.
Code: DiD as a regression with an interaction term
# continues from the previous block
# waz on group, period and their interaction (postXhigh = post × hightreat)
fit_did = pf.feols("waz ~ hightreat + post + postXhigh", data=data_access,
                   vcov={"CRV1": "idcommunity"})   # cluster by community (54 clusters)
fit_did.summary()                           # postXhigh = the DiD estimate
print(fit_did.coef()["postXhigh"], did_estimate) # identical: 0.522 and 0.522The regression gives the same 0.522, plus a standard error that accounts for correlation within communities.
Output: every coefficient is one cell of the 2×2 table
| Variable | Coef. | CRV1 SE | \(t\) | \(p\) | 95% CI | = in the 2×2 table |
|---|---|---|---|---|---|---|
| Intercept | −0.414 | 0.115 | −3.60 | 0.001 | [−0.645, −0.183] | control, 1993 |
hightreat |
−0.131 | 0.197 | −0.67 | 0.508 | [−0.526, 0.264] | baseline gap |
post |
0.345 | 0.137 | 2.52 | 0.015 | [0.070, 0.620] | common trend (\(\Delta_C\)) |
postXhigh |
0.522 | 0.235 | 2.22 | 0.031 | [0.050, 0.994] | DiD |
N = 1,071 · SEs clustered by community (54 clusters) · \(R^2 = 0.040\)
The baseline gap is small and insignificant (\(p = 0.51\)), and the DiD effect is significant at 5% (\(p = 0.031\)), though its CI is wide.
The counterfactual: where the treated group would have been
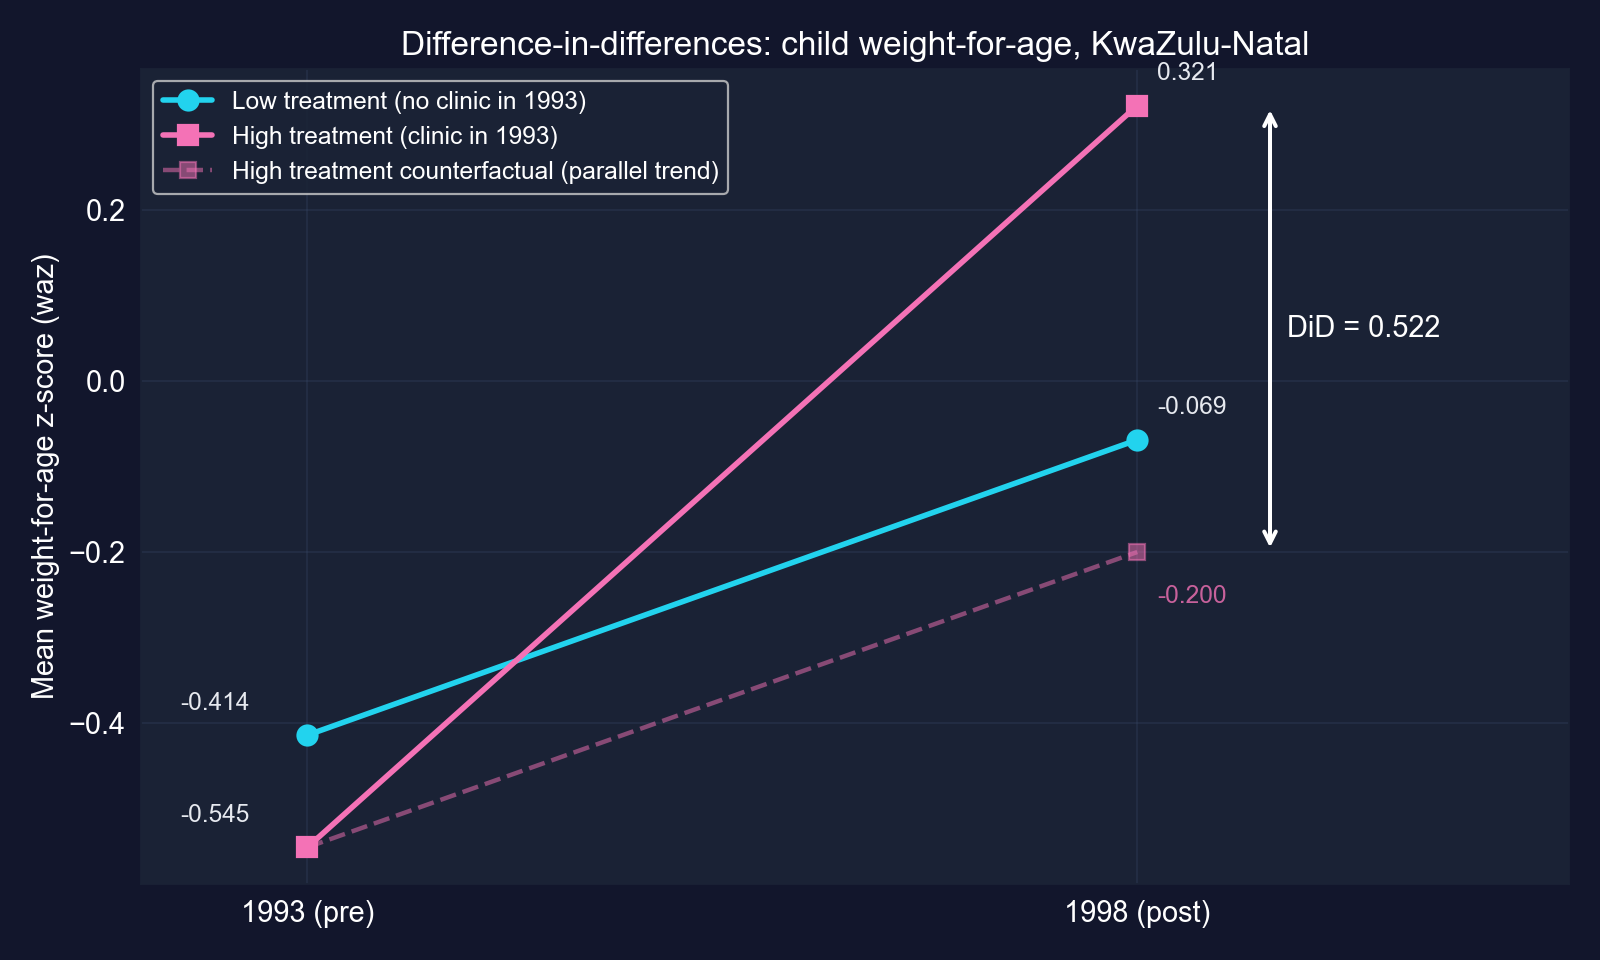
Mean waz by group and year. Dashed: the treated group’s counterfactual path under parallel trends (−0.545 + 0.345 = −0.200).
The effect is the vertical gap between what happened (0.321) and the parallel-trend counterfactual (−0.200), which is 0.522.
Interpretation: a large effect, imprecisely measured
- Units:
wazis measured in SDs of a reference growth standard, so the effect is +0.52 \(z\)-units. In this samplewazhas SD 1.59, so that is about 0.33 sample SDs - Significance: \(p = 0.031\), so we reject “no effect” at 5%
- Precision: the 95% CI is [0.05, 0.99]; the data support anything from a negligible to a very large effect
- Causal claim: the reform’s effect on children in clinic communities, if parallel trends hold
DiD gives a credible direction and a plausible magnitude. With 54 communities, the precision is modest.
Threats: parallel trends cannot be tested with two periods
- Untestable here: with one pre-period we cannot check whether the groups were trending together before 1994 (more pre-periods allow an event-study check)
- Different places: communities with clinics may differ (roads, water, income) and could have improved faster anyway
- Concurrent changes: other post-1994 programs that favored clinic communities would be counted as the reform’s effect
- Changing composition: different children are measured in 1993 and 1998; if who lives in treated communities changed, so does the mean
- Inference: 54 clusters, so CRV1 SEs are reasonable but not exact
Every DiD estimate rests on the dashed line. Defend it with institutional knowledge, pre-trends and placebo tests.
Case 13.7 · Do parties gain from holding a Senate seat?
Regression discontinuity · U.S. Senate elections, 1914–2010 · HC1 standard errors
The question: is there an incumbency advantage?
Parties that hold a seat tend to win it again. But is that because holding the seat helps, or because parties that win were stronger to begin with?
The data (AED_INCUMBENCY.DTA): 1,390 U.S. Senate elections, 1914–2010
margin: Democratic margin of victory in election \(t\) (percentage points, −100 to +100)win\(= 1\) ifmargin\(> 0\) (the Democrat won the seat)vote: Democratic vote share in the next election for that seat, \(t+1\) (1,297 non-missing)
The unit is the party’s seat, so this case measures the party incumbency advantage: the gain to the Democratic party from having won the seat last time.
The design: compare races that were barely won with races that were barely lost
- Running variable:
margin - Cutoff:
margin\(= 0\) - Treatment: winning, which switches on sharply at the cutoff
- Key assumption, continuity: without the treatment, average outcomes would vary smoothly through the cutoff
\[\text{vote}_{t+1} = \beta_1 + \beta_2\,\text{win}_t + \beta_3\,\text{margin}_t + u\]
\(\beta_2\) is the jump in the outcome at margin \(= 0\), after controlling for the smooth effect of the margin.
Within a hair of 50%, who wins is close to a coin flip, so winners and losers are comparable except for winning.
Naive vs design: comparing all winners with all losers is badly biased
| Comparison | Next-election Democratic vote share | Gap |
|---|---|---|
| Seats the Democrats won (702) | 62.6% | |
| Seats the Democrats lost (595) | 40.9% | |
| Naive difference | 21.7 pp | |
| RD estimate at the cutoff (next slides) | 4.8 pp |
Most of the raw 21.7-point gap is selection: states where Democrats win comfortably will keep voting Democratic, incumbent or not.
Code: the RD regression
!pip install -q pyfixest                    # pyfixest is not preinstalled in Colab
import pandas as pd                         # tabular data
import pyfixest as pf                       # OLS with R-style formulas
url = "https://raw.githubusercontent.com/quarcs-lab/data-open/master/AED/AED_INCUMBENCY.DTA"
data_incumb = pd.read_stata(url)            # 1,390 Senate elections, 1914–2010
print(data_incumb[["vote", "margin", "win"]].describe())   # running variable and outcome
data_rd = data_incumb[data_incumb["vote"].notna()].copy()  # keep races with a t+1 outcome
naive = data_rd.groupby("win")["vote"].mean()               # naive: winners vs losers
fit_rd = pf.feols("vote ~ win + margin", data=data_rd, vcov="HC1")  # jump + linear margin
fit_rd.summary()                            # win coefficient = discontinuity at 0
print(fit_rd.confint().loc["win"]) # 95% CI for the jumpOutput: barely winning adds about 4.8 percentage points next time
| Variable | Coef. | HC1 SE | \(t\) | \(p\) | 95% CI |
|---|---|---|---|---|---|
| Intercept | 47.331 | 0.526 | 89.95 | < 0.001 | [46.30, 48.36] |
win |
4.785 | 0.860 | 5.56 | < 0.001 | [3.10, 6.47] |
margin |
0.348 | 0.017 | 20.42 | < 0.001 | [0.315, 0.381] |
N = 1,297 · HC1 SEs · \(R^2 = 0.578\)
- Barely lost (margin \(\to 0^-\)): predicted next-time Democratic share 47.3%
- Barely won (margin \(\to 0^+\)): 47.3 + 4.8 = 52.1%
- Each extra point of margin today: +0.35 points next time (on both sides, by assumption)
The jump at the cutoff is 4.8 percentage points, not 4.8%, and it is precisely estimated.
The discontinuity, visualized
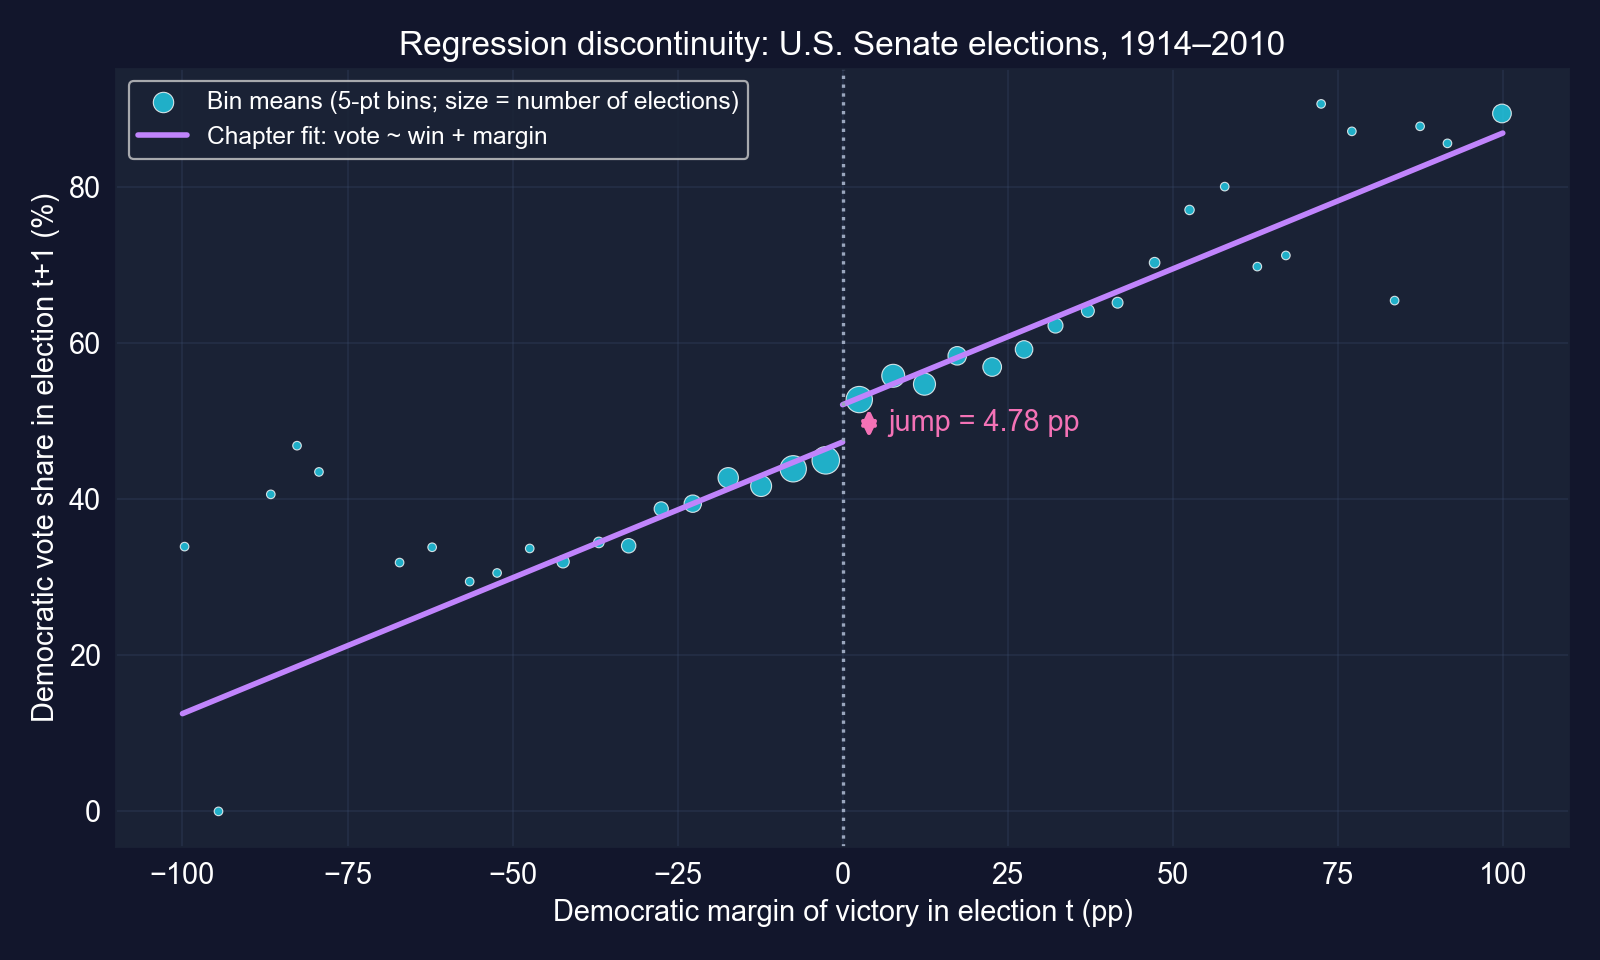
Binned means of next-election Democratic vote share by current margin (5-point bins). Purple: the chapter’s fitted model, one slope, with a jump at 0.
The bins jump at zero: races just won sit visibly above races just lost.
Interpretation: a local, party-level causal effect
- Causal because near margin \(= 0\), winning is as-good-as random: barely-winning and barely-losing parties face similar states, candidates and conditions
- Local: it applies to close races, not to landslides; the advantage in safe seats is not identified
- Party-level: the Democratic party’s seat-holding advantage, whether or not the same senator runs again
- Mechanisms (not separated here): name recognition, fundraising, media access, constituent service
RD trades breadth for credibility: a very believable effect, for a narrow set of elections.
Threats: the estimate leans on a global linear fit
- Global, not local: the chapter fits one straight line over margins from −100 to +100, including 45 uncontested races at ±100. Only 451 of 1,297 races are within ±10 points
- Common slope: forcing the same slope on both sides can bias the jump if the true relationship bends near 0
- Standard practice: local linear regression within a bandwidth around 0, with separate slopes on each side and a data-driven bandwidth (e.g.
rdrobust), plus sensitivity checks - Sorting: if parties could manipulate very close outcomes, barely-winners would differ systematically. Check the density of
marginand the balance of covariates at 0
The design is credible. How much to trust the specific 4.8 depends on the functional form, so a local robustness check is the next step.
Case 13.8 · Do institutions cause prosperity?
Instrumental variables · two-stage least squares · 64 former colonies
The question: why are some countries rich and others poor?
Regress GDP on the quality of institutions and you get a strong positive slope. But institutions are endogenous:
| Source of endogeneity | Likely direction of OLS bias |
|---|---|
| Reverse causation: rich countries can afford better institutions | upward |
| Omitted variables: geography, culture, history affect both | likely upward |
| Measurement error: “institutions” is hard to measure | toward zero (attenuation) |
OLS mixes all three, and the biases pull in opposite directions, so we cannot even sign the net bias.
The design: settler mortality as an instrument
The historical argument (AJR 2001):
Settler mortality (1600s–1800s) \(\to\) type of colonial institutions \(\to\) institutions today \(\to\) GDP today
- High mortality: Europeans did not settle, and built extractive institutions
- Low mortality: Europeans settled, and built institutions that protect property
- Relevance: mortality must predict institutions, which the first stage tests
- Exclusion: mortality must affect today’s GDP only through institutions. This cannot be tested
An instrument is valid only if it moves the treatment and has no other path to the outcome. The second condition rests on argument, not data.
Code: start with the (biased) OLS benchmark
!pip install -q pyfixest                    # pyfixest is not preinstalled in Colab
import pandas as pd                         # tabular data
import pyfixest as pf                       # OLS and IV with R-style formulas
url = "https://raw.githubusercontent.com/quarcs-lab/data-open/master/AED/AED_INSTITUTIONS.DTA"
data_inst = pd.read_stata(url)              # 64 former colonies (Acemoglu–Johnson–Robinson)
print(data_inst[["logpgp95", "avexpr", "logem4"]].describe())  # outcome, regressor, instrument
fit_ols = pf.feols("logpgp95 ~ avexpr", data=data_inst, vcov="HC1")  # OLS: endogenous
fit_ols.summary() # benchmark slopeOutput: OLS finds a strong association
| Variable | Coef. | HC1 SE | \(t\) | \(p\) | 95% CI |
|---|---|---|---|---|---|
| Intercept | 4.660 | 0.320 | 14.56 | < 0.001 | [4.02, 5.30] |
avexpr |
0.522 | 0.050 | 10.46 | < 0.001 | [0.422, 0.622] |
N = 64 · HC1 SEs · \(R^2 = 0.540\)
One point more on the 0–10 expropriation-protection index goes with 0.52 log points higher GDP per capita: \(e^{0.522} - 1 \approx\) 69% higher.
A large and precise association, but it inherits every endogeneity problem on the previous slide.
Code: the first stage, checking relevance
# continues from the previous block
fit_first = pf.feols("avexpr ~ logem4", data=data_inst, vcov="HC1")  # institutions on instrument
fit_first.summary()                         # does settler mortality predict institutions?
first_f = fit_first.tstat()["logem4"] ** 2  # one instrument: first-stage F = t²
print(first_f) # rule of thumb: F > 10 → not weakWith a single instrument, the first-stage \(F\)-statistic is just the squared \(t\)-statistic on the instrument.
Output: settler mortality strongly predicts institutions
| Coef. | HC1 SE | |
|---|---|---|
| Intercept | 9.341 | 0.704 |
logem4 |
−0.607 | 0.150 |
N = 64 · \(R^2 = 0.270\) · \(t = -4.04\)
First-stage \(F = (-4.04)^2 =\) 16.32 \(> 10\)
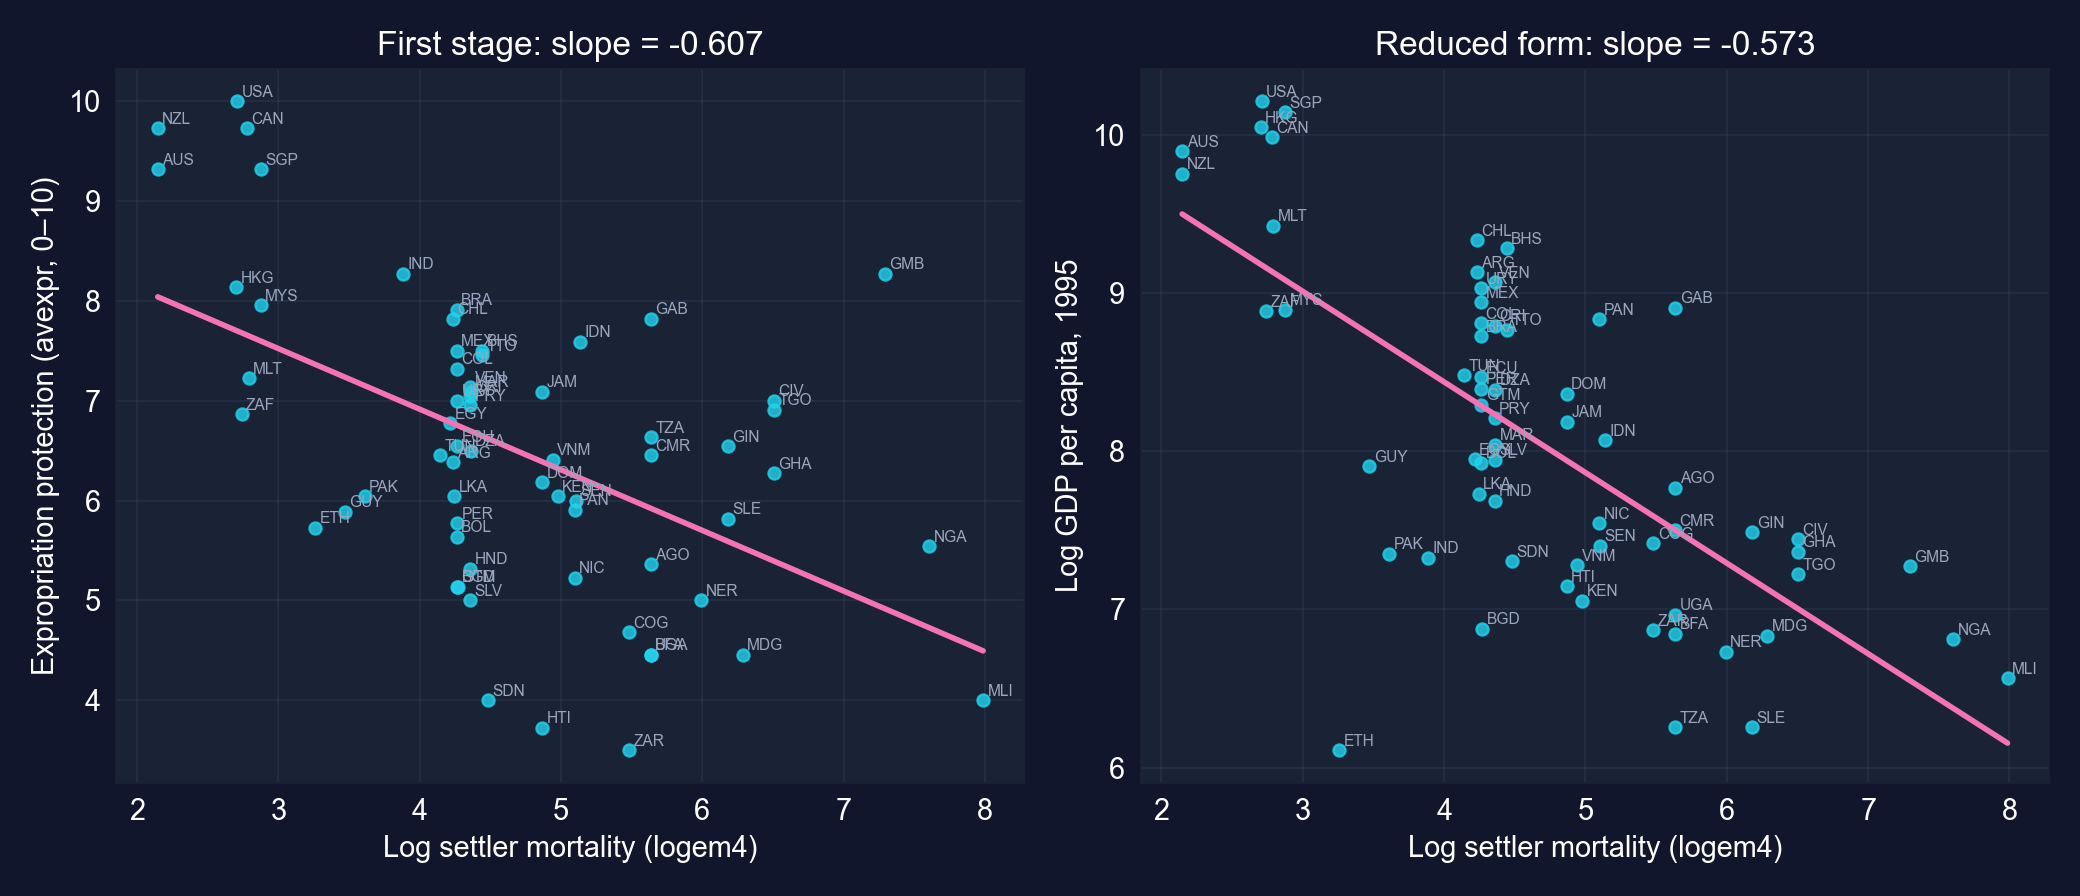
Places deadlier for settlers have weaker property-rights protection today. The instrument is relevant and passes the \(F > 10\) rule of thumb.
Code: two-stage least squares in one line
# continues from the previous block
# formula syntax: outcome ~ exogenous regressors | endogenous ~ instrument
fit_iv = pf.feols("logpgp95 ~ 1 | avexpr ~ logem4", data=data_inst, vcov="HC1")  # 2SLS
fit_iv.summary()                            # causal slope under the IV assumptions
print(fit_ols.coef()["avexpr"], fit_iv.coef()["avexpr"])   # OLS vs IV
import numpy as np                          # for np.exp
print(np.exp(fit_iv.coef()["avexpr"])) # multiplicative effect on GDP: e^bThe | separates the exogenous part (1, just the intercept) from the endogenous regressor and its instrument.
Output: the IV estimate is 1.8× the OLS estimate
| Variable | Coef. | HC1 SE | \(t\) | \(p\) | 95% CI |
|---|---|---|---|---|---|
| Intercept | 1.910 | 1.193 | 1.60 | 0.114 | [−0.47, 4.29] |
avexpr (instrumented) |
0.944 | 0.179 | 5.28 | < 0.001 | [0.587, 1.302] |
N = 64 · 2SLS, instrument logem4 · HC1 SEs
One more point of institutional quality causes 0.94 log points higher GDP per capita, if the instrument is valid.
IV = reduced form ÷ first stage
\[\hat\beta_{IV} = \frac{\text{effect of } Z \text{ on } Y}{\text{effect of } Z \text{ on } X} = \frac{-0.573}{-0.607} = 0.944\]
Reduced form: \(-0.573\) is the slope of log GDP on log settler mortality (bivariate OLS, same 64 countries).
IV rescales the instrument’s total effect on GDP by its effect on institutions. All the identifying power comes from settler mortality.
OLS vs IV: same question, different source of variation
| OLS | 2SLS (IV) | |
|---|---|---|
Coefficient on avexpr |
0.522 | 0.944 |
| Standard error (HC1) | 0.050 | 0.179 |
| 95% CI | [0.42, 0.62] | [0.59, 1.30] |
| GDP effect of +1 index point, \(100(e^{b}-1)\) | +69% | +157% |
GDP effect of +1 SD of avexpr (1.47 points) |
×2.2 | ×4.0 |
| Variation used | all variation in institutions | only the part driven by settler mortality |
The IV estimate is larger and less precise. Under the IV assumptions, OLS understated the effect of institutions.
Why is IV larger than OLS?
- The chapter’s explanation, attenuation: measurement error in
avexprbiases OLS toward zero; IV, using a variable unrelated to that error, corrects it - Reverse causation and omitted variables would push OLS up, so a larger IV estimate is consistent with measurement error dominating
- But other readings fit too: with heterogeneous effects, IV estimates a local effect for countries whose institutions were shaped by settler mortality, which need not equal the average effect
- And if the exclusion restriction fails (e.g. the disease environment affects GDP directly), the IV estimate itself is biased
OLS < IV is consistent with attenuation bias. It does not prove it.
Threats: everything rests on the exclusion restriction
- Exclusion: settler mortality reflects the disease environment and geography, which may affect GDP directly, not only through institutions
- Other channels: settlers brought human capital, language and legal origin, not just institutions
- Data critique: the settler-mortality series has been challenged (e.g. Albouy 2012), and re-estimates with revised data are weaker
- Weak-instrument margin: \(F = 16.3\) passes the \(F > 10\) rule, but recent work argues standard \(t\)-tests need a much stronger first stage
- Small sample: 64 countries, so a few influential observations matter
IV is only as good as its story. Settler mortality is a famous and influential instrument, and a heavily debated one.
Case 13.9 · From raw data to final data
Reading · merging · cleaning · the work behind every regression
Most of an empirical project happens before the first regression
Common challenges
- Missing values: drop, impute, or model?
- Outliers: real extremes or typos?
- Units: currencies, inflation, scales
- Frequencies: monthly vs quarterly
- Coding:
"M","m","Male"
Best practices
- Never overwrite raw data
- Script every step (no manual spreadsheet edits)
- Validate: summary stats before and after
- Report how many rows were dropped and why
- Document every decision
Data preparation often takes 60–80% of a project’s time, and every choice can move the final coefficient.
Every case in this chapter wrangled its data first
| Case | Wrangling step | Why it matters |
|---|---|---|
| 13.2 Cobb–Douglas | np.log() of \(Q\), \(K\), \(L\); a time index |
logs make it linear; HAC needs time order |
| 13.3 Phillips | split at 1970; dropna(subset=["inflgdp1yr"]) |
the long and short models must share a sample |
| 13.4 Autos | pre-computed logs (lmpg, lcurbwt, …) |
elasticities without manual transforms |
| 13.5 RAND | keep year == 1 |
one observation per person |
| 13.7 Incumbency | drop missing vote (1,390 → 1,297) |
no outcome, no observation |
Each line changed the estimation sample or the meaning of a coefficient, which is why it belongs in the write-up.
Code: reading formats and merging tables
import pandas as pd                         # tabular data
# data = pd.read_stata("file.dta")          # Stata files
# data = pd.read_csv("file.csv")            # comma-separated text
# data = pd.read_excel("file.xlsx")         # Excel workbooks
df1 = pd.DataFrame({"id": [1, 2, 3], "value_a": [10, 20, 30]})     # table A
df2 = pd.DataFrame({"id": [1, 2, 4], "value_b": [100, 200, 400]})  # table B
print(df1); print(df2)                      # ids 3 and 4 appear in only one table
merged = pd.merge(df1, df2, on="id", how="inner")   # keep ids present in BOTH
print(merged) # the inner join resultOutput: an inner join silently drops non-matching rows
id |
value_a |
|---|---|
| 1 | 10 |
| 2 | 20 |
| 3 | 30 |
df1
id |
value_b |
|---|---|
| 1 | 100 |
| 2 | 200 |
| 4 | 400 |
df2
id |
value_a |
value_b |
|---|---|---|
| 1 | 10 | 100 |
| 2 | 20 | 200 |
merged (inner join): ids 3 and 4 are gone
Always count rows before and after a merge. Lost observations are lost evidence, and can be a source of selection.
Code: cleaning impossible values, gaps and inconsistent codes
import numpy as np                          # np.nan marks missing values
import pandas as pd                         # tabular data
df_dirty = pd.DataFrame({"age": [25, 30, -5, 200, 35],             # two impossible ages
                         "income": [50000, 60000, None, 75000, 80000],  # one missing
                         "gender": ["M", "F", "m", "Female", "M"]})     # inconsistent codes
df_clean = df_dirty.copy()                  # never overwrite the raw data
df_clean.loc[df_clean["age"] < 0, "age"] = np.nan     # impossible: negative age → missing
df_clean.loc[df_clean["age"] > 120, "age"] = np.nan   # impossible: age above 120 → missing
df_clean["income"] = df_clean["income"].fillna(df_clean["income"].median())  # median impute
df_clean["gender"] = df_clean["gender"].str.upper().str[0]   # "m"/"Female" → "M"/"F"
print(df_dirty); print(df_clean) # before and afterOutput: before and after cleaning
age |
income |
gender |
|---|---|---|
| 25 | 50,000 | M |
| 30 | 60,000 | F |
| −5 | NaN | m |
| 200 | 75,000 | Female |
| 35 | 80,000 | M |
raw
age |
income |
gender |
|---|---|---|
| 25 | 50,000 | M |
| 30 | 60,000 | F |
| NaN | 67,500 | M |
| NaN | 75,000 | F |
| 35 | 80,000 | M |
cleaned
Imputation fills the gap with 67,500 (the median of the four observed incomes), but it invents certainty. Flag imputed values and report how many there are.
Reading it right
Act III · The resolution
Four designs, side by side
| RCT (13.5) | DiD (13.6) | RD (13.7) | IV (13.8) | |
|---|---|---|---|---|
| Source of variation | random assignment | group × period | a sharp cutoff | an instrument |
| Identifying assumption | intact randomization | parallel trends | continuity at the cutoff | relevance + exclusion |
| Estimand | average effect in the experiment | effect on the treated (ATT) | effect at the cutoff (local) | local average effect (LATE) |
| Main threat | attrition, non-compliance | pre-trends, other shocks | sorting, functional form | invalid exclusion, weak IV |
| Testable? | covariate balance | pre-trends (more periods) | density, balance at 0 | relevance only (\(F\)) |
| Chapter estimate | −$1,108 (95% plan) | +0.52 z-units | +4.8 pp | 0.94 log points |
Every design buys credibility with an assumption. Know which assumption you bought, and for whom the estimate holds.
Which design fits your question?
- Can you randomize the treatment? Run an RCT
- Does treatment switch on at a known threshold of a score, margin or date? Use RD
- Do you observe treated and untreated groups before and after treatment? Use DiD, and defend parallel trends
- Is there a variable that shifts the treatment but affects the outcome only through it? Use IV, and defend exclusion
- None of these? Then a regression with controls gives a conditional association; use the OVB formula to sign the likely bias
Start from the source of variation, not from the estimator. The estimator is almost always OLS or 2SLS.
Naive vs design: how far apart the numbers were
| Case | Naive comparison | Naive | Design | Design-based |
|---|---|---|---|---|
| 13.3 | bivariate slope, 1970–2014 | +0.265 | add expected inflation | −0.128 |
| 13.6 | treated, before vs after | +0.867 | DiD | +0.522 |
| 13.6 | treated vs control, 1998 only | +0.391 | DiD | +0.522 |
| 13.7 | all winners vs all losers | +21.7 pp | RD at the cutoff | +4.8 pp |
| 13.8 | OLS | 0.522 | 2SLS | 0.944 |
The naive numbers were not slightly off: the wrong sign (13.3), 66% too large or 25% too small (13.6), 4.5× too large (13.7), 45% below the IV estimate (13.8).
The tempting mistake — and the correction
Objection. “Just add enough controls and any regression becomes causal.”
Response. Controls close only the confounders you can measure. In 13.1, five controls left the parent-education slope almost unchanged, and that is no evidence it is causal. In 13.7, comparing winners with losers gives 21.7 points; the cutoff gives 4.8.
Identification comes from the design, not the dataset. Ask “where does the variation come from?” before asking “what is the coefficient?”
Five questions to ask of any coefficient
- Units: levels, logs or both? An elasticity, a semi-elasticity (\(100(e^b-1)\%\)), percentage points, or \(z\)-units?
- Conditional on what? Which variables are held fixed, and which are not?
- Which standard error? HC1, HAC or clustered: does it match how the data were generated?
- Where does the variation come from? Self-selection, randomization, a trend break, a cutoff, an instrument?
- For whom? Everyone (ATE), the treated (ATT), close races (local), or instrument-compliers (LATE)?
The most common misreadings come from skipping question 1: “4.8%” instead of 4.8 percentage points, “0.52 SD” without saying which SD, or “1%” for a percentage-point change.
What to carry forward
- One estimator, nine questions:
pf.feolsfrom school scores to the wealth of nations - Logs give elasticities; the sum of Cobb–Douglas elasticities tests returns to scale
- An omitted variable can flip a sign, and \(E[b_2]=\beta_2+\beta_3\gamma\) says exactly by how much
- Match the standard error to the data:
HC1,NWfor time series,CRV1for groups; in 13.4 clustering changed SEs 6–9× - RCT / DiD / RD / IV each impute the counterfactual differently, and each rests on an assumption you must defend
- Wrangling is modeling: every sample restriction belongs in the write-up