# Google Colab: install packages not included in the default environment
try:
import google.colab
!pip install contextily pyogrio -q
except ImportError:
pass # Local environment — packages already installed
This notebook examines spatial dependence in nighttime luminosity across 520 Indian districts using Local Indicators of Spatial Association (LISA). We apply Local Moran’s I to both the initial level and the growth rate of luminosity per capita, and visualize the results as cluster maps identifying statistically significant spatial clusters (HH, LL) and outliers (HL, LH).
1 Setup
In [4]:
In [5]:
# Importing necessary libraries for data analysis and visualization
import numpy as np
import pandas as pd
pd.set_option('display.max_columns', None)
import matplotlib.pyplot as plt
import matplotlib.image as mpimg # Importing matplotlib image for image plotting
import matplotlib.colors as mcolors
import seaborn as sns
import plotly.express as px
import plotly.graph_objects as go
# Importing libraries for spatial data and visualization
import geopandas as gpd
import folium
from folium import Figure
import contextily as cx
import libpysal
from libpysal import weights
# Exploratory Spatial Data Analysis (ESDA) tools
import mapclassify as mc
import esda
from esda.moran import Moran, Moran_Local
# Spatial plotting tools
import splot
from splot.esda import moran_scatterplot, plot_moran, lisa_cluster, plot_local_autocorrelation
from splot.libpysal import plot_spatial_weights
from splot.mapping import vba_choropleth
# Statistical modeling
import statsmodels.api as sm
import statsmodels.formula.api as smf
import warnings
warnings.filterwarnings('ignore')
RANDOM_SEED = 42
np.random.seed(RANDOM_SEED)2 Data
We load district geometries and nighttime lights variables from the GeoPackage, which already contains the 520-district sample merged with all analysis variables.
In [7]:
# Load data (local ../data first, else download from the public repo)
import urllib.request, tempfile, os
local_gpkg = os.path.join("..", "data", "maps", "india_2001_520.gpkg")
url = "https://raw.githubusercontent.com/quarcs-lab/project2025s-py/main/data/maps/india_2001_520.gpkg"
if os.path.exists(local_gpkg):
gdf = gpd.read_file(local_gpkg, engine="pyogrio")
else:
temp_gpkg = os.path.join(tempfile.gettempdir(), "india_2001_520.gpkg")
urllib.request.urlretrieve(url, temp_gpkg)
gdf = gpd.read_file(temp_gpkg, engine="pyogrio")In [8]:
# Rename key variables for convenience
gdf = gdf.rename(columns={
"newdata_light_growth96_10rcr_cap": "growth",
"newdata_log_light96_rcr_cap": "log_initial",
"NAME2_": "district",
})
# Convert from string to numeric (GeoPackage stores these as text)
gdf["growth"] = pd.to_numeric(gdf["growth"], errors="coerce")
gdf["log_initial"] = pd.to_numeric(gdf["log_initial"], errors="coerce")
print(f"Districts: {len(gdf)}")
gdf[["district", "growth", "log_initial"]].describe()Districts: 520| growth | log_initial | |
|---|---|---|
| count | 520.000000 | 520.000000 |
| mean | 0.023523 | -4.818477 |
| std | 0.043073 | 1.093441 |
| min | -0.095267 | -8.468901 |
| 25% | -0.001208 | -5.488250 |
| 50% | 0.022962 | -4.549616 |
| 75% | 0.037141 | -3.952151 |
| max | 0.282837 | -2.182392 |
The interactive choropleth below maps per capita luminosity growth across all 520 districts. Hover over individual districts to inspect their values.
In [10]:
# Visualize spatial data using the explore() method of a GeoDataFrame
gdf.explore(
# Specify the column to visualize on the map
column='growth',
# Specify the attributes to display in the tooltip when hovering over map features
tooltip=['district', 'log_initial', 'growth'],
# Choose the classification scheme for data visualization
scheme='fisherjenks',
# Specify the number of classes for classification
k=5,
# Choose the colormap for data visualization
cmap='coolwarm',
# Specify whether to display a legend
legend=True,
# Choose the basemap tiles provider
tiles='CartoDB positron',
# Customize the style of the basemap tiles
style_kwds=dict(color="gray", weight=0.5),
# Customize the appearance of the legend
legend_kwds=dict(colorbar=False)
)Make this Notebook Trusted to load map: File -> Trust Notebook
In [11]:
# Reproject once to Web Mercator for basemap overlay
_gdf = gdf.to_crs(epsg=3857).copy()
# Classify both variables (Fisher-Jenks, k=5)
clf_init = mc.FisherJenks(_gdf["log_initial"], k=5)
clf_growth = mc.FisherJenks(_gdf["growth"], k=5)
_gdf["init_class"] = clf_init.yb
_gdf["growth_class"] = clf_growth.yb
# Discrete colormap with 5 bins (close to the interactive map style)
cmap = plt.get_cmap("coolwarm", 5)
bounds = np.arange(-0.5, 5.5, 1)
norm = mcolors.BoundaryNorm(bounds, cmap.N)
# Plot: two panels
fig, ax = plt.subplots(1, 2, figsize=(16, 8))
# Left: initial luminosity (log)
_gdf.plot(
column="init_class",
cmap=cmap,
norm=norm,
linewidth=0.25,
edgecolor="gray",
ax=ax[0],
)
cx.add_basemap(ax[0], source=cx.providers.CartoDB.Positron, attribution=False)
cx.add_basemap(ax[0], source=cx.providers.CartoDB.PositronOnlyLabels, attribution=False)
ax[0].set_axis_off()
ax[0].set_title("(a) Initial luminosity per capita (log, 1996)")
# Right: growth
_gdf.plot(
column="growth_class",
cmap=cmap,
norm=norm,
linewidth=0.25,
edgecolor="gray",
ax=ax[1],
)
cx.add_basemap(ax[1], source=cx.providers.CartoDB.Positron, attribution=False)
cx.add_basemap(ax[1], source=cx.providers.CartoDB.PositronOnlyLabels, attribution=False)
ax[1].set_axis_off()
ax[1].set_title("(b) Luminosity growth per capita (1996–2010)")
# Legends (one per panel, with variable-specific breaks)
handles = [
plt.Line2D([0], [0], marker='s', linestyle='', markersize=9,
markerfacecolor=cmap(i), markeredgecolor='none')
for i in range(5)
]
# Left legend labels
init_min = float(_gdf["log_initial"].min())
init_labels = [
f"{(clf_init.bins[i-1] if i>0 else init_min):.2f} to {clf_init.bins[i]:.2f}"
for i in range(5)
]
ax[0].legend(handles, init_labels, title="Initial luminosity", loc="lower left", frameon=True)
# Right legend labels
growth_min = float(_gdf["growth"].min())
growth_labels = [
f"{(clf_growth.bins[i-1] if i>0 else growth_min):.2f} to {clf_growth.bins[i]:.2f}"
for i in range(5)
]
ax[1].legend(handles, growth_labels, title="Luminosity growth", loc="lower left", frameon=True)
plt.tight_layout()
plt.show()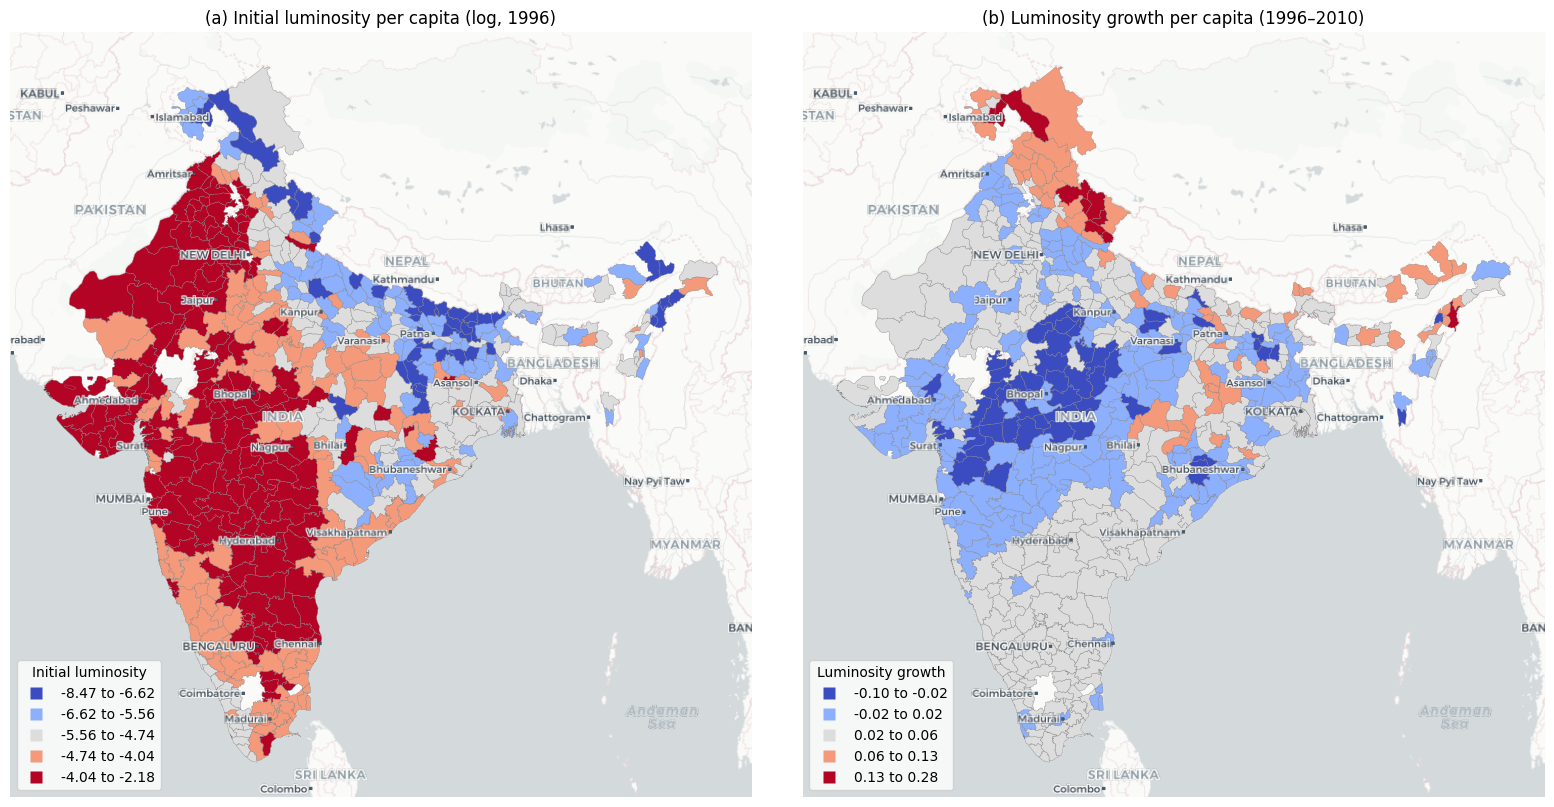
Notes: Districts are classified into five categories using Fisher-Jenks natural breaks. Panel (a) shows log of luminosity per capita in 1996. Panel (b) shows luminosity growth per capita over 1996–2010.
Source: Data from Chanda and Kabiraj (2020). See Spatial dependence notebook for source code.
3 Spatial weights and lags
We construct a 6 nearest neighbors (6NN) spatial weights matrix from the district geometries and row-normalize it, consistent with the weights used in the main econometric analysis.
The neighbors of each district are the six districts whose centroids are nearest in the geographic coordinates of the source file. We then compute the spatial lag of each variable, which is the weighted average of the values of neighboring districts.
In [14]:
# Generate and export weight matrix
W = weights.KNN.from_dataframe(gdf, k=6, ids = 'Census_no')
W_matrix, ids = W.full()
df_W_matrix = pd.DataFrame(W_matrix)
df_ids = pd.DataFrame({'polyID': ids})
try:
df_W_matrix.to_csv('../data/W_matrix.csv', index = False)
df_W_matrix.to_stata('../data/W_matrix.dta', write_index = False)
except OSError:
pass # Skip file export when running in Colab
print(f"Weights: {W.n} observations, mean neighbors = {W.mean_neighbors:.1f}")Weights: 520 observations, mean neighbors = 6.0In [15]:
# Row-standardize W
W.transform = 'r'In [16]:
# Plot the spatial weights matrix
# This will visualize the spatial relationships between observations defined by the weights matrix W
fig, ax = plt.subplots(ncols=1, nrows=1, figsize=(14,10))
plot_spatial_weights(W, gdf, indexed_on='Census_no', ax=ax)
cx.add_basemap(ax, crs=gdf.crs.to_string(), source=cx.providers.CartoDB.Positron, attribution=False)
cx.add_basemap(ax, crs=gdf.crs.to_string(), source=cx.providers.CartoDB.PositronOnlyLabels, attribution=False)
ax.set_axis_off()
plt.show()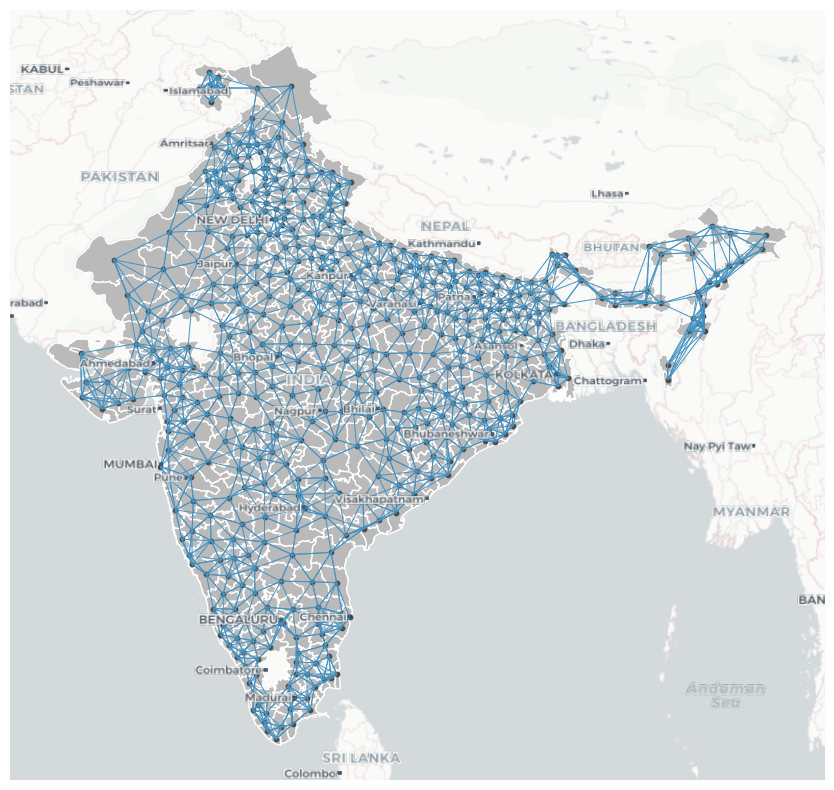
Notes: Each node represents a district centroid. Each edge connects a district to one of its six geographically closest neighbors. The weight matrix is row-standardized.
Source: Data from Chanda and Kabiraj (2020). See Spatial dependence notebook for source code.
In [17]:
# Calculate spatial lag of INDICATOR1 using the specified weights
gdf['Wlog_initial'] = weights.lag_spatial(W, gdf['log_initial'])
gdf['Wgrowth'] = weights.lag_spatial(W, gdf['growth'])4 Spatial dependence for initial (log) luminosity
Global Moran’s I summarizes the overall degree of spatial autocorrelation across all districts. Values near +1 indicate strong positive clustering; values near 0 indicate spatial randomness.
In [20]:
# Create a scatter plot using Plotly Express
px.scatter(
gdf,
x='log_initial', # Data for the x-axis
y='Wlog_initial', # Data for the y-axis
hover_name='district', # Display district name in hover tooltip
hover_data=['district', 'log_initial', 'Wlog_initial'], # Additional data to display in hover tooltip
trendline="ols", # Add an ordinary least squares (OLS) trendline
marginal_x="box", # Display marginal box plot on the x-axis
marginal_y="box" # Display marginal box plot on the y-axis
)Unable to display output for mime type(s): application/vnd.plotly.v1+jsonIn [21]:
# Compute Global Moran's I statistic for the 'log_initial' variable using the spatial weights matrix W
globalMoran = Moran(gdf['log_initial'], W)
# Format Moran's I statistic to two decimal places
moranI1 = "{:.2f}".format(globalMoran.I)
# Print Moran's I statistic
moranI1'0.73'While Global Moran’s I captures the overall pattern, Local Moran’s I (LISA) identifies where significant clusters and outliers are located. Each district is classified into one of four quadrants: High-High (HH, red), Low-Low (LL, blue), High-Low (HL, orange), or Low-High (LH, light blue). The Moran scatterplot shows all districts by quadrant, while the cluster map reveals their geographic distribution.
In [23]:
print(globalMoran.p_sim)0.001In [24]:
# Calculate Local Moran's I statistics
moranLocal = Moran_Local(gdf['log_initial'], W, permutations=999, seed=12345)In [25]:
# Initialize the subplots
f, ax = plt.subplots(1, 2, figsize=(14, 7))
# 1. Plot Moran Scatterplot and customize labels
moran_scatterplot(moranLocal, p=0.05, zstandard=False, aspect_equal=f, ax=ax[0])
ax[0].set_title(f"(a) Moran scatterplot (Moran's I = {moranI1})", fontsize=14)
ax[0].set_xlabel("Log of luminosity per capita 1996", fontsize=12)
ax[0].set_ylabel("Log of luminosity per capita 1996 in neighboring regions", fontsize=12)
# 2. Plot LISA Cluster map and customize title
lisa_cluster(moranLocal, gdf, p=0.05,
legend_kwds={'bbox_to_anchor':(1.05, 1), 'loc': 'upper left'},
ax=ax[1])
ax[1].set_title("(b) LISA Cluster Map (p < 0.05)", fontsize=14)
# 3. Add basemap to the cluster map
cx.add_basemap(ax[1],
crs=gdf.crs.to_string(),
source=cx.providers.CartoDB.Positron,
attribution=False)
# Optional: Remove axes ticks for the map to make it cleaner
ax[1].set_axis_off()
plt.tight_layout()
try:
plt.savefig("../images/lisaMAP1.png", dpi=150, bbox_inches='tight')
except OSError:
pass # Skip file export when running in Colab
plt.show()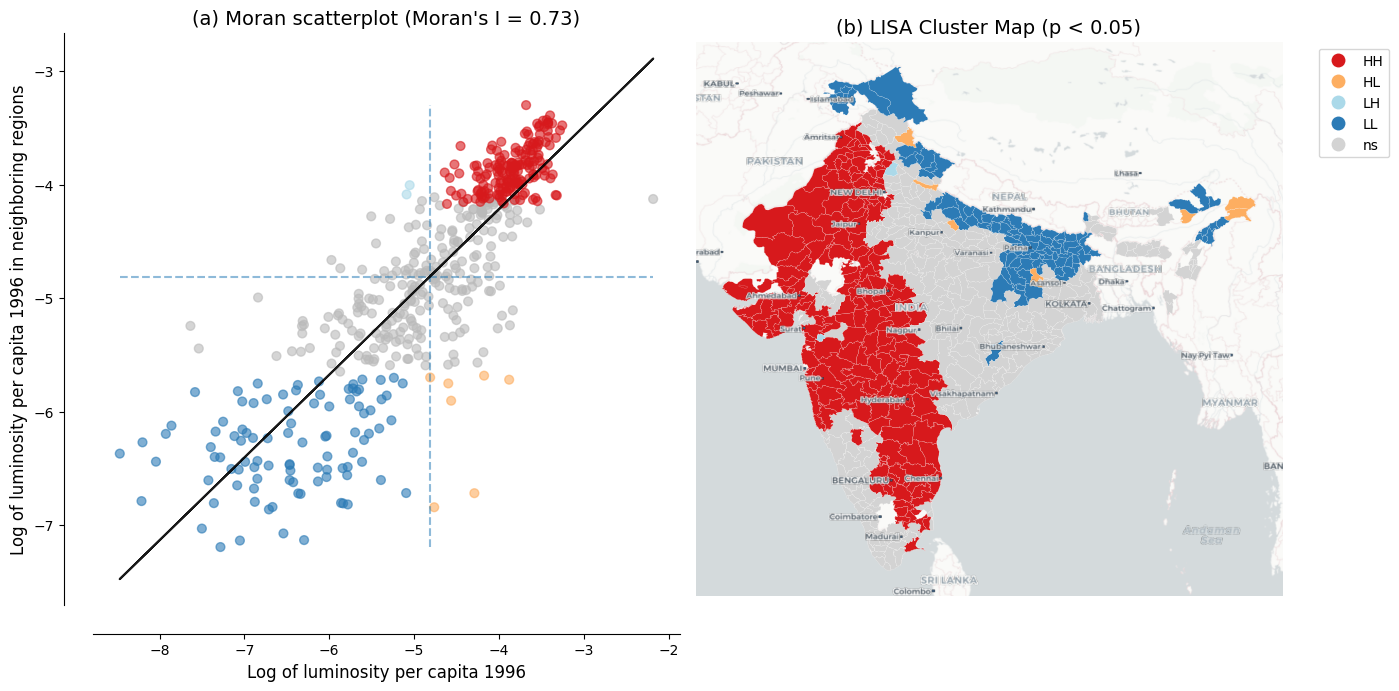
Notes: Panel (a) shows the Moran scatterplot with Global Moran’s I statistic. Panel (b) shows the LISA cluster map with statistically significant clusters at p < 0.05 based on 999 permutations.
Source: Data from Chanda and Kabiraj (2020). See Spatial dependence notebook for source code.
5 Spatial dependence for luminosity growth
Global Moran’s I for growth confirms significant positive spatial autocorrelation. We proceed to the local analysis.
In [28]:
# Create a scatter plot using Plotly Express
px.scatter(
gdf,
x='growth', # Data for the x-axis
y='Wgrowth', # Data for the y-axis
hover_name='district', # Display district name in hover tooltip
hover_data=['district', 'growth', 'Wgrowth'], # Additional data to display in hover tooltip
trendline="ols", # Add an ordinary least squares (OLS) trendline
marginal_x="box", # Display marginal box plot on the x-axis
marginal_y="box" # Display marginal box plot on the y-axis
)Unable to display output for mime type(s): application/vnd.plotly.v1+jsonIn [29]:
# Compute Global Moran's I statistic for the 'growth' variable using the spatial weights matrix W
globalMoran2 = Moran(gdf['growth'], W)
# Format Moran's I statistic to two decimal places
moranI2 = "{:.2f}".format(globalMoran2.I)
# Print Moran's I statistic
moranI2'0.60'In [30]:
print(globalMoran2.p_sim)0.001The LISA cluster map for growth reveals the geographic pattern of convergence dynamics: HH clusters mark regions where both the district and its neighbors grew fast, while LL clusters identify persistently slow-growing areas. Together with the initial luminosity results above, these local patterns support the use of spatial econometric models to account for spatial spillovers in the convergence process.
In [32]:
# Calculate Local Moran's I statistics
moranLocal2 = Moran_Local(gdf['growth'], W, permutations=999, seed=12345)In [33]:
# Initialize the subplots
f, ax = plt.subplots(1, 2, figsize=(14, 7))
# 1. Plot Moran Scatterplot and customize labels
moran_scatterplot(moranLocal2, p=0.05, zstandard=False, aspect_equal=f, ax=ax[0])
ax[0].set_title(f"(a) Moran scatterplot (Moran's I = {moranI2})", fontsize=14)
ax[0].set_xlabel("Growth luminosity per capita 1996-2010", fontsize=12)
ax[0].set_ylabel("Growth luminosity per capita 1996-2010 in neighboring regions", fontsize=12)
# 2. Plot LISA Cluster map and customize title
lisa_cluster(moranLocal2, gdf, p=0.05,
legend_kwds={'bbox_to_anchor':(1.05, 1), 'loc': 'upper left'},
ax=ax[1])
ax[1].set_title("(b) LISA Cluster Map (p < 0.05)", fontsize=14)
# 3. Add basemap to the cluster map
cx.add_basemap(ax[1],
crs=gdf.crs.to_string(),
source=cx.providers.CartoDB.Positron,
attribution=False)
# Optional: Remove axes ticks for the map to make it cleaner
ax[1].set_axis_off()
plt.tight_layout()
try:
plt.savefig("../images/lisaMAP2.png", dpi=150, bbox_inches='tight')
except OSError:
pass # Skip file export when running in Colab
plt.show()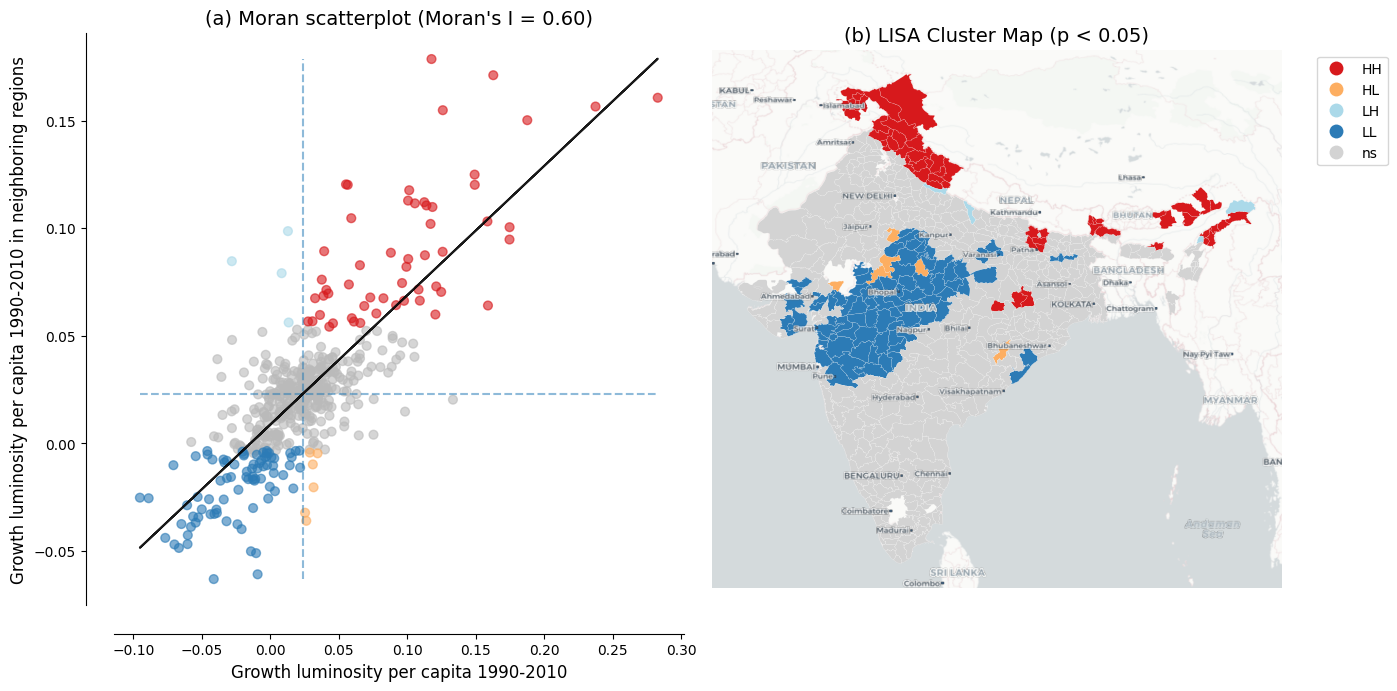
Notes: Panel (a) shows the Moran scatterplot with Global Moran’s I statistic. Panel (b) shows the LISA cluster map with statistically significant clusters at p < 0.05 based on 999 permutations.
Source: Data from Chanda and Kabiraj (2020). See Spatial dependence notebook for source code.