Where one cross-section runs out
Act I · The tension
A slope is only as good as the variation behind it
A regression slope compares observations. With one cross-section, the only comparison is across units: big-market teams versus small-market teams, rich countries versus poor ones. Whatever else differs between them rides along in the slope.
This chapter adds two new sources of variation and one warning:
- Panel data: the same unit over time, so we can compare a unit with itself
- Time series: one unit, many periods, so we must respect order and memory
- Causation: no amount of structure helps if the regressor is correlated with the error
The question running through the whole deck: which variation identifies this coefficient, and which standard error is honest about it?
Ten stops — click any to jump
| Stop | Question | Method | Headline result |
|---|---|---|---|
| 17.2 | Do wins raise NBA revenue? | Pooled OLS, cluster SEs | +0.0068 per win; SE ×1.81 when clustered |
| 17.3 | …holding the team fixed? | Fixed effects (within) | +0.0045 per win (−33%) |
| 17.4 | FE or RE? | Random effects, Hausman | concepts (not estimated) |
| 17.4b | Who earns above $60k? | Logit vs LPM | +6.2 pp per year of schooling |
| 17.5 | Do long rates follow short rates? | Levels, HAC SEs | \(R^2 = 0.95\); HAC SE ×3.65 |
| 17.6 | Is the fit spurious? | Correlogram, differences | lag-1 \(\rho\): 0.95 → 0.25 |
| 17.6b | How fast is pass-through? | ADL(2,2) | 0.74 at once, 0.53 by month 2 |
| 17.7 | When is a slope causal? | IV & the causal toolkit | links to Ch 13 designs |
| CS 1 | Capital and productivity, 108 countries | Panel FE, two-way FE | capital elasticity 0.71 → 0.44 |
| CS 2 | Night lights in 339 municipalities | FE, year effects, FD | population slope +0.34 → −0.82 |
Three data structures, three new problems
| Data | Structure | Size | What goes wrong with plain OLS |
|---|---|---|---|
AED_NBA.DTA |
team × season | 29 teams, 286 obs. | errors correlated within a team; team traits confound the slope |
AED_EARNINGS_COMPLETE.DTA |
cross-section, 0/1 outcome | 872 workers | a straight line predicts “probabilities” outside \([0,1]\) |
AED_INTERESTRATES.DTA |
monthly time series | 397 months | trends fake a relationship; errors are autocorrelated |
| Mendez (2020) | country × year | 108 × 25 | country traits confound capital’s slope |
| DS4Bolivia | municipality × year | 339 × 9 | municipality traits confound population’s slope |
Each structure needs two fixes: one for the coefficient (which variation) and one for the standard error (which dependence).
One estimator, four ways to be honest about uncertainty
| SE type | pyfixest syntax | Allows errors to be… | Used for |
|---|---|---|---|
| Default (iid) | (none) | independent, equal variance | benchmark only |
| Heteroskedasticity-robust | vcov="HC1" |
independent, unequal variance | earnings LPM / logit |
| Cluster-robust | vcov={"CRV1": "teamid"} |
correlated within a cluster, independent across | NBA, CS 1, CS 2 |
| HAC (Newey–West) | vcov="NW", vcov_kwargs={"time_id": ..., "lag": 24} |
correlated across nearby periods | interest rates |
The coefficient never changes with vcov; only SEs, \(t\), \(p\) and CIs do. In this deck the honest SE is 1.8× (NBA), 4× (countries) and 3.65× (rates) the default.
The thread: which variation identifies the slope?
- Pooled OLS uses all variation: between units and within units over time
- Between variation: differences in unit averages (Knicks vs Bucks)
- Within variation: a unit’s deviations from its own average (the Lakers’ good vs bad seasons). Fixed effects use only this
- Changes (\(\Delta y_t\) on \(\Delta x_t\)): period-to-period movements. First differences and time-series regressions in changes use only this
- Levels of two trending series: may be identified by little more than two shared trends, the classic spurious regression
When a coefficient changes as we move from one kind of variation to another, the change itself is evidence about confounding.
Six ideas anchor this chapter
- Panel data: observations indexed by unit \(i\) and time \(t\)
- Within estimator: subtract each unit’s own mean to erase its fixed traits \(\alpha_i\)
- Logit: push \(x'\beta\) through an S-curve so probabilities stay in \([0,1]\)
- AR(\(p\)): regress \(y_t\) on its own past values; persistence and momentum
- ADL: add current and lagged \(x\); cumulative sums of the \(\gamma\)’s trace the dynamic effect
- Hausman test: compares FE and RE; a significant gap rejects RE’s assumption
Each idea answers the same question under harder conditions: what is really driving \(y\)?
Act II-a · Panel data: the same units, again and again
17.2 – 17.4 · pooled OLS, clustering, fixed effects, random effects, logit
17.2 · Do wins raise NBA team revenue?
Panel structure · within vs between · pooled OLS · cluster-robust SEs
The question and the panel
Data. NBA team finances, 2001–02 to 2010–11 (AED_NBA.DTA): 29 teams, 286 team-seasons. Revenue is in millions of dollars.
| Variable | Meaning | Mean | Range |
|---|---|---|---|
revenue |
team revenue, $ millions | 95.7 | 58.5 – 187.7 |
lnrevenue |
log revenue (outcome) | 4.532 | 4.069 – 5.235 |
wins |
regular-season wins (of 82) | 41.0 | 9 – 67 |
playoff |
1 if the team made the playoffs | 0.545 | 0 – 1 |
teamid, season |
the two panel indexes \(i\) and \(t\) | 29 teams × up to 10 seasons |
The panel is unbalanced: 28 teams appear in all 10 seasons, the Bobcats in only 6, so \(N = 286\), not \(29 \times 10 = 290\).
Three ways to use a panel
\[y_{it} = \beta_1 + \beta_2 x_{it} + u_{it}, \qquad i = 1,\dots,n \;(\text{teams}),\; t = 1,\dots,T \;(\text{seasons})\]
- Pooled OLS: ignore the panel structure in estimation; fix the SEs by clustering on \(i\)
- Fixed effects (FE): give each unit its own intercept, \(y_{it} = \alpha_i + \beta_2 x_{it} + \varepsilon_{it}\), and estimate \(\beta_2\) from within-unit changes only
- Random effects (RE): treat \(\alpha_i\) as a random draw, \(u_{it} = \alpha_i + \varepsilon_{it}\), assumed uncorrelated with \(x\); uses a weighted mix of within and between variation
The three estimators differ in which comparison they make, not in arithmetic sophistication.
Code: load the panel and inspect its structure
!pip install -q pyfixest                     # pyfixest is not preinstalled in Colab
import numpy as np                           # numerical operations
import pandas as pd                          # tabular data
import pyfixest as pf                        # OLS / fixed effects with robust and cluster SEs
url = "https://raw.githubusercontent.com/quarcs-lab/data-open/master/AED/AED_NBA.DTA"
data_nba = pd.read_stata(url)                # one row per team-season
print(data_nba.shape)                        # (286, 65): rows, columns
print(data_nba.groupby("teamid").size().value_counts())   # seasons observed per team
data_nba[["revenue", "lnrevenue", "wins", "playoff"]].describe().round(3)Code: split the variation into between and within
\[\underbrace{y_{it}-\bar y}_{\text{overall}} \;=\; \underbrace{\bar y_i-\bar y}_{\text{between}} \;+\; \underbrace{y_{it}-\bar y_i}_{\text{within}}\]
# continues from the previous block
g = data_nba.groupby("teamid")                      # group the rows by team
for v in ["lnrevenue", "wins"]:
    overall = data_nba[v].std()                     # SD over all 286 team-seasons
    between = g[v].mean().std()                     # SD of the 29 team averages
    within = (data_nba[v] - g[v].transform("mean")).std()   # SD of deviations from own mean
print(f"{v:10s} overall {overall:.4f} between {between:.4f} within {within:.4f}")Output: revenue varies across teams, wins vary within teams
| Variable | Overall SD | Between SD | Within SD | Share of variance |
|---|---|---|---|---|
lnrevenue |
0.2360 | 0.2127 | 0.1085 | between ≈ 81% |
wins |
12.44 | 7.04 | 10.36 | within ≈ 69% |
Shares: between variance ÷ overall variance (0.0452 / 0.0557) and within variance ÷ overall variance (107.3 / 154.7).
- Revenue is mostly a team trait: Knicks average $162M, Lakers $150M; Bucks $70M, Grizzlies $74M
- Wins are mostly a season-to-season story: a team’s wins swing more around its own average than team averages differ from each other
Fixed effects throw away 81% of the revenue variance but keep 69% of the wins variance, so the within estimator still has plenty to work with.
Between and within, side by side
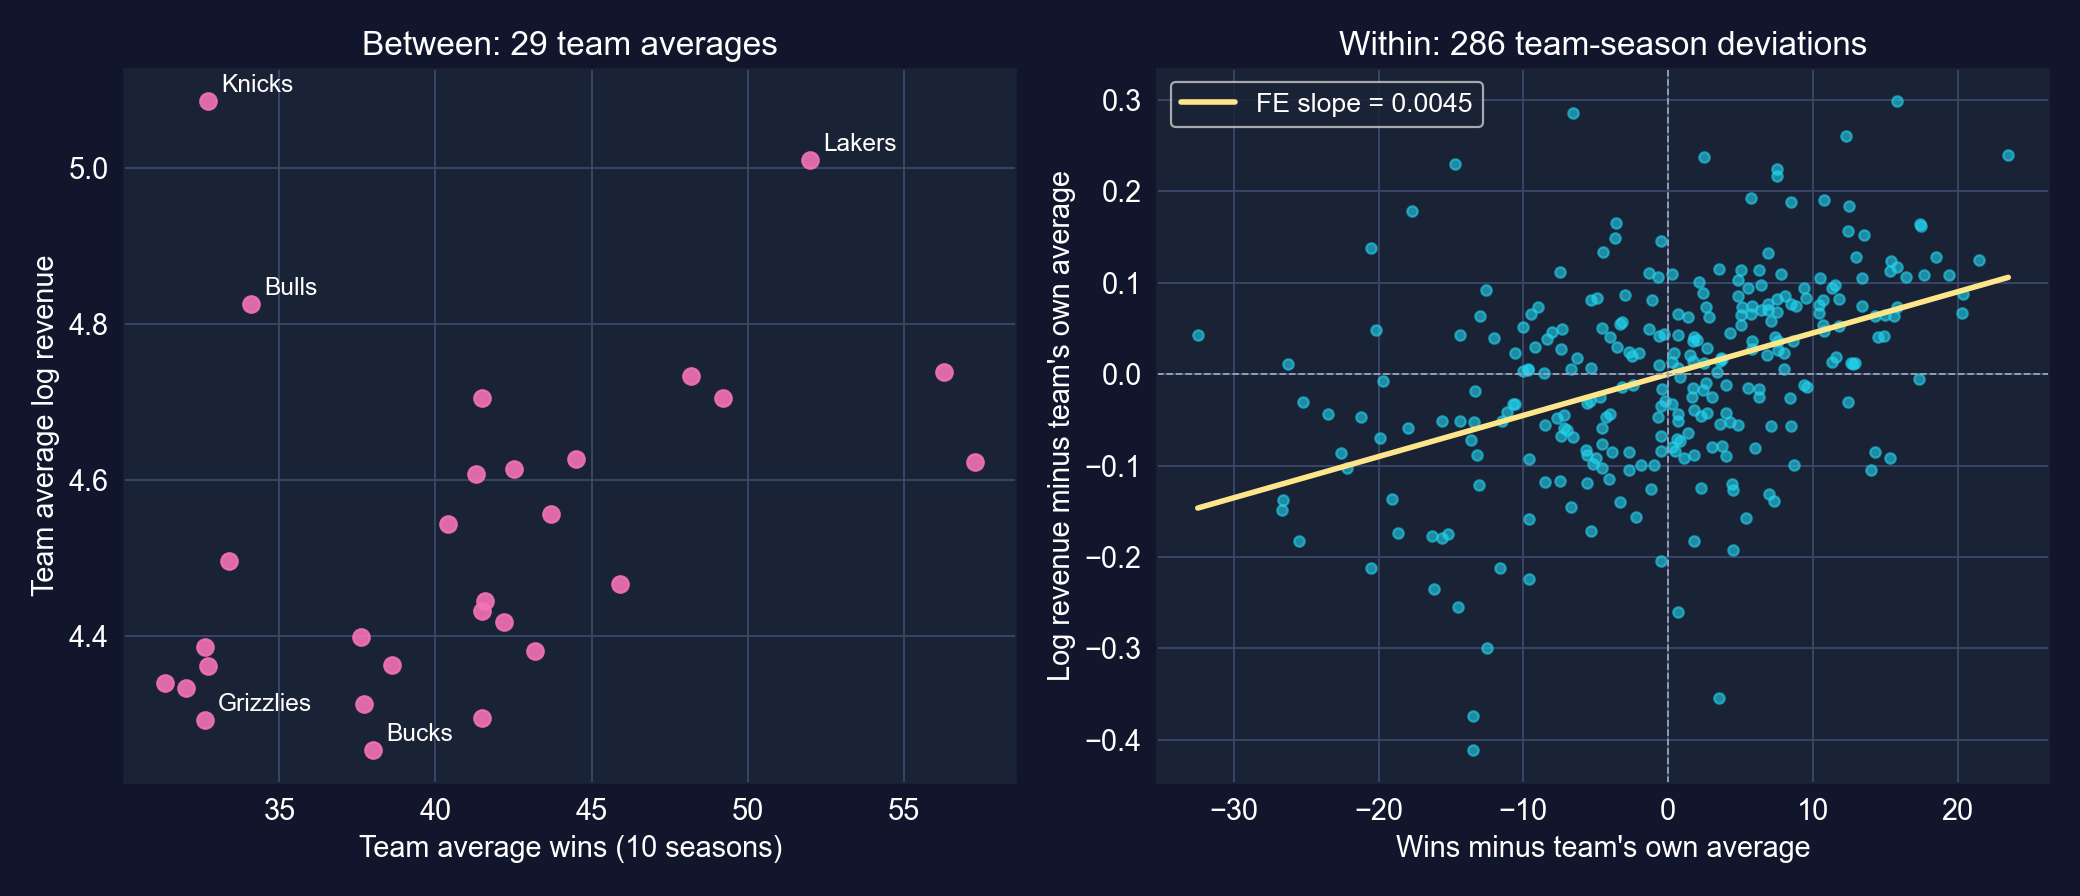
Left: one dot per team (its 10-season averages). Right: each team-season as a deviation from its own team average, with the fixed-effects slope.
The left panel mixes market size with winning (the Knicks earn the most while winning few games). The right panel compares each team only with itself.
The pooled picture mixes both comparisons
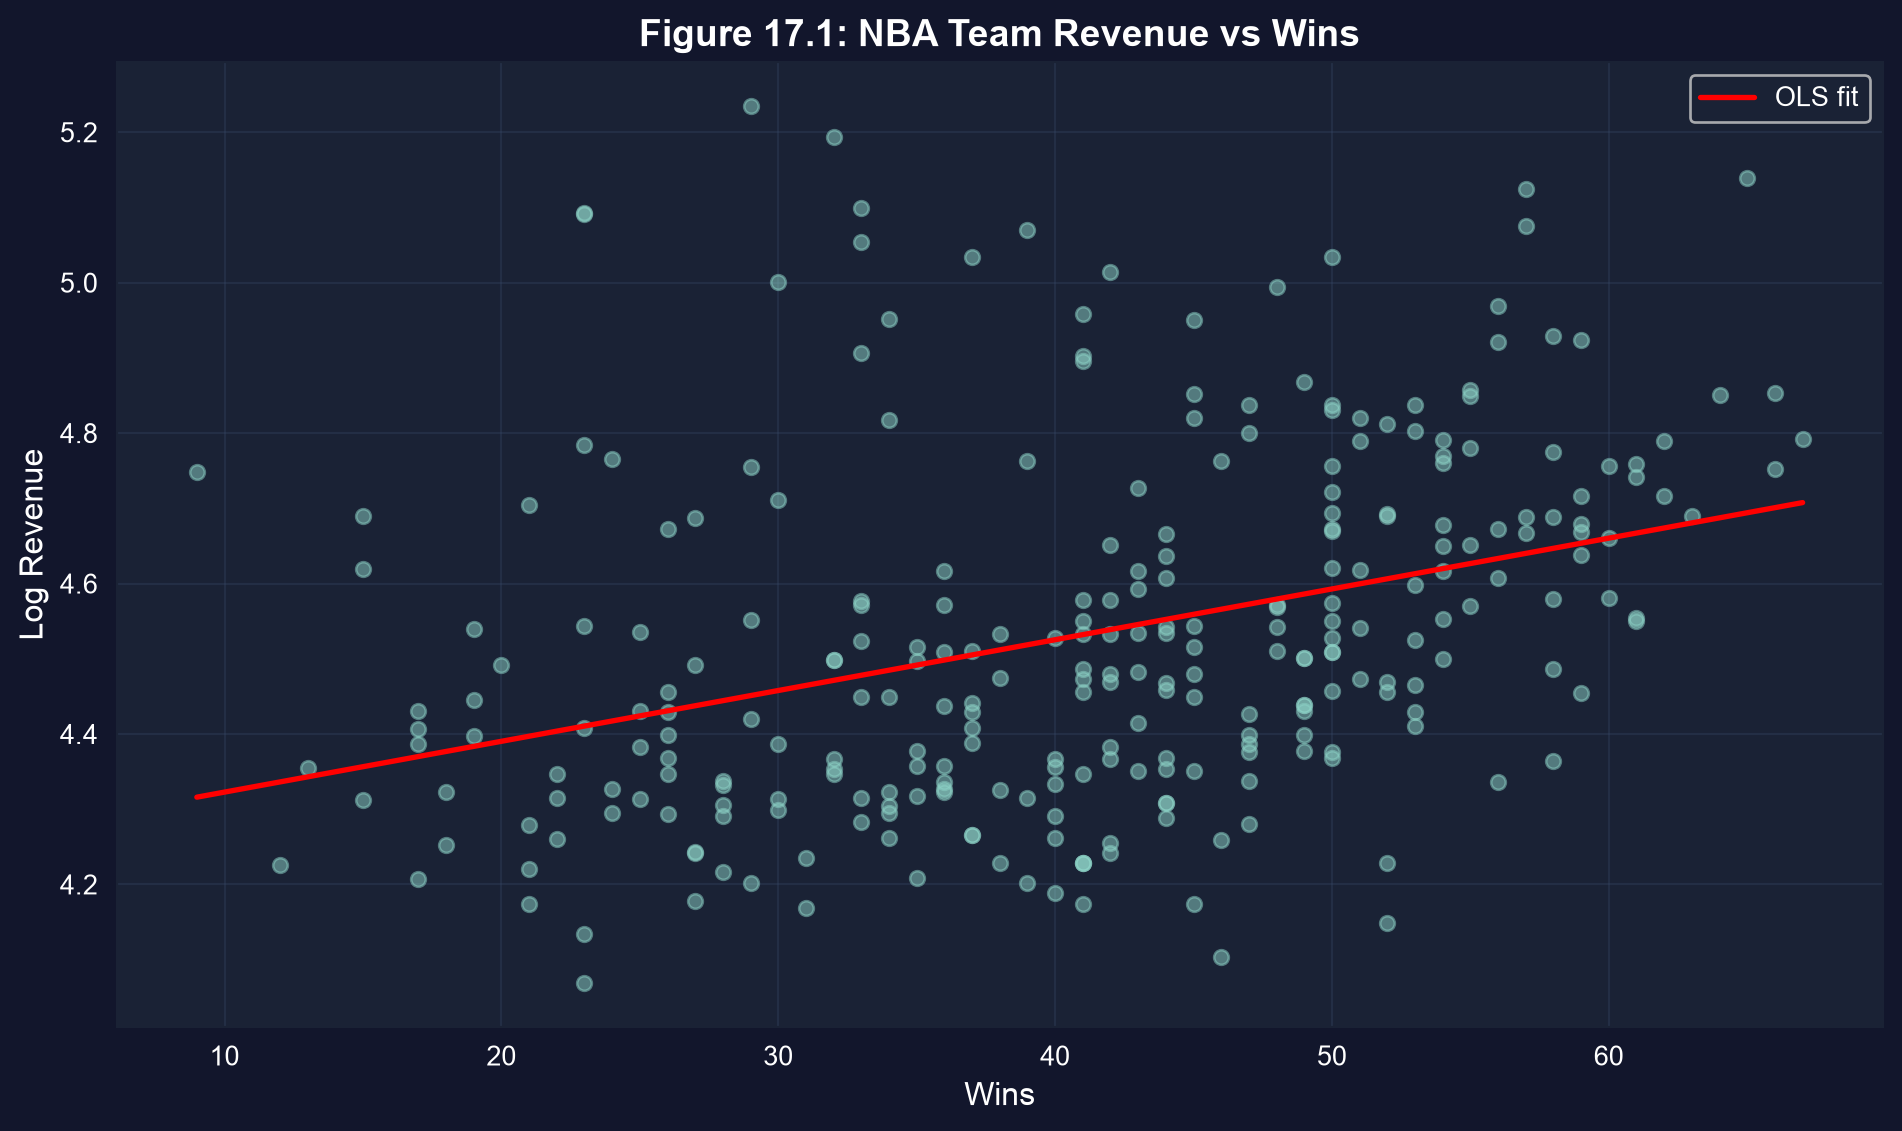
Each dot is a team-season. The pooled OLS line runs through between-team and within-team differences at once.
The pooled slope partly credits winning for market size: big-market teams sit high on the revenue axis whatever their record.
Code: pooled OLS with three kinds of standard errors
# continues from the previous block
f_iid = pf.feols("lnrevenue ~ wins", data=data_nba)                 # default (iid) SEs
f_hc1 = pf.feols("lnrevenue ~ wins", data=data_nba, vcov="HC1")     # heteroskedasticity-robust
fit_pool = pf.feols("lnrevenue ~ wins", data=data_nba, vcov={"CRV1": "teamid"})  # by team
for name, f in [("default", f_iid), ("HC1", f_hc1), ("cluster", fit_pool)]:
    print(name, f.coef()["wins"], f.se()["wins"], f.tstat()["wins"])   # same b, new SE
fit_pool.summary() # full table with cluster-robust SEsOutput: same slope, very different uncertainty
| SE type | Coef. on wins |
SE | \(t\) | \(p\) | 95% CI | SE ÷ default |
|---|---|---|---|---|---|---|
| Default (iid) | 0.00675 | 0.00105 | 6.42 | < 0.001 | [0.00468, 0.00882] | 1.00 |
| HC1 | 0.00675 | 0.00102 | 6.61 | < 0.001 | [0.00474, 0.00876] | 0.97 |
| Cluster by team | 0.00675 | 0.00191 | 3.54 | 0.001 | [0.00284, 0.01066] | 1.81 |
N = 286 · 29 clusters · \(R^2 = 0.127\) (identical in all three rows)
Heteroskedasticity is not the problem here (HC1 ≈ default). Within-team dependence is: allowing for it widens the SE by 81% and halves the \(t\)-statistic.
Why clustering: ten seasons of one team are not ten independent facts
\[\widehat{V}_{\text{CR}}(\hat\beta) = (X'X)^{-1}\Big(\textstyle\sum_{g=1}^{G} X_g'\hat u_g \hat u_g' X_g\Big)(X'X)^{-1}\]
- The middle term sums over clusters \(g\), so every pair of residuals within a team may be correlated; residuals in different teams are assumed independent
- Two sources of within-team correlation: a persistent team effect (the Lakers’ residual is positive every year) and serial correlation (good years follow good years)
- In the limit of perfect correlation, 10 seasons of one team carry the information of 1 observation; the truth lies in between
Clustering must be done at the level where shocks are shared. With \(G = 29\) clusters the \(t\) reference has only \(G - 1 = 28\) degrees of freedom.
Output: the pooled regression, read correctly
| Variable | Coef. | SE | \(t\) | \(p\) | 95% CI |
|---|---|---|---|---|---|
| Intercept | 4.25520 | 0.09572 | 44.45 | < 0.001 | [4.05912, 4.45128] |
wins |
0.00675 | 0.00191 | 3.54 | 0.001 | [0.00284, 0.01066] |
N = 286 · CRV1 SEs clustered by teamid (29 clusters) · \(R^2 = 0.127\)
- Log-level model: one more win goes with \(100 \times 0.00675 \approx 0.68\%\) more revenue (a log-point approximation)
- Ten more wins: \(100\,(e^{10 \times 0.00675}-1) = 7.0\%\)
- \(R^2 = 0.127\): wins describe little of the revenue spread, which is mostly team traits
This is an association across and within teams. Teams that win more also tend to be the rich-market teams, so the slope is not yet “the effect of winning”.
17.3 · Fixed effects: compare each team only with itself
Within transformation · LSDV · what FE absorbs · omitted-variable bias
The fixed-effects model and the within transformation
\[y_{it} = \alpha_i + \beta\,x_{it} + \varepsilon_{it}\]
Average each team’s equation over its seasons and subtract:
\[(y_{it}-\bar y_i) = \beta\,(x_{it}-\bar x_i) + (\varepsilon_{it}-\bar\varepsilon_i)\]
- \(\alpha_i\) disappears: anything constant within a team cannot bias \(\hat\beta\), even if it is correlated with \(x\)
- Same estimate two ways: LSDV (one dummy per team) or de-meaning then OLS
- Price: coefficients on time-invariant regressors cannot be estimated, and only within variation is used
FE swap the assumption “no omitted variables” for the weaker “no omitted variables that change over time within a unit”.
Code: fixed effects, and a check by hand
# continues from the previous block
fit_fe = pf.feols("lnrevenue ~ wins | teamid", data=data_nba,
                  vcov={"CRV1": "teamid"})   # "| teamid" = one intercept per team
fit_fe.summary()                             # within estimator, cluster SEs by team
print(fit_fe._r2_within)                     # share of WITHIN-team variation explained
# check: the same slope from OLS on de-meaned data (the within transformation)
data_nba["dm_lnrev"] = data_nba["lnrevenue"] - g["lnrevenue"].transform("mean")
data_nba["dm_wins"] = data_nba["wins"] - g["wins"].transform("mean")
print(pf.feols("dm_lnrev ~ dm_wins - 1", data=data_nba).coef()) # identical slopeOutput: the within-team slope is a third smaller
| Variable | Coef. | SE | \(t\) | \(p\) | 95% CI |
|---|---|---|---|---|---|
wins |
0.00451 | 0.00084 | 5.35 | < 0.001 | [0.00278, 0.00623] |
N = 286 · 29 team fixed effects · CRV1 SEs by teamid · within \(R^2 = 0.185\) · manual de-meaned OLS slope: 0.00451
| Pooled OLS | Fixed effects | |
|---|---|---|
Coefficient on wins |
0.00675 | 0.00451 |
| Cluster SE | 0.00191 | 0.00084 |
| \(R^2\) | 0.127 (overall) | 0.185 (within) |
Holding the team fixed, the slope falls by 33%, and it is estimated more precisely: removing team effects removed most of the residual noise.
One slope inside each team
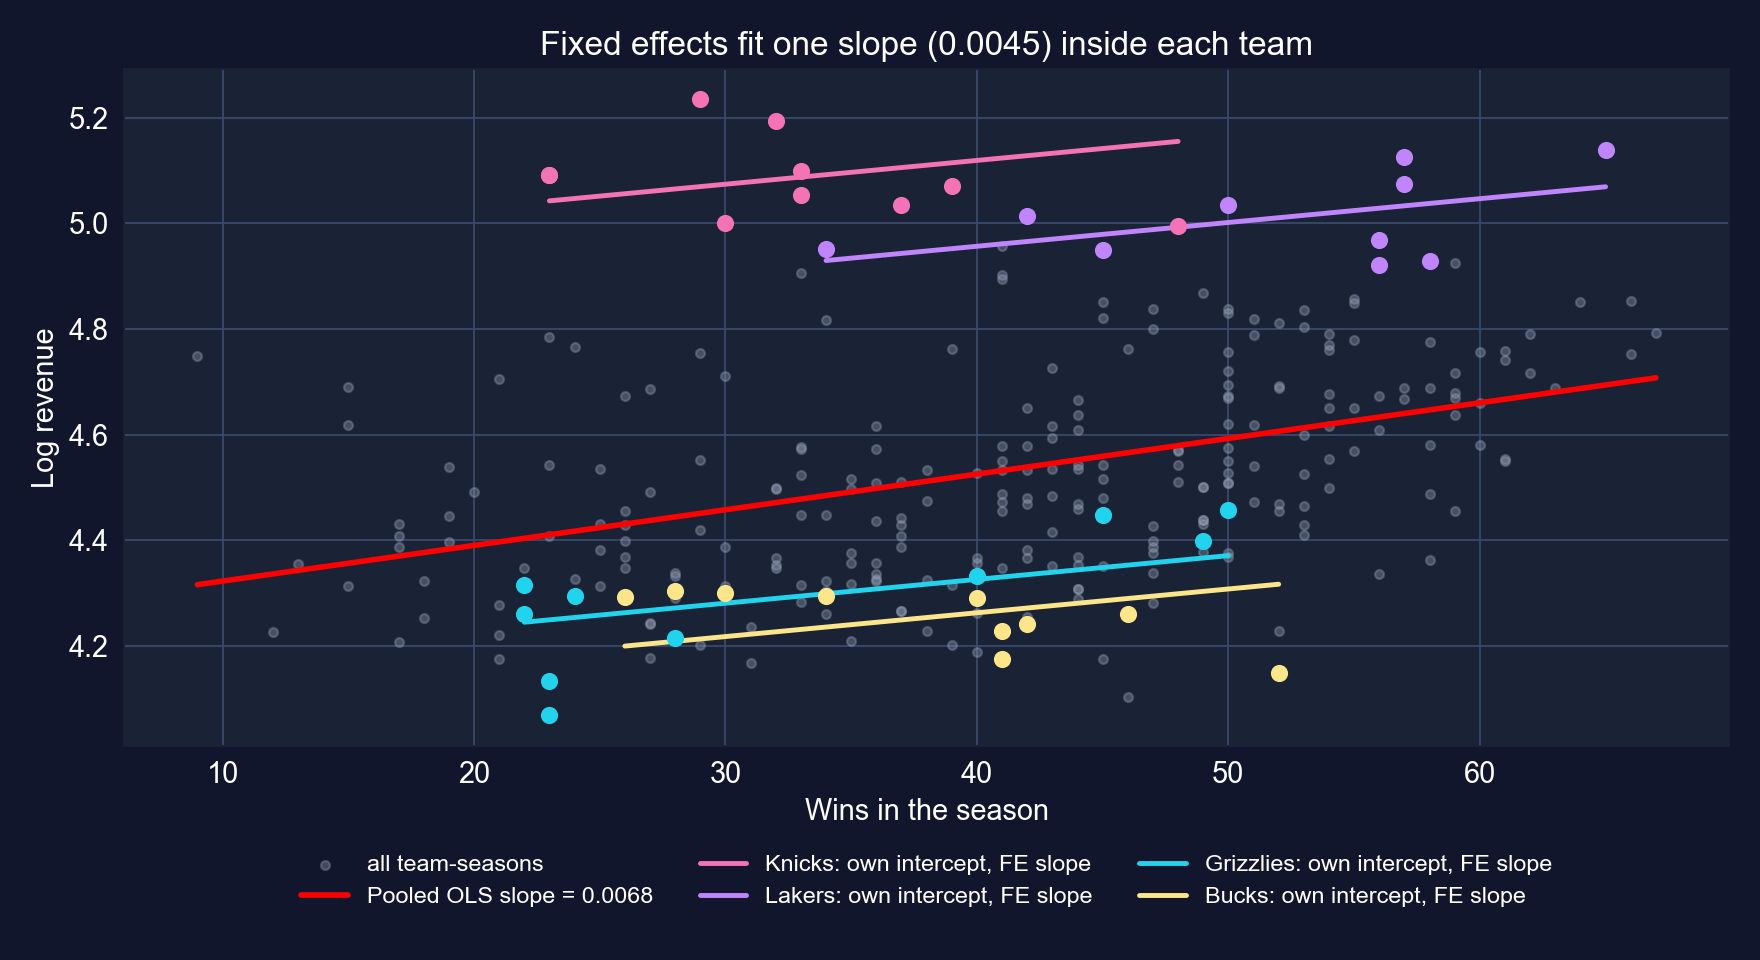
Pooled OLS (red) versus team-specific intercepts with a common fixed-effects slope, for four teams.
Big-market teams (Knicks, Lakers) sit on high lines, small-market teams (Grizzlies, Bucks) on low ones. The pooled line is steeper because it climbs across those lines.
Why the slope fell: omitted-variable bias, signed
\[\text{plim}\;\hat\beta_{\text{pooled}} = \beta + \gamma\,\frac{\text{Cov}(\alpha_i, x_{it})}{\text{Var}(x_{it})}\]
- \(\gamma > 0\): the team effect (market, brand) raises revenue
- \(\text{Cov}(\alpha_i, x_{it}) > 0\): rich-market teams also win somewhat more (team-average revenue and wins correlate 0.40)
- So the pooled slope is biased upward: 0.00675 vs 0.00451, a gap of 0.00225
The direction of the change from pooled to FE is exactly what the omitted-variables formula predicts when the omitted trait helps both \(x\) and \(y\).
What one more win is worth
- Per win: \(100\,(e^{0.00451}-1) = 0.45\%\) more revenue for the same team
- At the sample mean revenue of $95.7M: about $0.43M per win
- Ten more wins than the team’s usual: \(100\,(e^{10 \times 0.00451}-1) = 4.6\%\), about $4.4M
- The pooled slope would have said 7.0% ($6.7M) for ten wins
Winning pays, but far less than the cross-section suggests. Market size, not the win column, is where most revenue differences come from.
What fixed effects can and cannot fix
Absorbed (time-invariant)
- market size and local income level
- arena, franchise history, brand
- ownership style (if stable)
Not absorbed (time-varying)
- a star arrives, a coach changes, injuries
- new arena or TV contract mid-panel
- league-wide shocks (lockouts, recessions)
- revenue → payroll → wins (reverse causality)
FE make the causal reading more plausible, not guaranteed. A natural next step is season fixed effects, | teamid + season, for league-wide shocks.
17.4 · Fixed or random effects?
Random effects · efficiency vs consistency · the Hausman test
Random effects: a team effect assumed unrelated to wins
\[y_{it} = \beta_1 + \beta_2 x_{it} + \underbrace{(\alpha_i + \varepsilon_{it})}_{\text{composite error}}, \qquad \alpha_i \sim (0,\sigma_\alpha^2),\;\; \varepsilon_{it} \sim (0,\sigma_\varepsilon^2)\]
- Key assumption: \(\text{Cov}(\alpha_i, x_{it}) = 0\), i.e. the team effect is unrelated to the regressor
- Estimation: feasible GLS, which partially de-means: \(y_{it} - \theta\,\bar y_i\) with \(\theta = 1 - \sqrt{\sigma_\varepsilon^2 / (\sigma_\varepsilon^2 + T\sigma_\alpha^2)}\)
- \(\theta = 0\) gives pooled OLS, \(\theta = 1\) gives FE; RE sits in between and uses some between variation
RE buys efficiency with an assumption. If big-market teams also win more, the assumption fails and RE inherits part of the pooled bias.
Pooled, RE, FE: what each one compares
| Pooled OLS | Random effects | Fixed effects | |
|---|---|---|---|
| Variation used | between + within, equal weights | within + a fraction \((1-\theta)\) of between | within only |
| Assumes about \(\alpha_i\) | uncorrelated with \(x\) (and ignored) | uncorrelated with \(x\) | nothing; may correlate with \(x\) |
| Consistent if \(\alpha_i\) correlates with \(x\)? | no | no | yes |
| Efficient if it doesn’t? | no | yes | no |
| Time-invariant regressors? | yes | yes | no |
| NBA estimate | 0.00675 | not estimated | 0.00451 |
In observational panels the “no correlation” assumption is rarely credible, so FE is the default and RE needs a justification.
The Hausman test: does RE’s assumption survive?
\[H = (\hat\beta_{FE} - \hat\beta_{RE})'\,\big[\widehat V(\hat\beta_{FE}) - \widehat V(\hat\beta_{RE})\big]^{-1}(\hat\beta_{FE} - \hat\beta_{RE}) \;\sim\; \chi^2_k\]
- \(H_0\): \(\alpha_i\) uncorrelated with the regressors, so both are consistent and RE is efficient: the two estimates should be close
- \(H_a\): correlated, so only FE is consistent: the estimates diverge
- A large \(H\) (small \(p\)) rejects RE; keep FE
The chapter’s code does not run the test; fitting RE separately (as its Key Concepts example reports) gives \(\chi^2 \approx 2.8\), \(p \approx 0.10\): RE is not rejected at 5%, and FE (0.0045) and RE (0.0046) nearly coincide.
Code: what the chapter’s 17.4 cell actually computes
# continues from the previous block (the chapter's 17.4 code)
comparison_table = pd.DataFrame({
    "Pooled OLS": [fit_pool.coef()["wins"], fit_pool.se()["wins"], fit_pool._r2, fit_pool._N],
    "Fixed Effects": [fit_fe.coef()["wins"], fit_fe.se()["wins"], fit_fe._r2_within, fit_fe._N]
}, index=["Wins Coefficient", "Wins Std Error", "R²", "N"])
print(comparison_table) # R² rows differ in kind: overall vs within| Pooled OLS | Fixed effects | |
|---|---|---|
| Wins coefficient | 0.00675 | 0.00451 |
| Std. error (cluster) | 0.00191 | 0.00084 |
| \(R^2\) | 0.127 | 0.185 |
| \(N\) | 286 | 286 |
17.4b · Who earns more than $60,000?
Binary outcomes · linear probability model · logit · marginal effects
The question: education, age and the chance of a high income
Data. 872 full-time workers, 2010 (AED_EARNINGS_COMPLETE.DTA). Outcome: dbigearn = 1 if annual earnings exceed $60,000.
| Variable | Meaning | Mean |
|---|---|---|
dbigearn |
1 if earnings > $60,000 (238 workers) | 0.273 |
education |
years of schooling (0–20) | 13.85 |
age |
years | 43.3 |
- Linear probability model (LPM): \(\Pr(y=1\mid x) = x'\beta\); slopes are probability changes, but fitted values can leave \([0,1]\)
- Logit: \(\Pr(y=1\mid x) = \dfrac{e^{x'\beta}}{1+e^{x'\beta}}\); always in \((0,1)\), but \(\beta_j\) is in log-odds units
Logit’s marginal effect \(\partial p/\partial x_j = p(1-p)\,\beta_j\) changes with \(p\), so you must say where you evaluate it.
Code: build the binary outcome and fit the logit
!pip install -q pyfixest                      # pyfixest is not preinstalled in Colab
import pandas as pd                           # tabular data
import pyfixest as pf                         # OLS for the linear probability model
from statsmodels.formula.api import logit     # logit with R-style formulas
url = "https://raw.githubusercontent.com/quarcs-lab/data-open/master/AED/AED_EARNINGS_COMPLETE.DTA"
data_earnings = pd.read_stata(url)            # 872 full-time workers, 2010
data_earnings["dbigearn"] = (data_earnings["earnings"] > 60000).astype(int)  # 1 = high earner
print(data_earnings["dbigearn"].mean())       # share of high earners
model_logit = logit("dbigearn ~ age + education", data=data_earnings).fit(cov_type="HC1", disp=0)
print(model_logit.summary()) # coefficients in log-odds units, robust SEsOutput: logit coefficients are log-odds, not probabilities
| Variable | Coef. | SE | \(z\) | \(p\) |
|---|---|---|---|---|
| Intercept | −8.0651 | 0.6914 | −11.67 | < 0.001 |
age |
0.0385 | 0.0080 | 4.85 | < 0.001 |
education |
0.3742 | 0.0366 | 10.22 | < 0.001 |
N = 872 · share with dbigearn = 1: 0.273 · HC1 SEs · McFadden pseudo-\(R^2 = 0.145\)
- Sign and significance read as usual: older and more educated workers are more likely to earn above $60k
- Size does not: one more year of schooling multiplies the odds by \(e^{0.3742} = 1.45\)
- To talk about probabilities we need marginal effects
A logit coefficient of 0.37 is not “37 percentage points”. It is a change in log-odds.
Code: marginal effects and the linear probability model
# continues from the previous block
ame = model_logit.get_margeff()               # default at="overall": AVERAGE marginal effects
mem = model_logit.get_margeff(at="mean")      # marginal effects AT THE MEANS of age, education
print(ame.summary()); print(mem.summary())
fit_lpm = pf.feols("dbigearn ~ age + education", data=data_earnings, vcov="HC1")
fit_lpm.summary()                             # slopes are directly probability changes
p_lpm = fit_lpm.predict()                     # LPM fitted "probabilities"
print((p_lpm < 0).sum(), p_lpm.min()) # how many fall below zero?Output: three answers to “one more year of schooling”
| Effect on \(\Pr(\text{earnings} > \$60\text{k})\) | education |
SE | age |
SE |
|---|---|---|---|---|
Logit, average marginal effect (get_margeff()) |
0.0618 | 0.0047 | 0.0064 | 0.0013 |
Logit, marginal effect at the means (at="mean") |
0.0662 | 0.0062 | 0.0068 | 0.0014 |
| Linear probability model (OLS, HC1) | 0.0540 | 0.0050 | 0.0064 | 0.0013 |
LPM: N = 872 · \(R^2 = 0.142\) · 95% CI for education [0.0442, 0.0639]
One more year of schooling raises the probability of earning above $60k by about 6.2 percentage points on average (logit), or 5.4 (LPM). Same sign, similar size.
Where the two models part ways
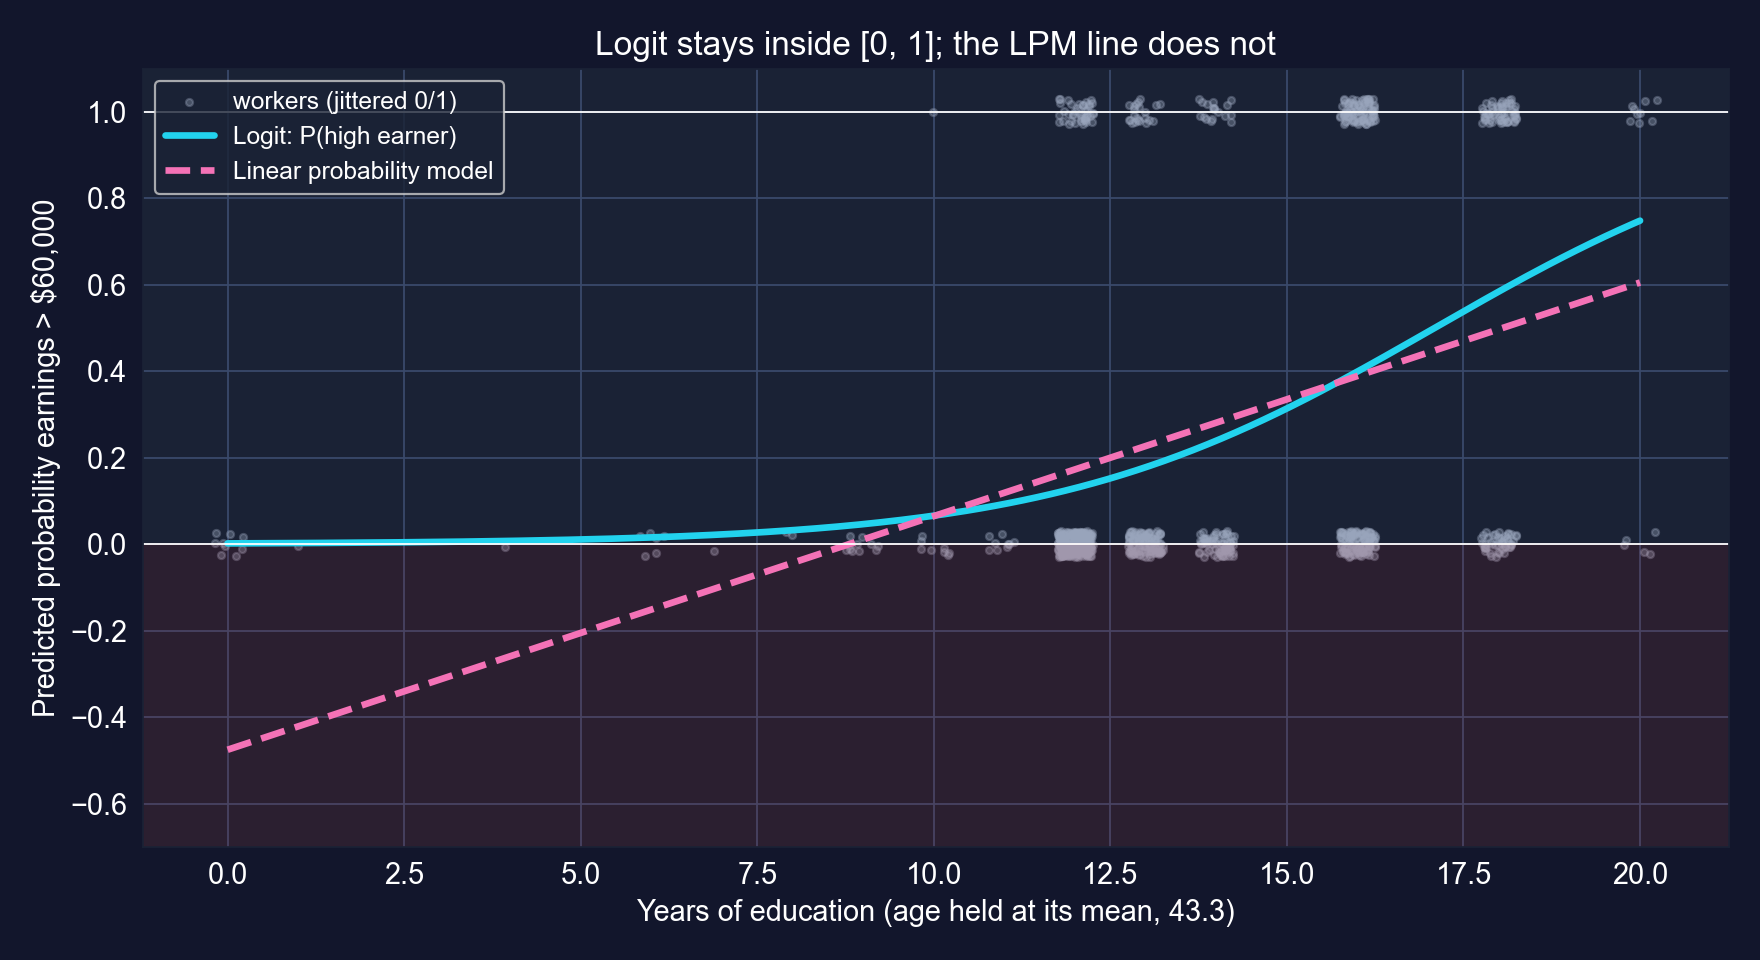
Predicted probability by years of education, age fixed at its mean. Shaded: impossible negative “probabilities”.
In the data, 30 of 872 LPM fitted values are negative (minimum −0.59). Every logit prediction stays between 0.001 and 0.86.
Reading the logit honestly
- Report marginal effects, and say which: average (AME) or at the means (MEM). They differ here by 0.004
- LPM is a fine first pass for average effects near the middle of the data; use logit (or probit) for predictions and for the tails
- Association, not return to schooling: ability, family background and occupation choice correlate with education and with earnings
- The cut-off is arbitrary: $60,000 discards most of the information in
earnings, which the log-earnings regressions of earlier chapters use in full
A binary model changes the scale of the answer, not the identification problem.
Act II-b · Time series: order and memory
17.5 – 17.6 · stationarity, spurious regression, HAC, autocorrelation, AR and ADL
17.5 · Do long rates follow short rates?
Stationarity · spurious regression · levels with a trend · Newey–West HAC
The question and the data
Data. Monthly U.S. Treasury yields, January 1982 – January 2015: 397 months (AED_INTERESTRATES.DTA).
| Variable | Meaning | Mean | Range |
|---|---|---|---|
gs10 |
10-year Treasury rate, % | 6.19 | 1.53 – 14.59 |
gs1 |
1-year Treasury rate, % | 4.69 | 0.10 – 14.73 |
dgs10 |
monthly change in gs10, percentage points |
−0.03 | −1.43 – 0.78 |
dgs1 |
monthly change in gs1, percentage points |
−0.04 | −1.81 – 0.76 |
Economic question: how much of a move in short rates (which the Fed influences) passes through to long rates (which matter for mortgages and investment)?
Three time-series ideas to keep in view
- Autocorrelation at lag \(k\): \(r_k = \dfrac{\sum_{t=k+1}^{T}(y_t-\bar y)(y_{t-k}-\bar y)}{\sum_{t=1}^{T}(y_t-\bar y)^2}\). Today resembles yesterday
- Stationarity: mean, variance and autocorrelations do not change over time. Trending series are non-stationary
- Spurious regression: regress one trending series on another and you get a high \(R^2\) and huge \(t\)-statistics even with no structural link
With trending data a large \(R^2\) is a warning, not a reward. Two cures: difference the data, or keep levels and use HAC standard errors (and think hard).
Both rates drift down from 14% to near zero
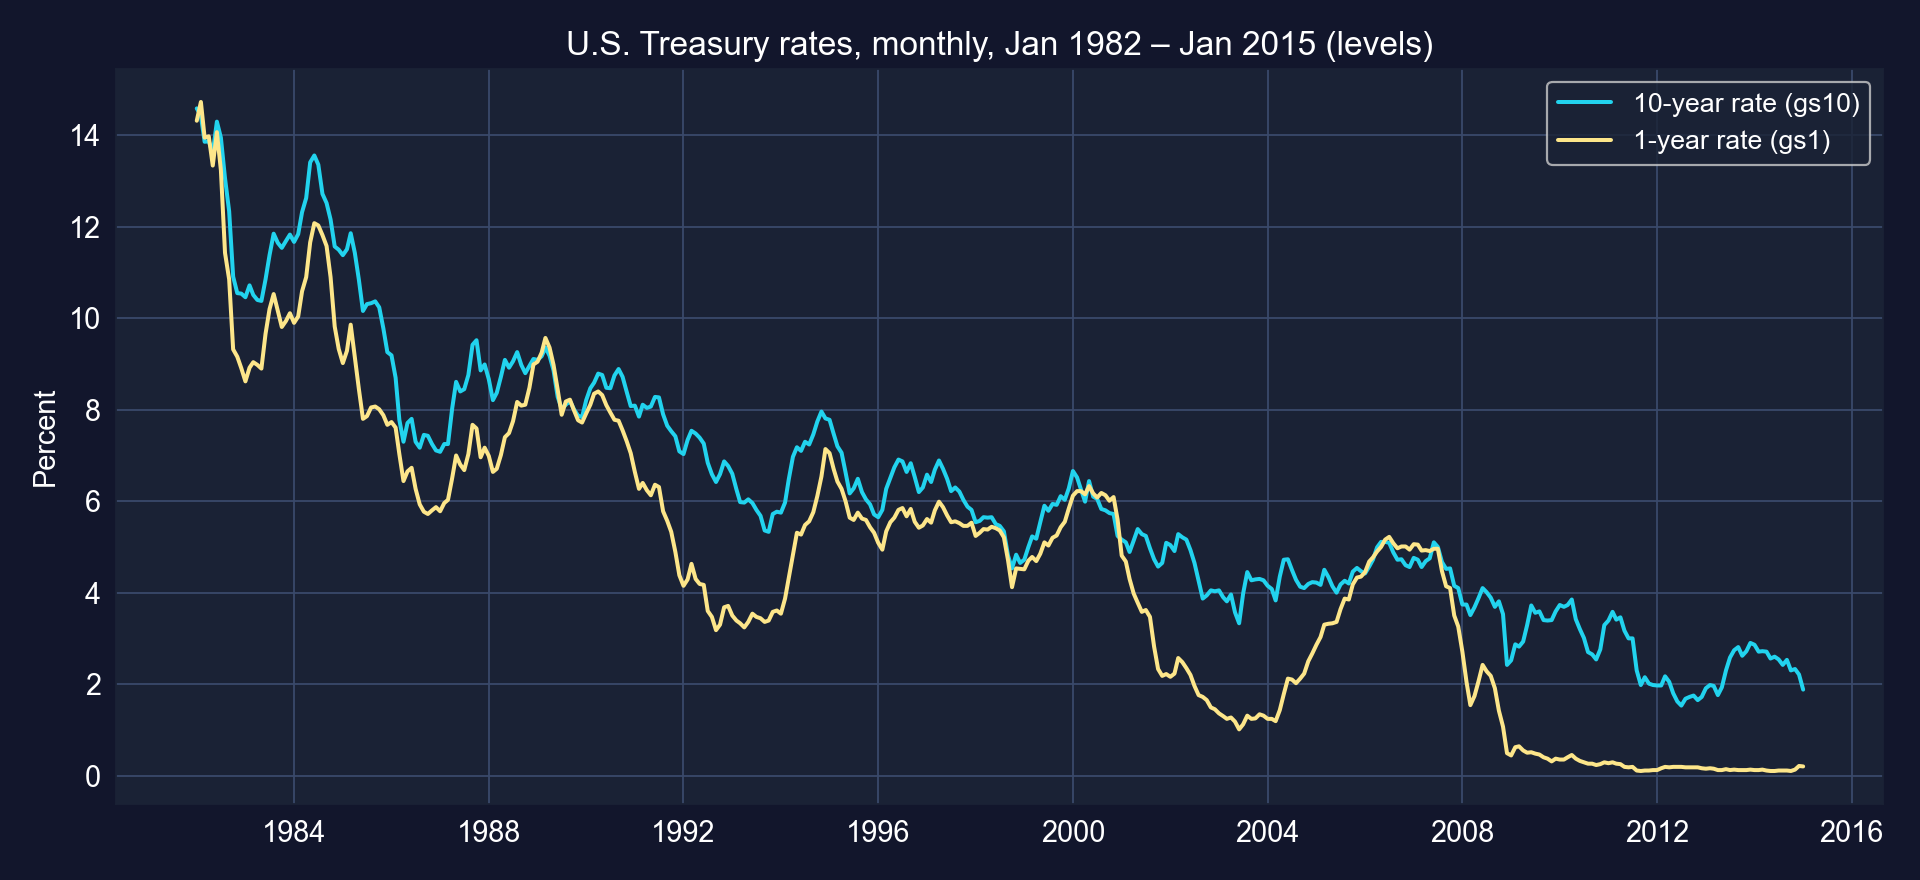
Monthly 10-year and 1-year Treasury yields, 1982–2015.
Over 33 years both rates fall by more than ten points. Any regression of one level on the other will partly fit this shared downward drift. In levels the two series correlate 0.95.
Code: the levels regression, with default and HAC SEs
!pip install -q pyfixest                     # pyfixest is not preinstalled in Colab
import numpy as np                           # numerical operations
import pandas as pd                          # tabular data
import pyfixest as pf                        # OLS with default / HAC standard errors
url = "https://raw.githubusercontent.com/quarcs-lab/data-open/master/AED/AED_INTERESTRATES.DTA"
data_rates = pd.read_stata(url)              # 397 months, Jan 1982 – Jan 2015
data_rates["time"] = np.arange(len(data_rates))              # linear time trend 0, 1, 2, ...
fit_levels = pf.feols("gs10 ~ gs1 + time", data=data_rates)   # default SEs
fit_levels_hac = pf.feols("gs10 ~ gs1 + time", data=data_rates, vcov="NW",
                          vcov_kwargs={"time_id": "time", "lag": 24})   # Newey–West, 24 lags
fit_levels_hac.summary() # same coefficients, HAC SEsOutput: a near-perfect fit, and SEs that were 3.6× too small
| Variable | Coef. | Default SE | Default \(t\) | HAC SE | HAC \(t\) | HAC ÷ default |
|---|---|---|---|---|---|---|
| Intercept | 5.8994 | 0.2254 | 26.17 | 0.6640 | 8.89 | 2.95 |
gs1 |
0.5076 | 0.0221 | 22.92 | 0.0808 | 6.28 | 3.65 |
time |
−0.0106 | 0.0006 | −16.69 | 0.0018 | −5.79 | 2.88 |
N = 397 · \(R^2 = 0.947\) · HAC: Newey–West, 24 lags · HAC 95% CI for gs1: [0.3488, 0.6663]
Holding a linear trend fixed, a 1-point higher short rate goes with a 0.51-point higher long rate. The fit looks superb, but the residuals are highly persistent, so default SEs overstate precision more than threefold.
How HAC standard errors work
\[\widehat V_{\text{HAC}} = (X'X)^{-1}\Big[\hat\Omega_0 + \sum_{\ell=1}^{L} w_\ell\,\big(\hat\Omega_\ell + \hat\Omega_\ell'\big)\Big](X'X)^{-1}, \qquad w_\ell = 1 - \frac{\ell}{L+1}\]
- \(\hat\Omega_\ell = \sum_t \hat u_t \hat u_{t-\ell}\, x_t x_{t-\ell}'\): the covariance of scores \(\ell\) months apart
- Bartlett weights \(w_\ell\) shrink distant lags; \(L\) is chosen by the analyst (here 24 months)
- HAC fixes the standard errors; it does not fix a spurious coefficient
HAC is to time series what clustering is to panels: same sandwich, different idea of which errors may be correlated.
17.6 · Autocorrelation: is the levels fit spurious?
Correlogram · consequences · first differencing
Autocorrelation: what it breaks and how to see it
- Consequences: OLS coefficients stay unbiased (if the regressors are exogenous), but default SEs are wrong, usually too small, and \(t\)-tests over-reject
- Detect: the correlogram of residuals; the Breusch–Godfrey LM test; the Durbin–Watson statistic for AR(1) errors
- Respond: HAC SEs; model the dynamics (AR, ADL); or first-difference non-stationary series
A slowly decaying correlogram is the fingerprint of a non-stationary, near-unit-root error.
Code: residual autocorrelations of the levels regression
# continues from the previous block
from statsmodels.tsa.stattools import acf             # autocorrelation function
from statsmodels.graphics.tsaplots import plot_acf    # correlogram plot
data_rates["uhatgs10"] = fit_levels._u_hat            # residuals of the levels regression
acf_resid = acf(data_rates["uhatgs10"].dropna(), nlags=10)   # lags 0..10
for k in range(11): print(k, round(acf_resid[k], 3)) # lag-1 ≈ 0.95
plot_acf(data_rates["uhatgs10"].dropna(), lags=24, alpha=0.05) # with a 95% bandOutput: the residuals barely forget
| Lag | \(r_k\) |
|---|---|
| 1 | 0.953 |
| 2 | 0.888 |
| 3 | 0.830 |
| 4 | 0.769 |
| 5 | 0.709 |
| 8 | 0.538 |
| 10 | 0.425 |
95% band: ±0.098
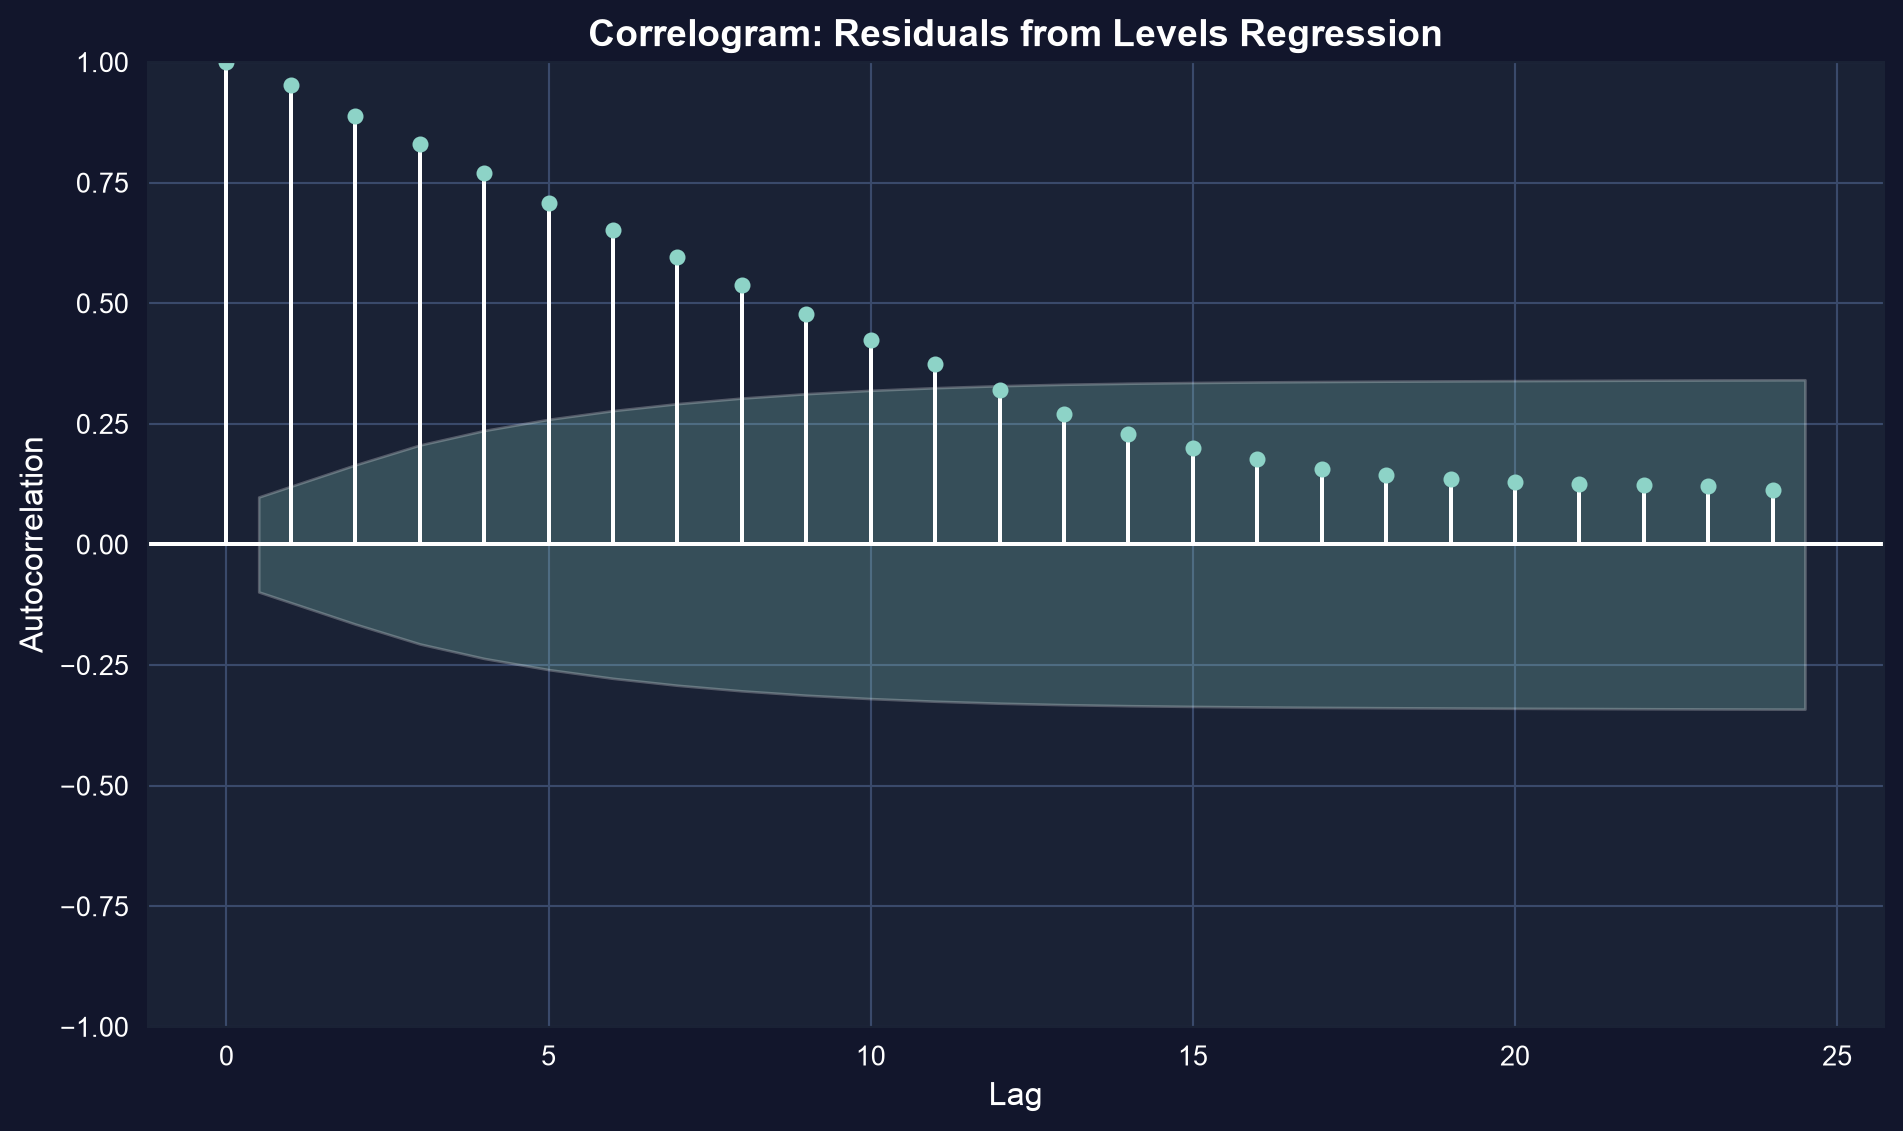
Still 0.42 after ten months. Errors this persistent mean the 397 months carry far less independent information than 397 observations, which is why HAC SEs were 3.65× larger.
First differences: compare changes with changes
\[\Delta y_t = y_t - y_{t-1}, \qquad \Delta\text{gs10}_t = \beta_1 + \beta_2\,\Delta\text{gs1}_t + u_t\]
- Differencing removes a stochastic trend and any linear trend (it becomes the intercept)
- The question changes: “when short rates move this month, how much do long rates move?”
- Cost: long-run level information is discarded; only month-to-month variation identifies \(\beta_2\)
The time-series cousin of fixed effects: drop the persistent component, keep the changes.
Monthly changes: no trend, centred on zero
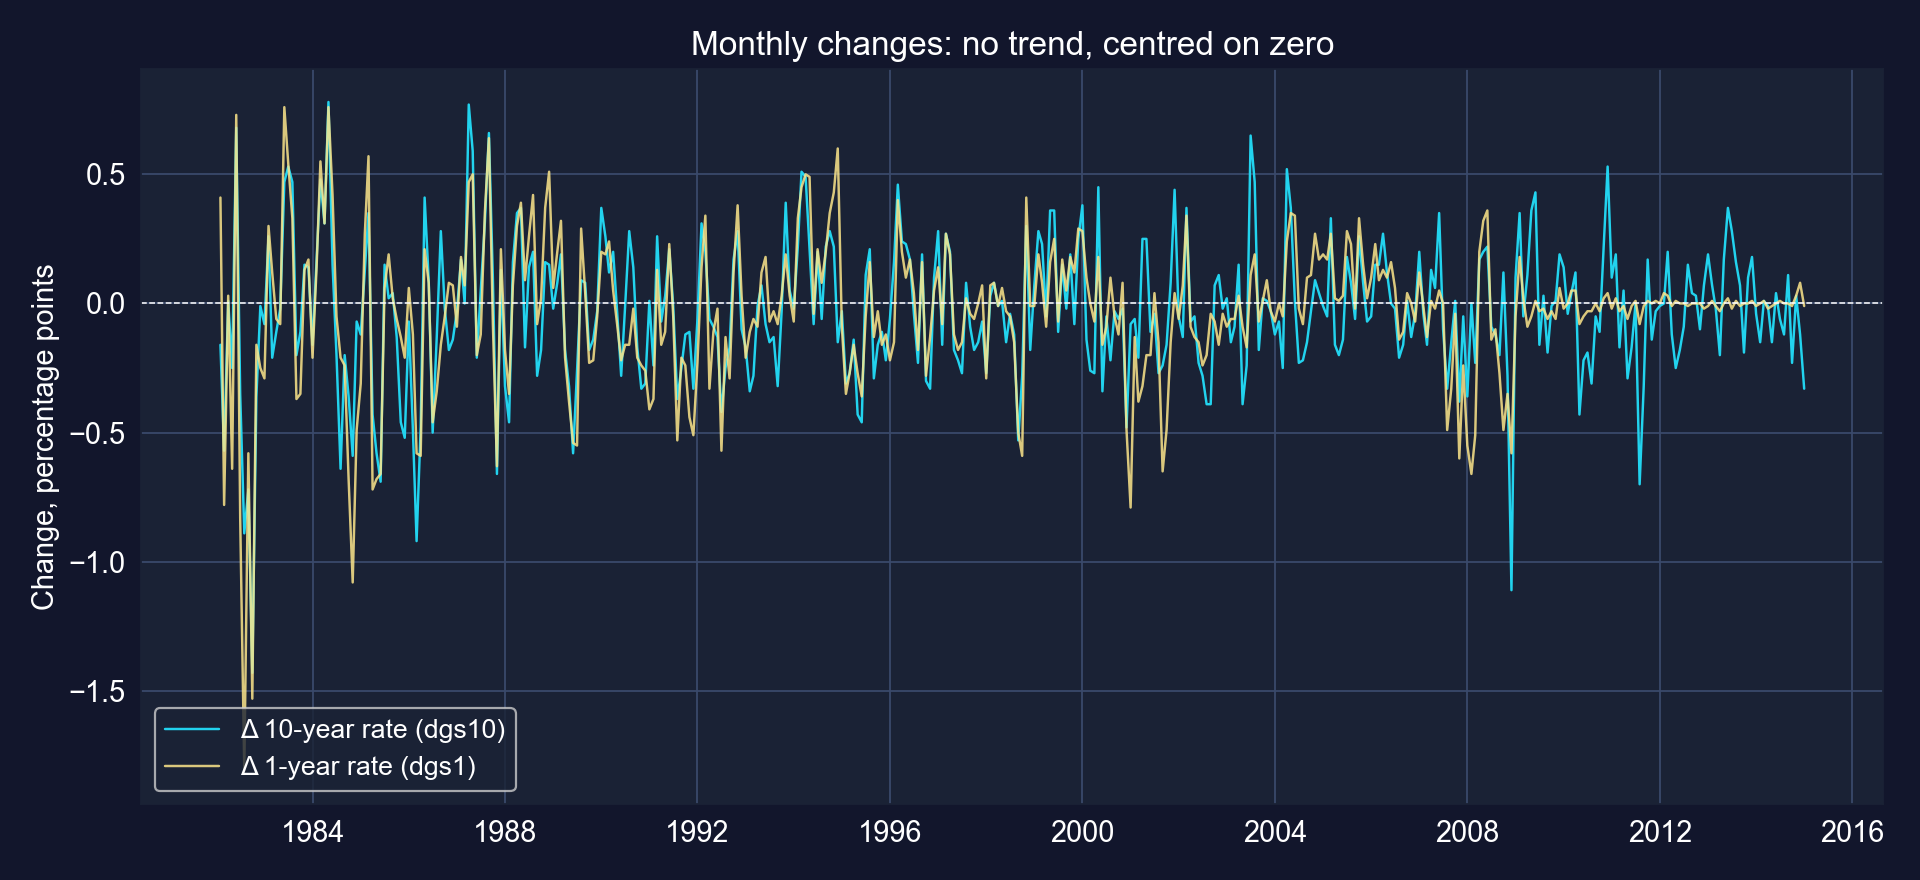
Monthly changes in the 10-year and 1-year rates, 1982–2015.
The changes look stationary: no drift, a constant mean near zero, but bursts of volatility (early 1980s, 2008), a reminder to use robust SEs.
Code: the regression in changes
# continues from the previous block
fit_changes = pf.feols("dgs10 ~ dgs1", data=data_rates)   # regression in first differences
fit_changes.summary()                                    # N = 396 (first month has no change)
uhat_dgs10 = fit_changes._u_hat                          # residuals in changes
acf_dgs10_resid = acf(uhat_dgs10[~np.isnan(uhat_dgs10)], nlags=10)
print(acf_dgs10_resid[1]) # lag-1 autocorrelationOutput: changes pass through at 0.72, and the residuals relax
| Variable | Coef. | SE | \(t\) | \(p\) | 95% CI |
|---|---|---|---|---|---|
| Intercept | −0.0064 | 0.0091 | −0.71 | 0.480 | [−0.0243, 0.0115] |
dgs1 |
0.7198 | 0.0314 | 22.89 | < 0.001 | [0.6580, 0.7817] |
N = 396 · default SEs (as in the chapter) · \(R^2 = 0.571\) · residual autocorrelation: lag 1 = 0.255, lag 2 = −0.039, lag 3 = 0.061
| Levels + trend | Changes | |
|---|---|---|
| Slope on the 1-year rate | 0.508 | 0.720 |
| \(R^2\) | 0.947 | 0.571 |
| Residual lag-1 autocorrelation | 0.953 | 0.255 |
A 1-point change in the short rate goes with a 0.72-point change in the long rate the same month. \(R^2\) falls, but now it is honest.
17.6b · How fast do short-rate moves reach long rates?
AR(\(p\)) · ADL(\(p,q\)) · impact and cumulative multipliers
Dynamic models: let the past enter the regression
\[\text{AR}(p):\quad y_t = \beta_0 + \alpha_1 y_{t-1} + \cdots + \alpha_p y_{t-p} + u_t\]
\[\text{ADL}(p,q):\quad y_t = \beta_0 + \sum_{j=1}^{p}\alpha_j\,y_{t-j} + \sum_{j=0}^{q}\gamma_j\,x_{t-j} + u_t\]
- \(\alpha_j\): persistence (momentum or reversal) in \(y\) itself
- \(\gamma_0\): impact multiplier, the same-month response to \(x\)
- \(\gamma_0+\gamma_1+\dots\): cumulative distributed-lag multipliers; the long-run multiplier also accounts for the AR terms: \(\sum_j\gamma_j \,/\, (1-\sum_j \alpha_j)\)
Here \(y_t = \Delta\text{gs10}_t\) and \(x_t = \Delta\text{gs1}_t\): an ADL(2,2) in changes.
Code: build lags and fit the ADL(2,2)
# continues from the previous block
for k in [1, 2]:                                       # lags with .shift(k)
    data_rates[f"dgs10_lag{k}"] = data_rates["dgs10"].shift(k)
    data_rates[f"dgs1_lag{k}"] = data_rates["dgs1"].shift(k)
fit_adl = pf.feols("dgs10 ~ dgs10_lag1 + dgs10_lag2 + dgs1 + dgs1_lag1 + dgs1_lag2",
                   data=data_rates)                    # ADL(2,2), N = 394
fit_adl.summary()                                      # default SEs, as in the chapter
c = fit_adl.coef()                                     # cumulative pass-through:
print(c["dgs1"], c["dgs1"] + c["dgs1_lag1"], c["dgs1"] + c["dgs1_lag1"] + c["dgs1_lag2"])
print(acf(pd.Series(fit_adl._u_hat).dropna(), nlags=1)[1]) # residual lag-1 autocorrelationOutput: strong impact, partial reversal, positive momentum
| Variable | Coef. | SE | \(t\) | \(p\) | 95% CI |
|---|---|---|---|---|---|
| Intercept | −0.0067 | 0.0088 | −0.76 | 0.447 | [−0.0239, 0.0106] |
dgs10_lag1 |
0.2830 | 0.0508 | 5.57 | < 0.001 | [0.1831, 0.3828] |
dgs10_lag2 |
−0.1021 | 0.0506 | −2.02 | 0.044 | [−0.2015, −0.0027] |
dgs1 |
0.7397 | 0.0340 | 21.74 | < 0.001 | [0.6728, 0.8066] |
dgs1_lag1 |
−0.2588 | 0.0514 | −5.03 | < 0.001 | [−0.3599, −0.1576] |
dgs1_lag2 |
0.0515 | 0.0492 | 1.05 | 0.296 | [−0.0453, 0.1482] |
N = 394 · default SEs · \(R^2 = 0.611\) · residual lag-1 autocorrelation 0.008
Same month: 0.74 points of pass-through. Next month a partial reversal (−0.26). The long rate’s own lagged change enters positively (+0.28): momentum, not mean reversion.
Pass-through, month by month
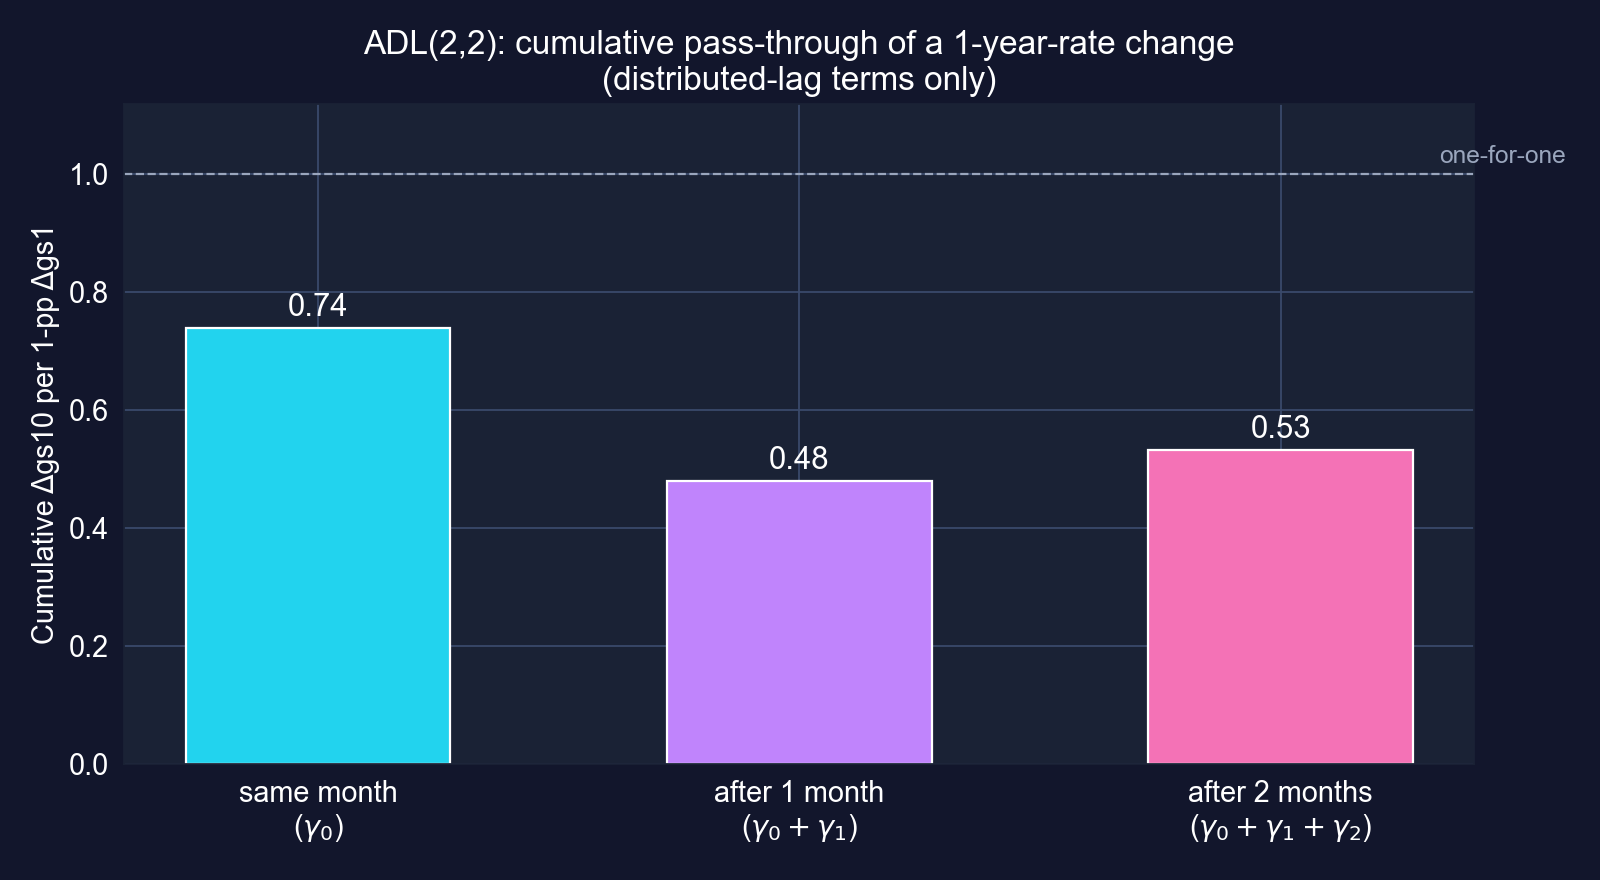
Cumulative distributed-lag multipliers from the ADL(2,2).
About 0.74 of a 1-point short-rate change shows up in the long rate at once; after the partial reversal, 0.53 has passed through within two months.
Did the dynamics soak up the autocorrelation?
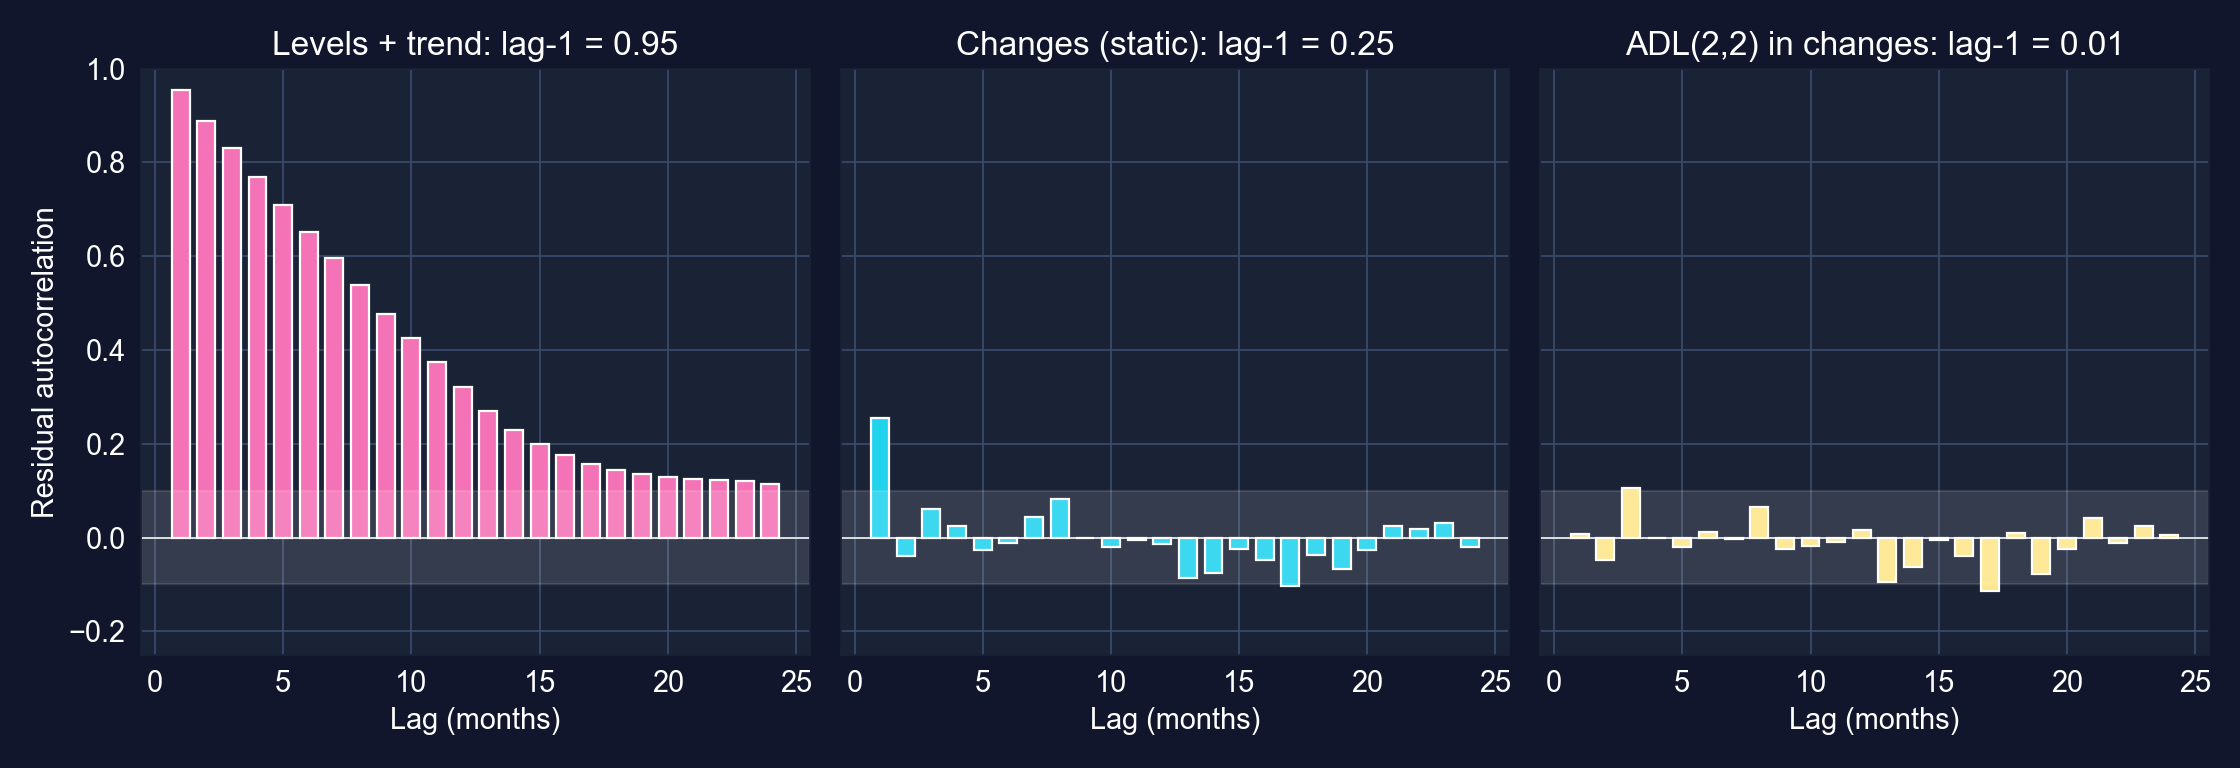
Residual autocorrelations, lags 1–24, for three specifications. Shaded band: ±1.96/√T.
Levels: 0.95. Static changes: 0.25. ADL(2,2): 0.01. Modelling the dynamics leaves residuals that look like white noise.
Code: compare static, AR(2) and ADL(2,2) on one sample
# continues from the previous block (computed for these slides)
samp = data_rates.dropna(subset=["dgs10_lag2", "dgs1_lag2"])    # same 394 months for all
models = {"static": "dgs10 ~ dgs1", "AR(2)": "dgs10 ~ dgs10_lag1 + dgs10_lag2",
          "ADL(2,2)": "dgs10 ~ dgs10_lag1 + dgs10_lag2 + dgs1 + dgs1_lag1 + dgs1_lag2"}
for name, fml in models.items():
    f = pf.feols(fml, data=samp); n, k = f._N, len(f.coef())
    bic = n * np.log((f._u_hat ** 2).sum() / n) + k * np.log(n)   # lower is better
print(name, round(f._r2, 3), round(acf(pd.Series(f._u_hat), nlags=1)[1], 3), round(bic, 1))Output: the ADL wins on every criterion
| Model | \(R^2\) | Residual lag-1 \(\rho\) | BIC |
|---|---|---|---|
| Static: \(\Delta\)gs10 on \(\Delta\)gs1 | 0.573 | 0.259 | −1346.8 |
| AR(2): own lags only | 0.125 | 0.012 | −1057.9 |
| ADL(2,2) | 0.611 | 0.008 | −1359.7 |
Reading time-series regressions with care
- Units: changes are in percentage points, not percent. “A 1% rise in the 1-year rate” should read “a 1-percentage-point rise”
- Levels vs changes answer different questions: equilibrium co-movement vs monthly pass-through
- Stability: one set of coefficients spans 1982–2015, including the zero-lower-bound years after 2008
- Not causal by default: both rates respond to the same news (inflation, growth); the ADL describes predictive dynamics and transmission, not a controlled experiment
A time-series regression is credible when its residuals are white noise and its story survives a check of stability and common shocks.
Act II-c · From association to cause
17.7 · endogeneity · instrumental variables · the causal toolkit
17.7 · When is a slope causal?
Concepts only · worked designs in the Chapter 13 deck
OLS is biased the moment \(x\) is correlated with the error
\[y = \beta_1 + \beta_2 x + u, \qquad \text{OLS is consistent only if } E[u \mid x] = 0\]
- Omitted variables: a confounder drives both \(x\) and \(y\). NBA: market size raises revenue and buys wins (FE removed the time-invariant part)
- Measurement error in \(x\): attenuates the slope toward zero
- Simultaneity / reverse causation: \(y\) also moves \(x\). NBA: revenue pays for players, players produce wins
Adding controls fixes only the confounders you measure. Credible causal claims need an identification strategy.
Potential outcomes: what a causal effect means
\[\text{individual effect} = Y_{1i} - Y_{0i}, \qquad \text{ATE} = E[Y_{1i} - Y_{0i}]\]
- \(Y_{1i}\): the outcome if treated; \(Y_{0i}\): the outcome if not. Only one is ever observed
- A naive comparison of treated and untreated: \(E[Y_1\mid D{=}1] - E[Y_0\mid D{=}0] = \text{ATT} + \underbrace{E[Y_0\mid D{=}1]-E[Y_0\mid D{=}0]}_{\text{selection bias}}\)
- Every design is a way to make the selection-bias term zero, or to remove it
A causal estimate is a claim about a counterfactual. The design is the argument for why your comparison group stands in for it.
Instrumental variables: borrow variation that is as good as random
An instrument \(z\) must satisfy two conditions:
- Relevance: \(\text{Cov}(z, x) \neq 0\). Testable: first-stage \(F\) (rule of thumb \(> 10\))
- Exogeneity / exclusion: \(\text{Cov}(z, u) = 0\), so \(z\) affects \(y\) only through \(x\). Not testable: must be argued
With one regressor and one instrument, substitute \(y = \beta_1 + \beta_2 x + u\) into \(\text{Cov}(z, y)\):
\[\text{Cov}(z,y) = \beta_2\,\text{Cov}(z,x) + \underbrace{\text{Cov}(z,u)}_{=\,0} \;\;\Longrightarrow\;\; \hat\beta_{IV} = \frac{\widehat{\text{Cov}}(z,y)}{\widehat{\text{Cov}}(z,x)} = \frac{\text{reduced form}}{\text{first stage}}\]
IV is consistent where OLS is not, but only for the variation the instrument moves (a local effect), and only as good as the exclusion argument.
The causal toolkit
| Method | Source of variation | Identifying assumption | Where to see it worked |
|---|---|---|---|
| Randomized experiment | random assignment | randomization intact (no attrition bias) | Ch 13.5 · RAND HIE |
| Fixed effects | within-unit changes | no time-varying confounders | this deck, 17.3, CS 1, CS 2 |
| Difference-in-differences | group × period | parallel trends | Ch 13.6 · South Africa |
| Regression discontinuity | a cutoff in a running variable | continuity at the cutoff | Ch 13.7 · U.S. Senate |
| Instrumental variables | an instrument | relevance + exclusion | Ch 13.8 · institutions |
| Matching / propensity scores | observed covariates | selection on observables only | (named in the chapter; not worked) |
Every row trades the unverifiable “I controlled for everything” for a specific assumption you can defend, probe, or attack.
The worked designs: naive vs design, from the Chapter 13 deck
| Ch 13 case | Design | Naive comparison | Design-based estimate |
|---|---|---|---|
| 13.5 | RCT (health insurance) | (randomized: no naive version needed) | 95% plan: −$1,108 vs free care |
| 13.6 | DiD (child nutrition) | treated before vs after: +0.867 | +0.522 z-units |
| 13.7 | RD (Senate incumbency) | winners vs losers: +21.7 pp | +4.8 pp |
| 13.8 | IV (institutions) | OLS: 0.52 | 2SLS: 0.94 |
Same lesson as pooled vs FE in this chapter: when the comparison changes, the number changes, sometimes by a factor of four.
Practical recommendations from 17.7
- Name the confounders before running anything; ask which are time-invariant
- Cluster (panels) or use HAC (time series): honest SEs are part of a credible claim
- Report several specifications: pooled and FE, OLS and IV, levels and changes. The pattern of changes is evidence
- State the identifying assumption in one sentence, and say what would violate it
A design earns a causal claim; a significant \(t\)-statistic does not.
Act II-d · Two case studies, every task run
Case Study 1 · cross-country productivity · Case Study 2 · night lights in Bolivia
Case Study 1 · Does capital raise productivity, within countries?
108 countries × 25 years · variance decomposition · cluster SEs · FE · two-way FE · regions
The question and the data
Data. Mendez (2020) convergence-clubs panel: 108 countries × 1990–2014 = 2,700 country-years (balanced).
| Variable | Meaning | Mean | Range |
|---|---|---|---|
ln_lp |
log labor productivity (output per worker) | 9.80 | 6.90 – 11.94 |
ln_kl |
log physical capital per worker | 10.76 | 6.59 – 13.22 |
h |
human capital index (schooling-based) | 2.99 | 1.32 – 5.20 |
region |
Africa 26 · Americas 22 · Asia 28 · Europe 30 · Oceania 2 countries |
\[\ln lp_{it} = \alpha_i + \beta_k \ln kl_{it} + \beta_h\, h_{it} + \varepsilon_{it}\]
The capital and human-capital columns are kl (capital per worker) and h (human-capital index); the chapter and the slides use them throughout.
Task 1 · Code: panel structure and variance decomposition
!pip install -q pyfixest                         # pyfixest is not preinstalled in Colab
import numpy as np, pandas as pd, pyfixest as pf # numerics, tables, regressions
base = "https://raw.githubusercontent.com/quarcs-lab/mendez2020-convergence-clubs-code-data/"
dat = pd.read_csv(base + "master/assets/dat.csv")    # 108 countries × 1990–2014
dat["ln_lp"] = np.log(dat["lp"])                     # log labor productivity
dat["ln_kl"] = np.log(dat["kl"])                     # log capital per worker
print(dat["country"].nunique(), dat["year"].nunique(), len(dat))   # 108 25 2700
overall_var = dat["ln_lp"].var()                                    # all country-years
between_var = dat.groupby("country")["ln_lp"].mean().var()          # 108 country means
within_var = dat.groupby("country")["ln_lp"].apply(lambda x: x - x.mean()).var()
print(overall_var, between_var, within_var, between_var / overall_var)Task 1 · Output: 95% of the variation is between countries
Variance of ln_lp |
Share | |
|---|---|---|
| Overall (2,700 country-years) | 1.391 | 100% |
| Between (108 country means) | 1.328 | 95.4% |
| Within (deviations from own mean) | 0.075 | 5.4% |
Shares need not sum to exactly 100%: the between variance is computed over 108 means, the within variance over 2,700 deviations.
Productivity differences are overwhelmingly permanent cross-country gaps. Pooled OLS will be driven by them; fixed effects will keep only the 5% that moves within countries.
Task 2 · Code: pooled OLS with default, robust and cluster SEs
# continues from the previous block
fit_default = pf.feols("ln_lp ~ ln_kl + h", data=dat)                          # iid SEs
fit_hc1 = pf.feols("ln_lp ~ ln_kl + h", data=dat, vcov="HC1")                  # robust
fit_cluster = pf.feols("ln_lp ~ ln_kl + h", data=dat, vcov={"CRV1": "country"})  # by country
print(pd.DataFrame({"default": fit_default.se(), "HC1": fit_hc1.se(),
                    "cluster": fit_cluster.se()}).round(4))   # same coefficients, three SEs
print((fit_cluster.se() / fit_default.se()).round(2))         # inflation factor
fit_cluster.summary()Task 2 · Output: clustering quadruples the standard errors
| Variable | Coef. | Default SE | HC1 SE | Cluster SE | Cluster ÷ default | \(t\) (default → cluster) |
|---|---|---|---|---|---|---|
| Intercept | 1.6949 | 0.0581 | 0.0724 | 0.2716 | 4.67 | 29.15 → 6.24 |
ln_kl |
0.7136 | 0.0081 | 0.0089 | 0.0327 | 4.03 | 87.74 → 21.79 |
h |
0.1410 | 0.0148 | 0.0150 | 0.0612 | 4.12 | 9.50 → 2.30 |
N = 2,700 · 108 country clusters · \(R^2 = 0.908\) · cluster 95% CI: ln_kl [0.6487, 0.7785], h [0.0196, 0.2623] (\(p = 0.023\))
25 years of one country are nearly one observation’s worth of evidence about its level: clustering inflates SEs about 4×. h drops from \(t = 9.5\) to a borderline \(t = 2.3\).
Task 3 · Code: country fixed effects
Task 3 · Output: capital’s elasticity falls by 39% within countries
| Variable | Coef. | SE | \(t\) | \(p\) | 95% CI |
|---|---|---|---|---|---|
ln_kl |
0.4377 | 0.0377 | 11.61 | < 0.001 | [0.3630, 0.5125] |
h |
0.2226 | 0.0566 | 3.93 | < 0.001 | [0.1104, 0.3348] |
N = 2,700 · 108 country fixed effects · CRV1 by country · within \(R^2 = 0.670\) · computed for these slides
ln_kl: pooled 0.714 → FE 0.438. Within a country, 1% more capital per worker goes with about 0.44% more output per workerh: pooled 0.141 → FE 0.223. One more unit of the index: \(100(e^{0.2226}-1) = 25\%\) higher productivity
The capital slope behaves like the NBA case (a positive confounder removed). Human capital moves the other way: FE does not always shrink coefficients.
Pooled vs FE vs two-way FE at a glance
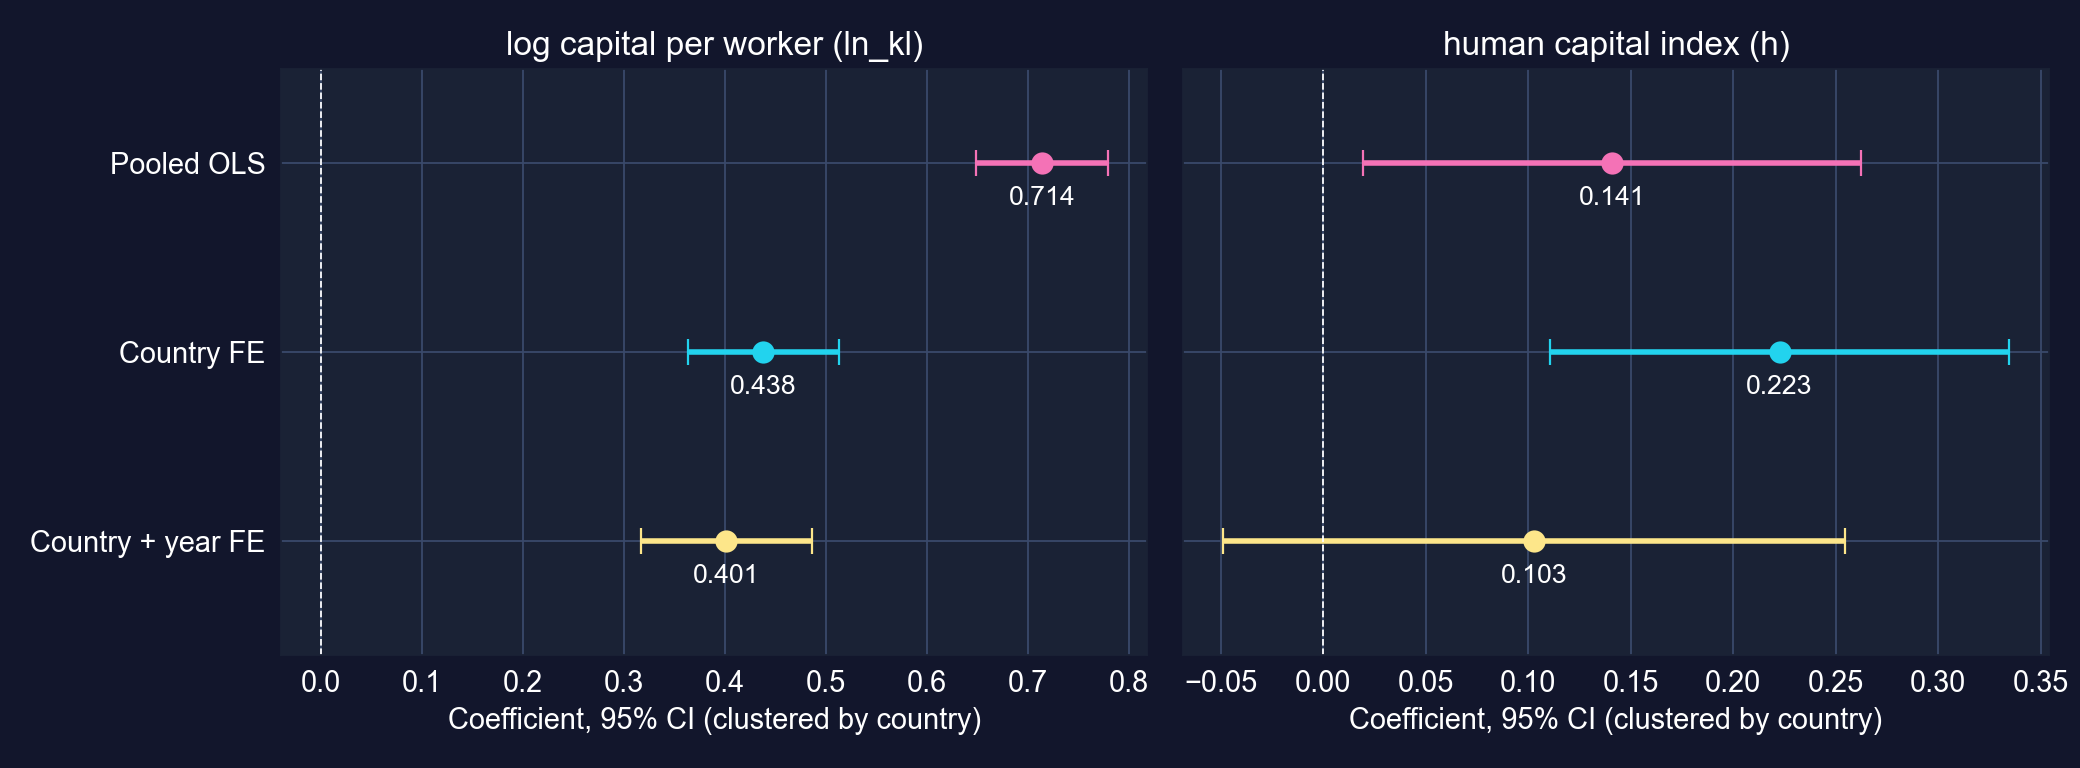
Coefficients with 95% CIs (clustered by country) under three specifications.
Capital’s elasticity is stable once country effects are in (0.44 → 0.40). Human capital’s is not: adding year effects makes it insignificant.
Task 4 · Code: time trends and year effects
# continues from the previous block
fit_twfe = pf.feols("ln_lp ~ ln_kl + h | country + year", data=dat,
                    vcov={"CRV1": "country"})       # two-way FE: country AND year
fit_twfe.summary()
fit_trend = pf.feols("ln_lp ~ ln_kl + h + year | country", data=dat,
                     vcov={"CRV1": "country"})      # a common linear trend instead
fit_trend.summary()
year_fe = fit_twfe.fixef()                          # estimated year effects (1990 = 0)
print(year_fe)Task 4 · Output: common shocks matter for human capital
| Variable | Coef. | SE | \(t\) | \(p\) | 95% CI |
|---|---|---|---|---|---|
ln_kl |
0.4014 | 0.0428 | 9.38 | < 0.001 | [0.3166, 0.4862] |
h |
0.1028 | 0.0766 | 1.34 | 0.183 | [−0.0491, 0.2547] |
Two-way FE (country + year) · N = 2,700 · CRV1 by country · within \(R^2 = 0.337\) · computed for these slides
With a linear trend instead of year effects: ln_kl 0.4071, h 0.1009 (\(p = 0.183\)), trend +0.0057 per year (\(p = 0.034\)), i.e. about 0.57% a year of common productivity growth beyond capital and schooling.
Capital’s within-country elasticity survives common shocks (≈ 0.40). Human capital’s does not: its FE estimate partly reflected the worldwide upward trend in schooling.
Task 4 · The common year effects
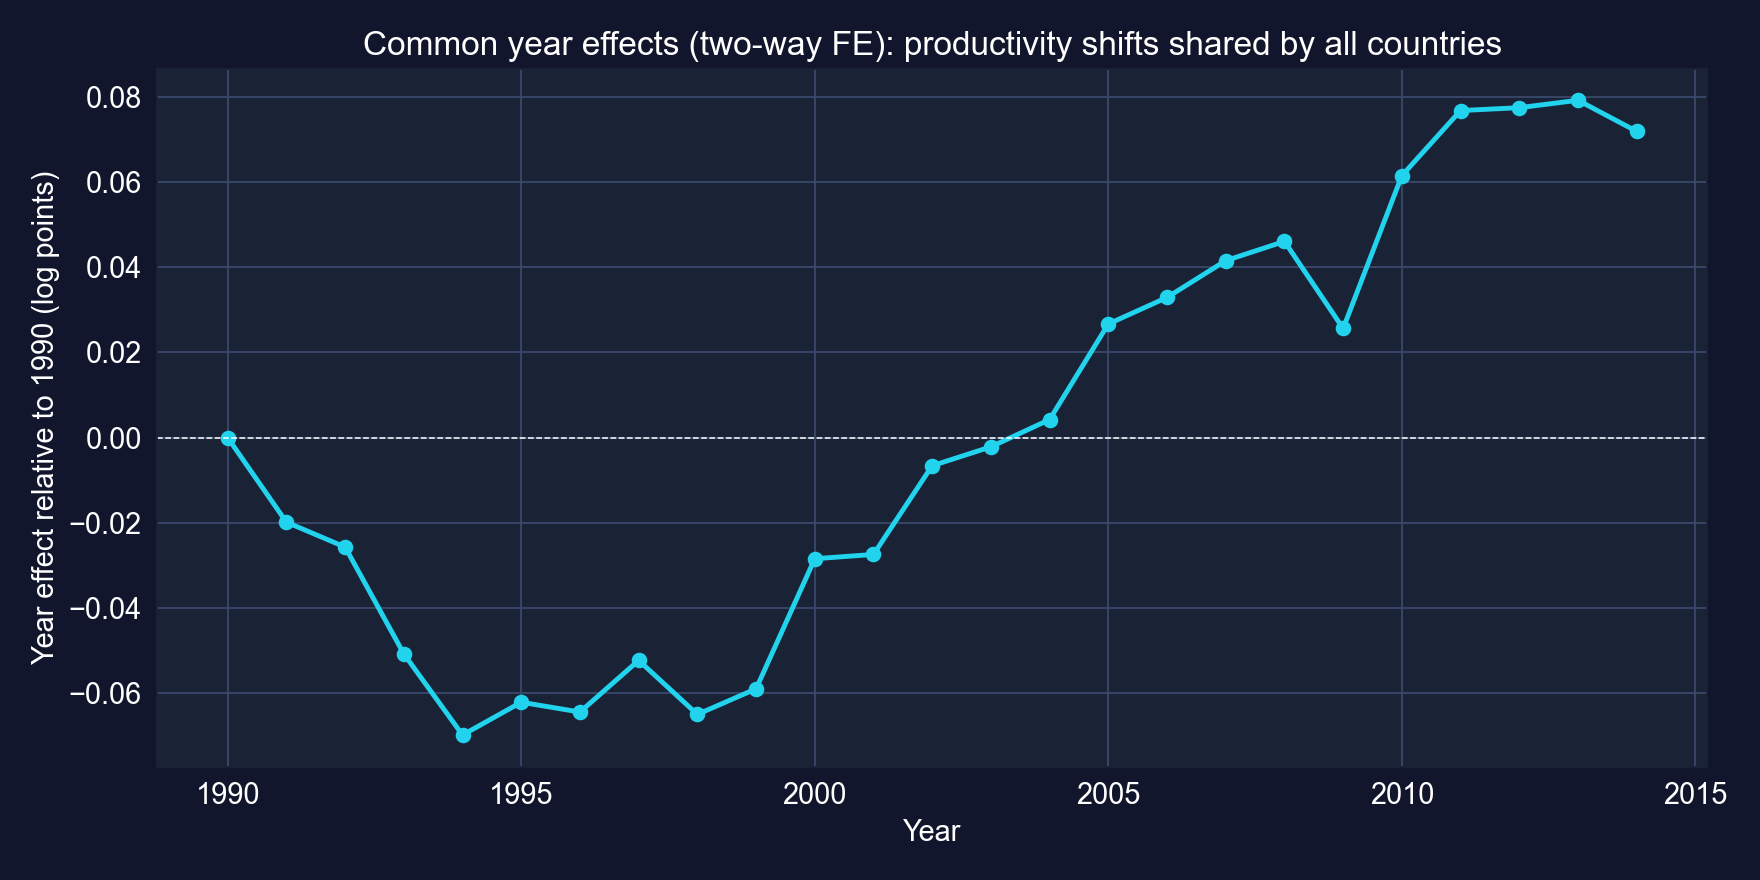
Estimated year fixed effects from the two-way FE model, relative to 1990.
After netting out capital and schooling, the common component falls in the early 1990s, rises from 2000 to 2008, dips in 2009, and recovers.
Task 4 · Code: do regions grow at different rates? Is there convergence?
# continues from the previous block (computed for these slides)
dat["t"] = dat["year"] - 1990                                    # years since 1990
fit_rt = pf.feols("ln_lp ~ ln_kl + h + i(region, t) | country", data=dat, vcov={"CRV1": "country"})
names = fit_rt.coef().index; rt = [k for k in names if k.startswith("region::")]
R = np.zeros((len(rt) - 1, len(names)))                           # H0: all trends = Africa's
for j, k in enumerate(rt[1:]):
    R[j, names.get_loc(k)], R[j, names.get_loc(rt[0])] = 1, -1
print(fit_rt.coef()[rt]); print(fit_rt.wald_test(R=R))           # Wald chi2(4)
first = dat[dat["year"] == 1990].set_index("country")["ln_lp"]   # initial productivity
last = dat[dat["year"] == 2014].set_index("country")["ln_lp"]
conv = pd.DataFrame({"ln_lp0": first, "g": 100 * (last - first) / 24}).reset_index()
pf.feols("g ~ ln_lp0", data=conv, vcov="HC1").summary() # growth on initial levelTask 4 · Output: regional trends differ; poorer countries did not catch up
| Region trend (per year) | Coef. | \(p\) |
|---|---|---|
| Africa | 0.0015 | 0.665 |
| Americas | 0.0066 | 0.035 |
| Asia | 0.0135 | 0.010 |
| Europe | 0.0126 | 0.001 |
| Oceania (2 countries) | 0.0067 | < 0.001 |
Country FE + ln_kl + h · CRV1 · equal-trends test: Wald \(\chi^2(4) = 11.39\), \(p = 0.023\)
| Convergence regression | Coef. | SE | \(p\) |
|---|---|---|---|
| Intercept | 4.520 | 1.836 | 0.015 |
ln_lp0 (1990) |
−0.222 | 0.180 | 0.221 |
N = 108 · HC1 · \(R^2 = 0.018\) · growth in % per year
Beyond capital and schooling, productivity trended up about 1.3% a year in Asia and Europe and barely at all in Africa. There is no unconditional convergence: the slope on initial productivity is small and insignificant.
Task 4 · Convergence, pictured
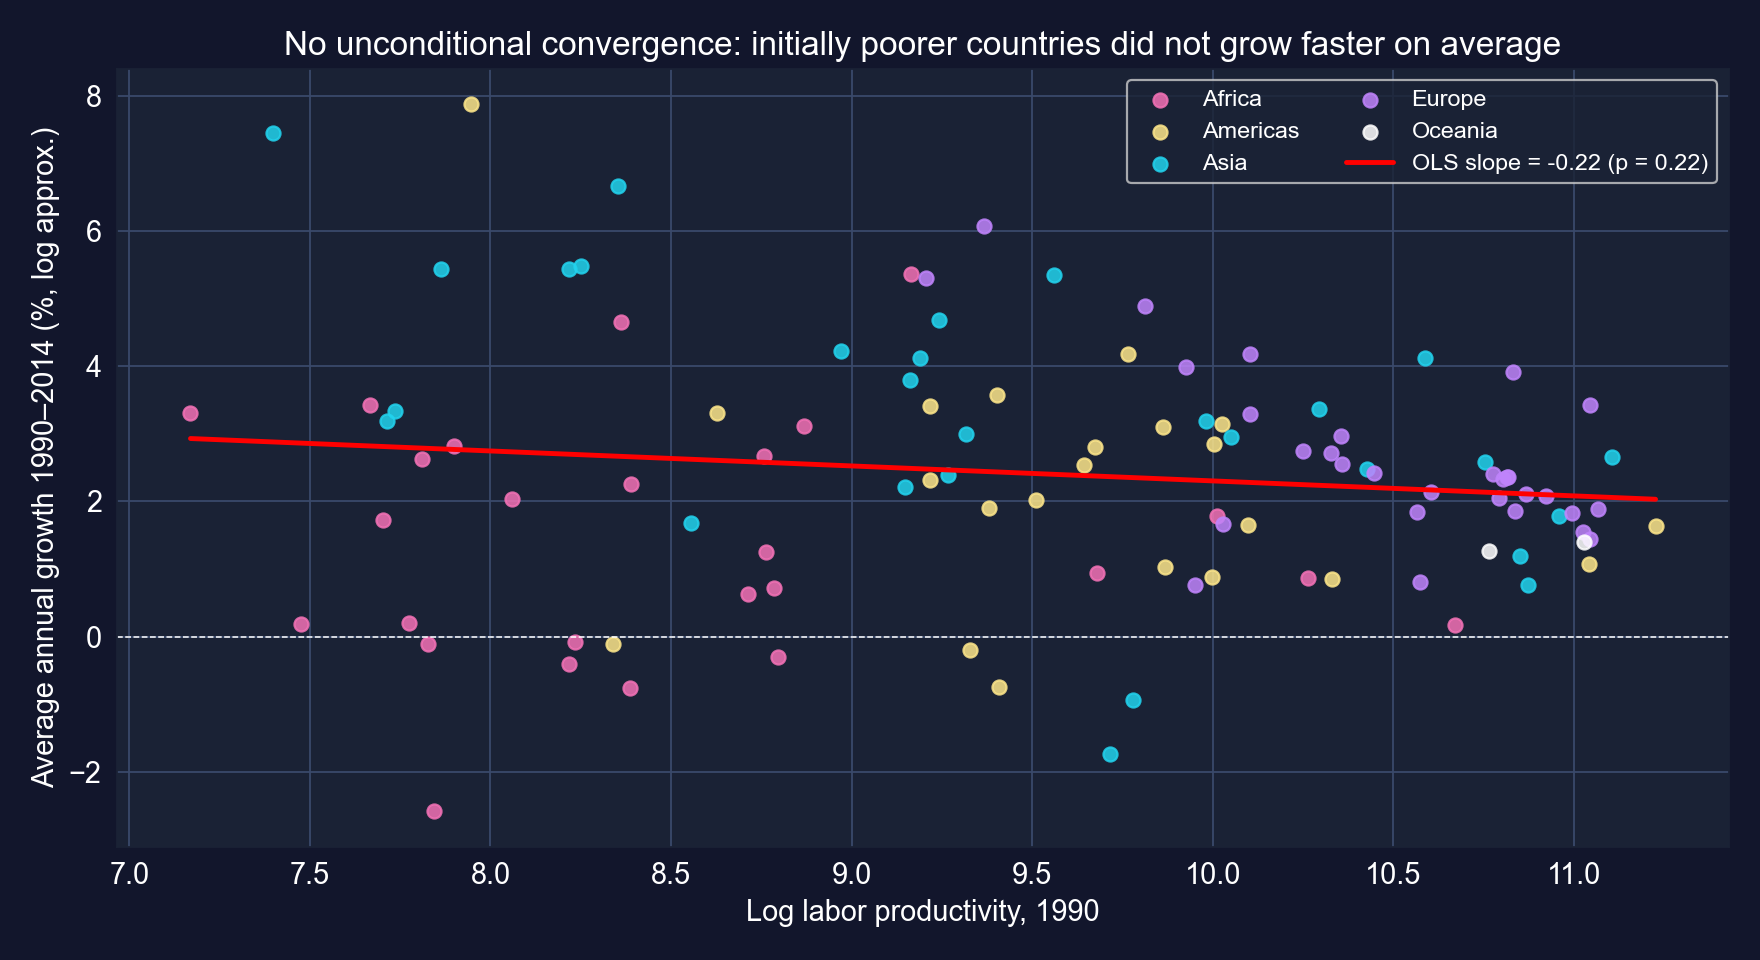
Average annual growth of labor productivity, 1990–2014, against its 1990 level; 108 countries.
A cloud with a faintly negative slope: some poor Asian economies raced ahead, many African economies did not. This is why the Mendez data are about convergence clubs, not one global convergence.
Task 5 · Code: do returns to capital differ by region?
# continues from the previous block (computed for these slides)
fit_r1 = pf.feols("ln_lp ~ ln_kl + h + C(region)", data=dat, vcov={"CRV1": "country"})
fit_r2 = pf.feols("ln_lp ~ ln_kl + h + C(region) + C(region):ln_kl + C(region):h",
                  data=dat, vcov={"CRV1": "country"})    # region-specific slopes
fit_r1.summary(); fit_r2.summary()
inter = [k for k in fit_r2.coef().index if ":" in k]     # the 8 interaction terms
R = np.array([[1.0 * (k == a) for k in fit_r2.coef().index] for a in inter])
print(fit_r2.wald_test(R=R)) # H0: all 8 interactions = 0Task 5 · Output: regional slopes differ only weakly
| Region | Implied ln_kl slope |
Implied h slope |
|---|---|---|
| Africa (reference) | 0.640 | 0.257 |
| Americas | 0.671 | 0.293 |
| Asia | 0.778 | −0.075 |
| Europe | 0.679 | 0.048 |
| Oceania (2 countries) | 0.649 | 0.110 |
Implied slope = base slope + region interaction · joint test of all 8 interactions: Wald \(\chi^2(8) = 13.90\), \(p = 0.084\) · region dummies alone: only Oceania differs from Africa (\(p = 0.034\)) · computed for these slides
Returns to capital look similar across regions (0.64–0.78), and the interactions are jointly significant only at 10%. No region-specific interaction is individually significant at 5%.
Task 6 · The policy brief, in numbers
| Specification | ln_kl |
h |
Variation used |
|---|---|---|---|
| Pooled OLS, cluster SEs | 0.714 (0.033) | 0.141 (0.061) | between + within |
| Country FE | 0.438 (0.038) | 0.223 (0.057) | within country |
| Country + year FE | 0.401 (0.043) | 0.103 (0.077) | within country, net of common shocks |
| Region-specific slopes (pooled) | 0.64 – 0.78 | −0.08 – 0.29 | between + within, by region |
- Channels: capital accumulation is robustly associated with productivity within countries (elasticity ≈ 0.4); the human-capital link is fragile once common trends are removed
- Causal? Not established: capital responds to expected productivity (reverse causality), and time-varying policies and shocks remain
Policy reading: investment climates that raise capital per worker are the best-supported channel in these data, and pooled cross-country estimates overstate it by about 40%.
Case Study 2 · Night lights and population in Bolivia
339 municipalities × 2012–2020 · reshaping · pooled · FE · year effects · first differences
The question and the data
Data. DS4Bolivia (ds4bolivia_v20250523.csv): 339 municipalities, annual columns ln_NTLpc2012 … ln_NTLpc2020 and pop2012 … pop2020, stored wide (one row per municipality).
| Variable | Meaning |
|---|---|
ln_NTLpc |
log nighttime lights per capita (outcome) |
ln_pop |
log population |
year |
2012, …, 2020 |
asdf_id, mun, dep |
municipality id, name, department (9 departments) |
\[\ln NTLpc_{it} = \alpha_i + \beta\,\ln pop_{it} + \delta_t + \varepsilon_{it}\]
Research question: how does luminosity evolve within municipalities over time, and how does it move with population once fixed local traits (altitude, remoteness, climate) are removed?
Task 1 · Code: reshape wide → long
!pip install -q pyfixest                         # pyfixest is not preinstalled in Colab
import numpy as np, pandas as pd, pyfixest as pf # numerics, tables, regressions
url_bol = "https://raw.githubusercontent.com/quarcs-lab/ds4bolivia/master/ds4bolivia_v20250523.csv"
bol = pd.read_csv(url_bol)                       # 339 municipalities, wide format
years = range(2012, 2021)                        # nine annual observations
ntl_long = bol[["mun", "dep", "asdf_id"] + [f"ln_NTLpc{y}" for y in years]].melt(
    id_vars=["mun", "dep", "asdf_id"], var_name="ntl_var", value_name="ln_NTLpc")
ntl_long["year"] = ntl_long["ntl_var"].str.extract(r"(\d{4})").astype(int)  # "…2015" → 2015
pop_long = bol[["asdf_id"] + [f"pop{y}" for y in years]].melt(
    id_vars=["asdf_id"], var_name="pop_var", value_name="pop")
pop_long["year"] = pop_long["pop_var"].str.extract(r"(\d{4})").astype(int)Task 1 · Code: merge into one panel and check it
# continues from the previous block
panel = ntl_long.merge(pop_long[["asdf_id", "year", "pop"]], on=["asdf_id", "year"], how="left")
panel["ln_pop"] = np.log(panel["pop"])                       # log population
panel = panel.sort_values(["asdf_id", "year"]).reset_index(drop=True)
print(panel.shape, panel["asdf_id"].nunique())               # rows × columns, municipalities
print(panel["ln_NTLpc"].isna().sum())                        # missing light values
panel_reg = panel[["ln_NTLpc", "ln_pop", "year", "mun", "dep", "asdf_id"]].dropna()
print(len(panel_reg), panel_reg["asdf_id"].nunique()) # estimation sample| Rows | Municipalities | |
|---|---|---|
| Full panel (339 × 9) | 3,051 | 339 |
Missing ln_NTLpc |
67 | |
| Estimation sample | 2,984 | 337 |
Task 6 (first): levels differ far more than they move
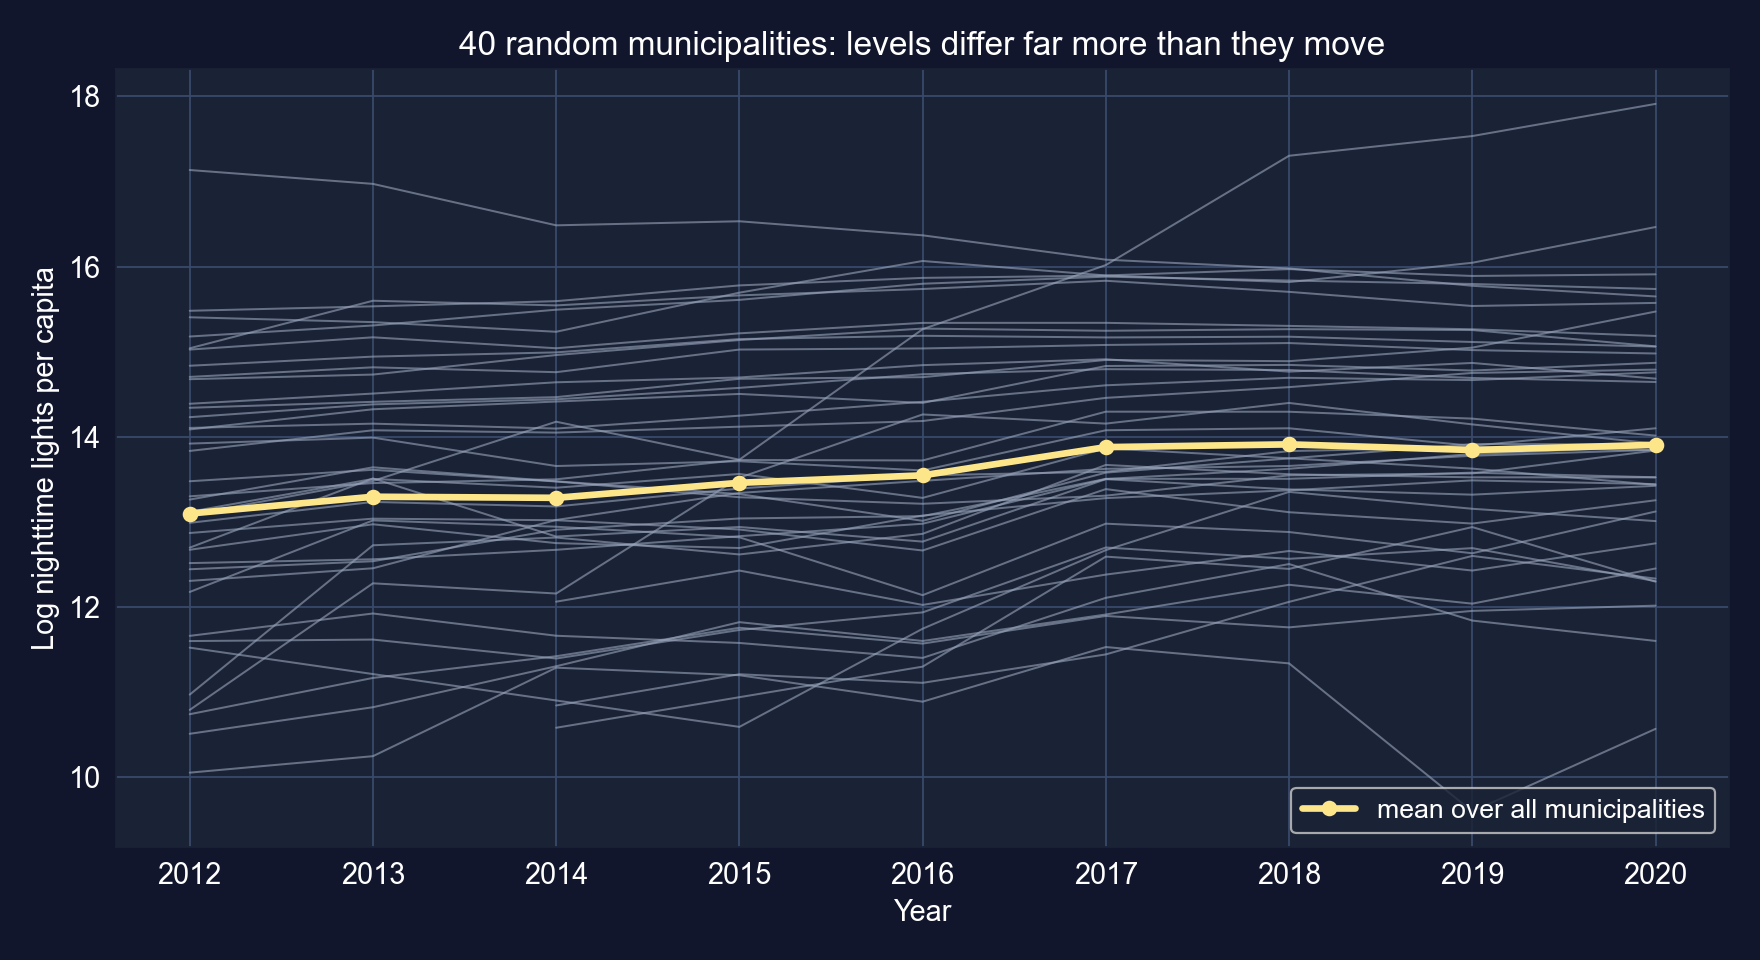
Log night lights per capita for 40 randomly chosen municipalities, with the all-municipality mean.
| Variance of… | Overall | Between | Within | Between share |
|---|---|---|---|---|
ln_NTLpc |
1.729 | 1.635 | 0.220 | 94.6% |
ln_pop |
1.278 | 1.283 | 0.0055 | ≈ 100% (within 0.4%) |
Task 2 · Code: pooled OLS, default vs cluster SEs
# continues from the previous block
fit_def = pf.feols("ln_NTLpc ~ ln_pop + year", data=panel_reg)               # default SEs
fit_pooled = pf.feols("ln_NTLpc ~ ln_pop + year", data=panel_reg, vcov={"CRV1": "asdf_id"})
print((fit_pooled.se() / fit_def.se()).round(2))      # cluster ÷ default, per coefficient
fit_pooled.summary()Task 2 · Output: population and trend, pooled
| Variable | Coef. | SE | \(t\) | \(p\) | 95% CI |
|---|---|---|---|---|---|
| Intercept | −200.1384 | 12.3774 | −16.17 | < 0.001 | [−224.4854, −175.7914] |
ln_pop |
0.3385 | 0.0472 | 7.18 | < 0.001 | [0.2457, 0.4312] |
year |
0.1044 | 0.0062 | 16.88 | < 0.001 | [0.0923, 0.1166] |
N = 2,984 · 337 clusters · \(R^2 = 0.130\) · cluster ÷ default SE: ln_pop 2.37, year 0.71
Task 2 · Interpretation: bigger places, more light per person
- Across municipalities, 1% more population goes with 0.34% more light per capita
- In total light, that is an elasticity of \(0.34 + 1 = 1.34\): larger places are disproportionately brighter (towns, grids, commerce)
- Trend: lights per capita grew about 0.10 log points a year on average, holding population fixed
- Low \(R^2 = 0.13\): most of the variation in lights per capita is unrelated to population size
A between-municipality comparison: cities versus rural municipalities differ in far more than population.
Task 3 · Code: municipality fixed effects
Task 3 · Output: the population slope flips sign
| Variable | Coef. | SE | \(t\) | \(p\) | 95% CI |
|---|---|---|---|---|---|
ln_pop |
−0.8237 | 0.2942 | −2.80 | 0.005 | [−1.4023, −0.2450] |
year |
0.1320 | 0.0066 | 20.04 | < 0.001 | [0.1191, 0.1450] |
N = 2,983 (one singleton dropped) · 337 municipality FE · CRV1 · within \(R^2 = 0.429\)
The population slope flips sign: +0.34 pooled, −0.82 within municipalities.
Task 3 · Interpretation: what the sign flip does and does not mean
- In total lights: \(-0.82 + 1 = 0.18\). When a municipality’s population grows faster than its own trend, its total light grows much less than proportionally, so light per person falls
- Fixed effects absorb altitude, remoteness, climate, historical infrastructure: the cross-sectional “size premium” was mostly these traits
- But within-municipality population varies very little (0.4% of its variance) and moves almost linearly with time. With a year trend in the model, \(\beta\) is identified from small deviations of population from its trend
Treat −0.82 as fragile: population figures between censuses are usually projections, so their year-to-year deviations may be smoothing artefacts, not real migration.
Task 4 · Code: year effects instead of a linear trend
# continues from the previous block
fit_yfe = pf.feols("ln_NTLpc ~ ln_pop + C(year) | asdf_id", data=panel_reg,
                   vcov={"CRV1": "asdf_id"})                 # 2012 = reference year
yk = [k for k in fit_yfe.coef().index if k.startswith("C(year)")]
R = np.array([[1.0 * (k == a) for k in fit_yfe.coef().index] for a in yk])
print(fit_yfe.wald_test(R=R))                                # H0: no year effects
print(fit_yfe.coef()[yk].round(3)) # path relative to 2012Task 4 · Output: lights jump in 2017, then plateau
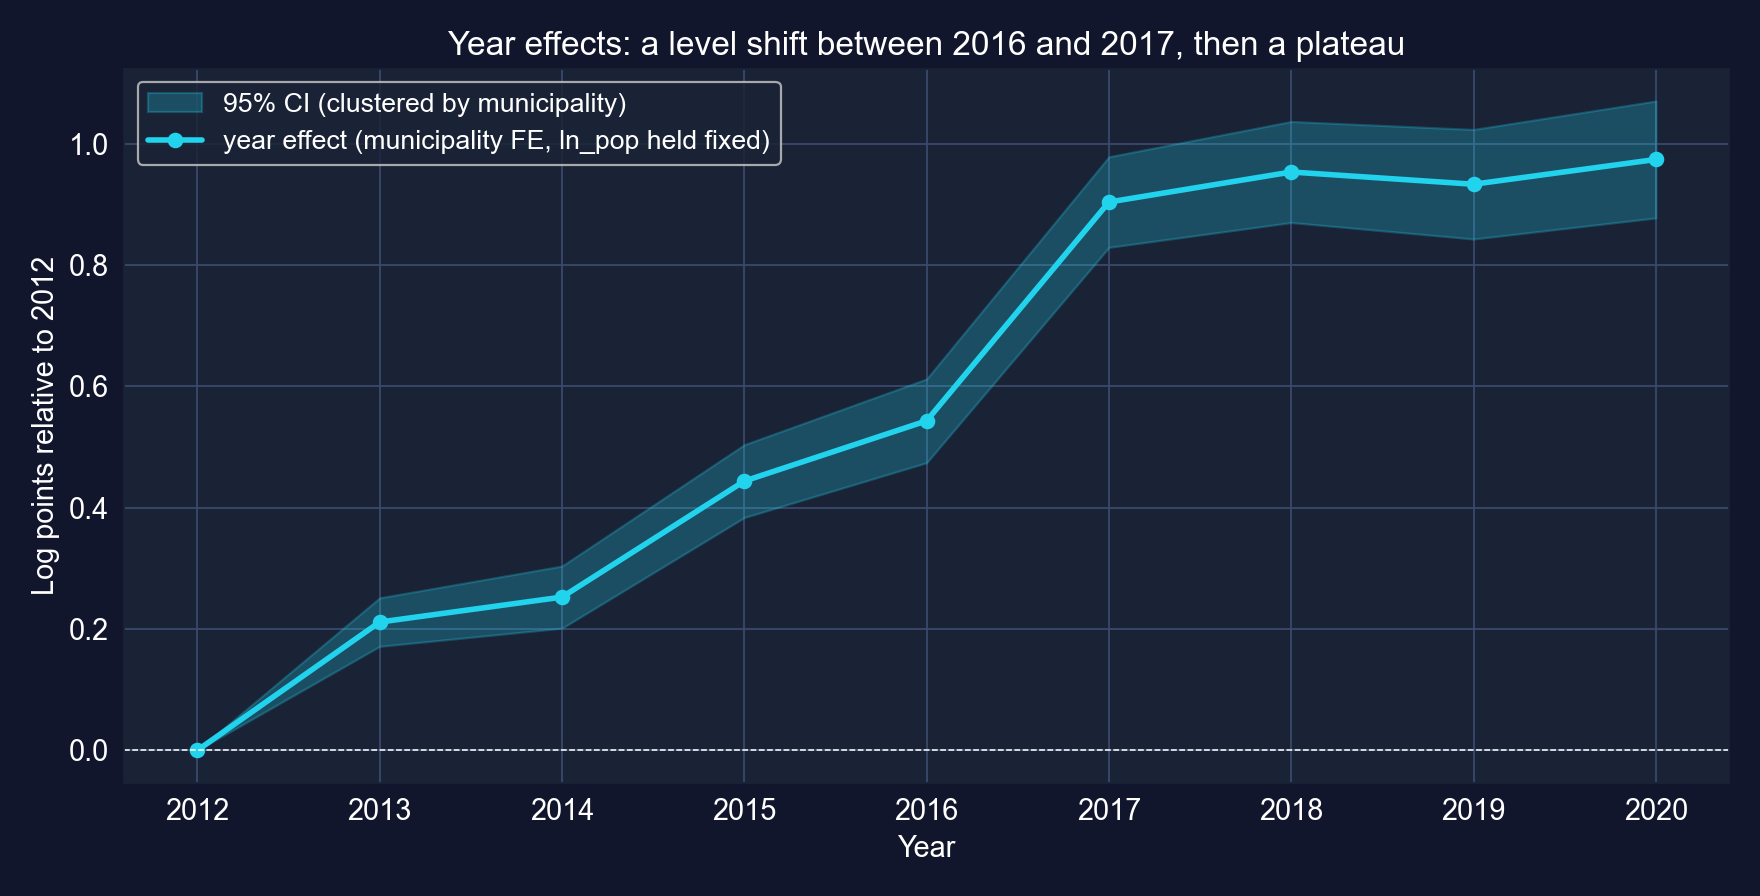
Year effects (log points relative to 2012), with municipality FE and log population held fixed.
Joint test of the 8 year effects: Wald \(\chi^2(8) = 706.3\), \(p < 0.001\) · ln_pop −0.8173 (SE 0.2957) · within \(R^2 = 0.469\) · computed for these slides
Not steady growth: +0.54 by 2016, a jump of 0.36 to 2017, then a plateau near +0.95. Ask whether the satellite product or its processing changed before reading a jump as development.
Task 5 · Code: first differences
# continues from the previous block
panel_reg = panel_reg.sort_values(["asdf_id", "year"])
panel_reg["d_ln_NTLpc"] = panel_reg.groupby("asdf_id")["ln_NTLpc"].diff()   # vs previous row
panel_reg["d_ln_pop"] = panel_reg.groupby("asdf_id")["ln_pop"].diff()
fd_data = panel_reg.dropna(subset=["d_ln_NTLpc", "d_ln_pop"])               # drop first years
fit_fd = pf.feols("d_ln_NTLpc ~ d_ln_pop", data=fd_data, vcov={"CRV1": "asdf_id"})
fit_fd.summary() # change on changeTask 5 · Output: first differences point the same way, less precisely
| Variable | Coef. | SE | \(t\) | \(p\) | 95% CI |
|---|---|---|---|---|---|
| Intercept | 0.1200 | 0.0059 | 20.29 | < 0.001 | [0.1083, 0.1316] |
d_ln_pop |
−0.5205 | 0.2928 | −1.78 | 0.076 | [−1.0964, 0.0554] |
N = 2,647 · CRV1 by municipality · \(R^2 = 0.002\) · the intercept is the average yearly change (≈ +12.7% a year in per-capita lights)
Task 5 · The population slope across four estimators
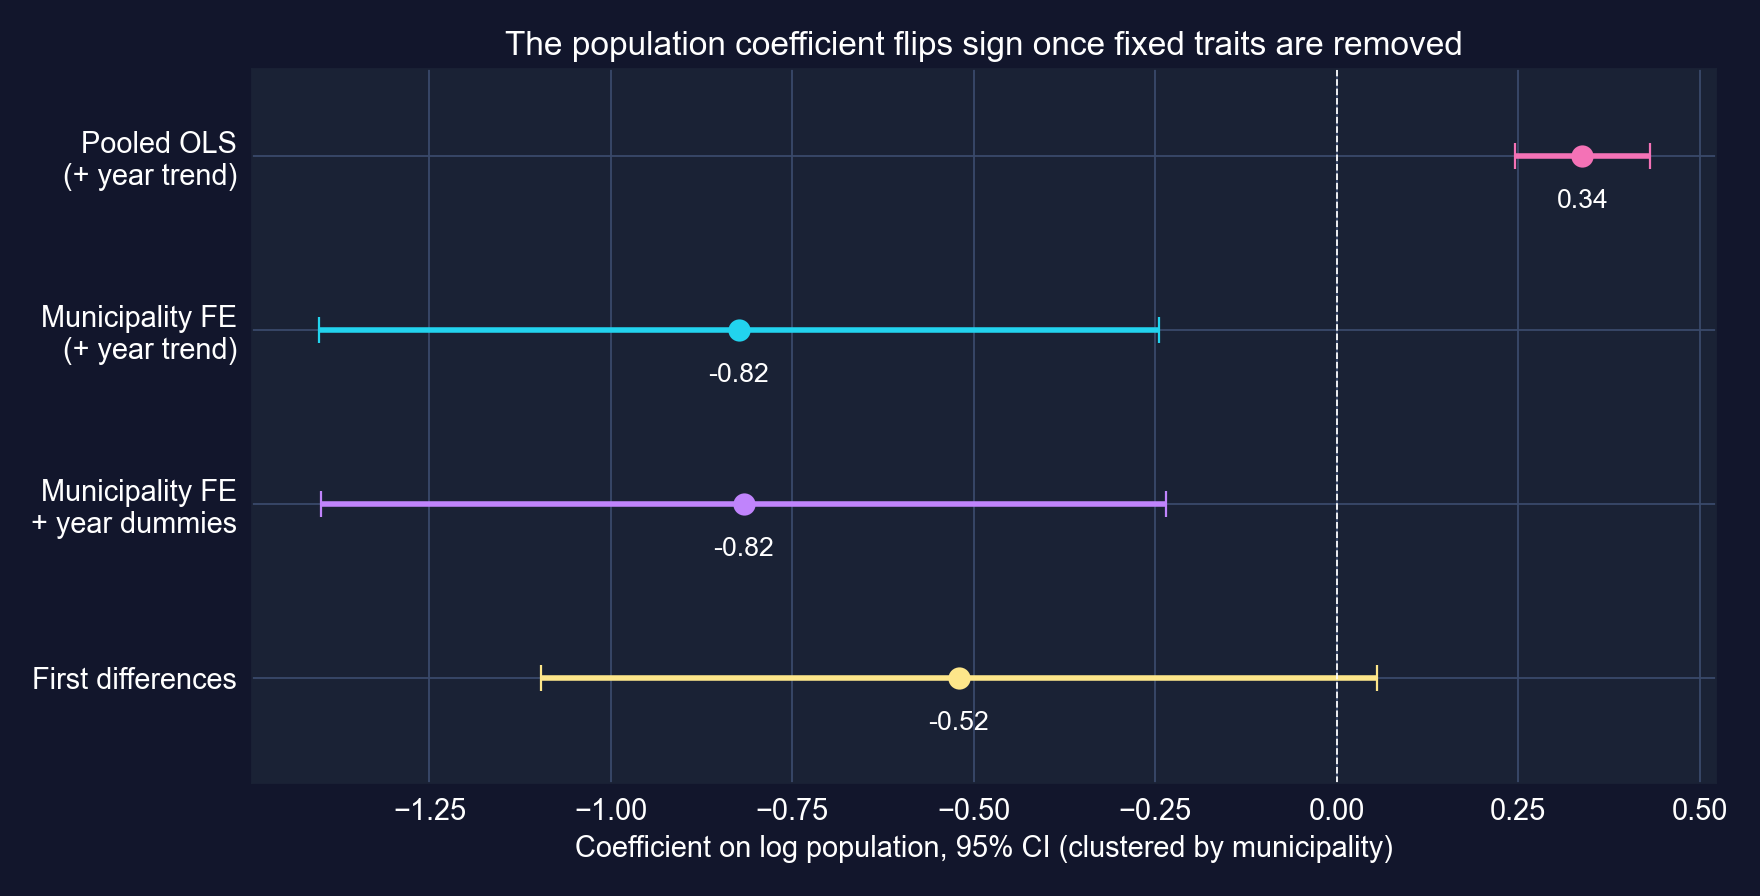
Coefficient on log population, 95% CIs clustered by municipality, across four specifications.
Positive between municipalities, negative within them, and only borderline in first differences.
Task 5 · FE vs FD: same idea, different weights
- Both remove \(\alpha_i\). FE compares each year with the municipality’s 9-year average; FD compares each year with the previous one
- With \(T > 2\) they differ when errors are serially correlated or the timing of effects matters: FE is efficient with serially uncorrelated errors, FD with random-walk errors
- Here: FE −0.82 (\(p = 0.005\)), FD −0.52 (\(p = 0.076\)); same sign, overlapping CIs
Both point the same way, but FD cannot reject zero at 5%. The population slope is the weakest link in this case study.
Task 6 · Code: the evidence for the panel brief
# continues from the previous block (computed for these slides)
for v in ["ln_NTLpc", "ln_pop"]:
    overall = panel_reg[v].var()                                       # all rows
    between = panel_reg.groupby("asdf_id")[v].mean().var()            # municipality means
    within = panel_reg.groupby("asdf_id")[v].apply(lambda x: x - x.mean()).var()
    print(v, round(overall, 4), round(between, 4), round(within, 4))
dep = panel_reg.pivot_table(index="dep", columns="year", values="ln_NTLpc", aggfunc="mean")
print((dep[2020] - dep[2012]).sort_values().round(2)) # change by departmentTask 6 · The panel brief, in numbers
| Evidence | Result |
|---|---|
Variation in ln_NTLpc |
95% between municipalities; within changes are small but real |
| Pooled population slope | +0.34 (cluster SE 0.047): bigger places brighter per person |
| FE / FD population slope | −0.82 (\(p = 0.005\)) / −0.52 (\(p = 0.076\)): fragile |
| Time path (year effects) | +0.97 log points 2012 → 2020, with a 0.36 jump in 2017 |
| By department, 2012 → 2020 | Chuquisaca +1.24, Beni +1.20, La Paz +1.04 … Tarija +0.46, Pando −0.50 |
- Advantages: annual, consistent coverage of all municipalities where surveys are rare
- Limits: sensor changes; a projected population denominator; lights see electrified activity only
- Add: time-varying covariates (electrification, roads, transfers)
Satellite panels can track municipal change over time, but the within-municipality slope is only as good as the time variation in the regressor.
Reading it right
Act III · The resolution
Which variation identified each slope?
| Example | Coefficient | All variation (pooled / levels) | Within or changes only | Change |
|---|---|---|---|---|
| NBA revenue | wins |
0.00675 | FE: 0.00451 | −33% |
| Productivity, 108 countries | ln_kl |
0.714 | FE: 0.438 | −39% |
| Productivity, 108 countries | h |
0.141 | FE: 0.223 | +58% |
| Night lights, 337 municipalities | ln_pop |
+0.338 | FE: −0.824; FD: −0.521 | sign flips |
| Treasury rates | 1-year rate | levels + trend: 0.508 | changes: 0.720 | different question |
No rule says the within estimate is smaller. It can shrink, grow or flip. What is constant is the lesson: the comparison defines the coefficient.
Which standard error was honest?
| Example | Honest SE | Ratio to default SE | What the default ignored |
|---|---|---|---|
| NBA, pooled | cluster by team | 1.81 | 10 seasons of one team are correlated |
| NBA, FE | cluster by team | 1.42 | serial correlation left after removing \(\alpha_i\) |
| Countries, pooled | cluster by country | 4.03 (ln_kl) |
25 smooth years per country |
| Municipalities, pooled | cluster by municipality | 2.37 (ln_pop), 0.71 (year) |
within-municipality dependence, either sign |
| Treasury rates, levels | Newey–West, 24 lags | 3.65 | residual autocorrelation of 0.95 |
Same coefficients, very different confidence. Inference must allow the dependence the data actually have, and it can move the SE either way.
Choosing an estimator: a short guide
- Unit traits drive both \(x\) and \(y\)? Fixed effects (plus time effects); cluster by unit
- Unit effects unrelated to \(x\)? Random effects; check with Hausman or Mundlak
- Trending time series? Check the correlogram; use changes or AR/ADL dynamics; HAC SEs
- Binary outcome? LPM for averages; logit for probabilities, with marginal effects
- Time-varying confounders or feedback? You need a design: IV, DiD, RD, RCT
Start from the structure of the data and the likely confounders, then pick the estimator, then the standard error.
The tempting mistake — and the correction
Objection. “Fixed effects control for unobserved heterogeneity, so the FE coefficient is causal.”
Response. FE remove only what is constant within a unit. In the NBA a new star raises wins and revenue in the same season; in Bolivia population and lights co-move with whatever drives local growth. And FE throw away the between variation, so the estimate rests on the within variation that remains: 69% of the variance of wins, but only 0.4% of the variance of municipal population.
FE are a design with an assumption (no time-varying confounders) and a cost (less variation). Check both before saying “effect”.
Five questions to ask of any panel or time-series coefficient
- Which variation? Between, within, changes, or two shared trends?
- Which units? Log points, percent, percentage points, probability, odds?
- Which standard error? Clustered at the level where shocks are shared, or HAC over the right horizon?
- What is held fixed? Unit effects, time effects, a trend, lagged values?
- What could still move both \(x\) and \(y\)? Time-varying confounders, feedback, common shocks?
The unit errors corrected in this deck: rate changes in percentage points (not %), logit coefficients as log-odds (not probabilities), and log-point effects converted with \(e^b - 1\).
What to carry forward
- Panels: decompose the variation; FE use only the within part; cluster by unit
- FE vs RE: FE survive correlated unit effects; RE needs them uncorrelated
- Logit: report marginal effects, and say AME or MEM
- Time series: high \(R^2\) in levels is a warning; check residual autocorrelation
- Dynamics: ADL multipliers trace how effects build (0.74 → 0.53)
- Causation: FE and differencing remove some confounders; designs handle the rest