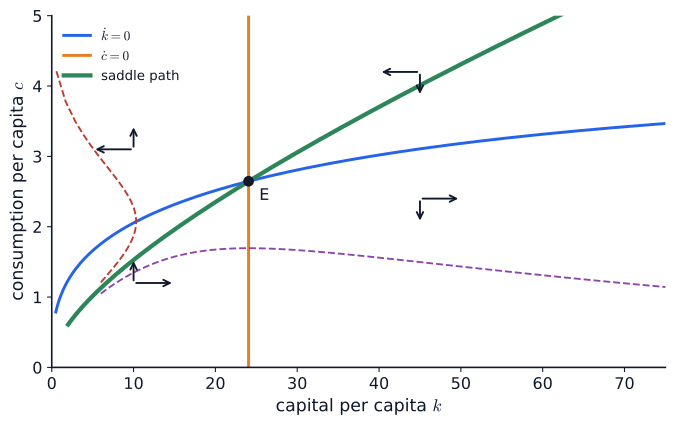
kp, cp = m.saddle_path(2, 75)

def diverge(k0, c0, T=400):
    stop_lo = lambda t, y: y[0] - 0.5; stop_lo.terminal = True
    stop_c = lambda t, y: y[1] - 0.05; stop_c.terminal = True
    stop_hi = lambda t, y: y[0] - 75; stop_hi.terminal = True
    sol = solve_ivp(m.dynamics, (0, T), [k0, c0], events=[stop_lo, stop_c, stop_hi], max_step=0.5)
    return sol.y

def draw(ax, c):
    k = np.linspace(0.5, 75, 400)
    ax.plot(k, m.c_kdot0(k), color=c["blue"], label=r"$\dot k = 0$")
    ax.axvline(ks, color=c["orange"], label=r"$\dot c = 0$")
    ax.plot(kp, cp, color=c["green"], lw=3.2, label="saddle path")
    k0 = 6.0
    c_sp = float(np.interp(k0, kp, cp))
    for dc, col in ((0.08, c["red"]), (-0.08, c["purple"])):
        y = diverge(k0, c_sp + dc)
        ax.plot(y[0], y[1], color=col, lw=1.4, ls="--")
    # direction arrows in the four regions (signs of kdot, cdot from eqs. 3.5 and 3.15)
    for (kx, cy) in ((10, 1.2), (10, 3.1), (45, 2.4), (45, 4.2)):
        dk, dcdt = m.dynamics(0, [kx, cy])
        ax.annotate("", xy=(kx + 5 * np.sign(dk), cy), xytext=(kx, cy),
                    arrowprops=dict(arrowstyle="->", color=c["fg"], lw=1.4))
        ax.annotate("", xy=(kx, cy + 0.35 * np.sign(dcdt)), xytext=(kx, cy),
                    arrowprops=dict(arrowstyle="->", color=c["fg"], lw=1.4))
    ax.plot([ks], [cs], "o", color=c["fg"], ms=7)
    ax.annotate("E", (ks, cs), xytext=(8, -14), textcoords="offset points", color=c["fg"])
    ax.set_xlim(0, 75); ax.set_ylim(0, 5)
    ax.set_xlabel(r"capital per capita $k$")
    ax.set_ylabel(r"consumption per capita $c$")
    ax.legend(loc="upper left", fontsize=10)
keygraph(draw, "phase")