Chapter 3 — Data lab: does consumption grow faster when interest rates are high? And is r > g?
Macroeconomics for Public Policy: A Study Companion to Advanced Macroeconomics. Test the Euler equation, \(\dot c / c = \sigma (r - \rho)\), and Piketty’s \(r > g\) with US data. 🟢 run and interpret · 🔵 “Your turn” tasks with self-checks · 🔴 extensions.
# Setup: pandas, numpy, matplotlib and statsmodels are preinstalled in Colab.from pathlib import Pathimport numpy as npimport pandas as pdimport matplotlib.pyplot as pltimport statsmodels.api as smDATA_BASE ="https://quarcs-lab.github.io/macro4pp/data/"# dated snapshots published with the siteSNAP ="2026-10-15"def load(relpath, **kw):"""Load a snapshot: the local repo copy if present, else the published one.""" local = Path("../data") / relpathreturn pd.read_csv(local if local.exists() else DATA_BASE + relpath, **kw)q = load(f"fred/us-consumption-prices-gdp-per-capita_{SNAP}.csv", parse_dates=["observation_date"])gdp = load(f"fred/us-real-gdp_{SNAP}.csv", parse_dates=["observation_date"])tb = load(f"fred/us-tbill-3m_{SNAP}.csv", parse_dates=["observation_date"])q.tail(3)
observation_date
A794RX0Q048SBEA
PCECTPI
A939RX0Q048SBEA
315
2025-10-01
48490
128.097
70453
316
2026-01-01
48555
129.415
70857
317
2026-04-01
48982
131.006
71212
The question
The Euler equation predicts that consumption grows faster when the real interest rate is higher, with slope \(\sigma\) (the elasticity of intertemporal substitution). On the balanced growth path the model also has \(r = \rho > n = g\). We test both with US data from FRED: real consumption per capita (A794RX0Q048SBEA), the PCE price index (PCECTPI), real GDP (GDPC1) and the 3-month Treasury bill rate (TB3MS).
🟢 Core — build annual series and look at them
Consumption and GDP are quarterly, the T-bill rate is monthly. We average each to annual data (complete years only), then compute growth rates as \(100 \times \Delta \ln x\). The real rate is the T-bill rate minus inflation (an ex-post real rate).
Code
for x in (q, gdp, tb): x["year"] = x["observation_date"].dt.yearann = (q.groupby("year").agg(c=("A794RX0Q048SBEA", "mean"), p=("PCECTPI", "mean"), nq=("PCECTPI", "size")) .join(gdp.groupby("year").agg(Y=("GDPC1", "mean"))) .join(tb.groupby("year").agg(i=("TB3MS", "mean"), nm=("TB3MS", "size"))))ann = ann[(ann.nq ==4) & (ann.nm ==12)].copy() # keep complete years onlyann["pi"] =100* np.log(ann.p).diff() # inflation, %ann["g"] =100* np.log(ann.Y).diff() # aggregate real GDP growth, %ann.dropna().tail()
c
p
nq
Y
i
nm
pi
g
year
2021
44505.50
108.89550
4
21556.00200
0.044167
12
3.960960
6.079725
2022
45546.50
116.03750
4
22079.72600
2.021667
12
6.352471
2.400552
2023
46213.75
120.50500
4
22724.13500
5.068333
12
3.777783
2.876776
2024
47131.50
123.66200
4
23394.89200
4.966667
12
2.586079
2.909013
2025
48108.75
126.86575
4
23943.30525
4.066667
12
2.557740
2.317105
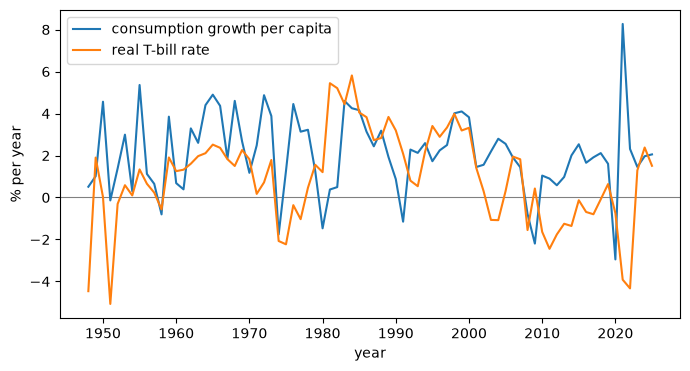
Predict before you plot: if \(\sigma\) were large, how would consumption growth and the real rate move together? Run the next cell and compare.
Interpret. Find two periods with a negative real rate. What does the Euler equation predict for consumption growth in those years? What actually happened?
🔵 Advanced — Your turn
The self-checks assume the dated snapshot loaded above.
Task 1. Create a DataFrame d from ann with two new columns: gc, consumption growth per capita in % (\(100 \times \Delta \ln c\)), and r, the ex-post real rate in % (T-bill rate i minus inflation pi). Drop rows with missing values.
assertlen(d) ==78, "Expected 78 complete years (1948–2025). Did you drop missing values?"assertabs(d.gc.mean() -2.078) <0.01, "Mean consumption growth should be about 2.08% — use 100 * np.log(...).diff()."assertabs(d.r.mean() -0.941) <0.01, "Mean real rate should be about 0.94% — subtract inflation from the T-bill rate."print("✓ Task 1 looks right")
✓ Task 1 looks right
Task 2. Estimate the Euler-equation slope: regress gc on a constant and r with statsmodels OLS. Store the slope in sigma_hat. Is it close to the \(\sigma = 1\) of log utility?
assertabs(share_rg -19.2) <0.5, "About 19% of years — compare d.r with d.g and take the mean of the boolean."print(f"✓ Task 3: r > g in {share_rg:.0f}% of years for the SAFE rate. Why might the return on capital differ?")
✓ Task 3: r > g in 19% of years for the SAFE rate. Why might the return on capital differ?
🔴 Frontier — extensions
Instrumental variables. The ex-post real rate is measured with error and timing is blurred by annual averaging. Re-estimate \(\sigma\) using lagged real rates and lagged inflation as instruments (two-stage least squares, e.g. statsmodels.sandbox.regression.gmm.IV2SLS). Does \(\hat\sigma\) change?
Ex-ante real rate. Fetch the University of Michigan inflation expectations series (MICH, monthly, copyrighted, citation required, so fetch it live, don’t redistribute it) and build \(i - \pi^e\).
Which r? Repeat Task 3 with the 10-year Treasury yield (GS10) minus inflation. How does the answer change?
Refresh from source (optional)
The cells above use a dated snapshot so results are reproducible. Call refresh() to fetch today’s data from FRED (no API key needed), then re-run the notebook from the Core section.
Code
def refresh():"""Fetch the latest FRED data into q, gdp, tb (keyless CSV endpoint)."""global q, gdp, tb base ="https://fred.stlouisfed.org/graph/fredgraph.csv?id=" q = pd.read_csv(base +"A794RX0Q048SBEA,PCECTPI", parse_dates=["observation_date"]) gdp = pd.read_csv(base +"GDPC1", parse_dates=["observation_date"]) tb = pd.read_csv(base +"TB3MS", parse_dates=["observation_date"])print("Fetched up to", q.observation_date.max().date())
Sources and licences
U.S. Bureau of Economic Analysis (A794RX0Q048SBEA, PCECTPI, GDPC1) and Board of Governors of the Federal Reserve System (TB3MS), retrieved from FRED, Federal Reserve Bank of St. Louis, 2026-10-15. Public domain.