Preface: Econometrics Powered by AI
metricsAI: An Introduction to Econometrics with Python and AI in the Cloud
Welcome to a new approach to learning econometrics—one that embraces the power of modern computational tools and artificial intelligence while maintaining the rigor of traditional econometric theory.
![]()
Introduction
Welcome to Econometrics Powered by AI: An Introduction Using Cloud-based Python Notebooks. This book represents a new approach to learning econometrics—one that embraces the power of modern computational tools while maintaining the rigor of traditional econometric theory. In an era where artificial intelligence is transforming how we learn, work, and conduct research, this book seeks to bridge the gap between foundational statistical concepts and cutting-edge learning technologies.
The vision behind this project is simple yet ambitious: to make econometrics accessible, interactive, and engaging for a new generation of learners. By combining authoritative textbook content with cloud-based computational notebooks and AI-enhanced learning tools, I aim to modernize the often-daunting journey of learning econometrics into an more exciting AI-powered discovery of economic stories based real data.
The Challenge of Learning Econometrics
Econometrics has traditionally been taught through a combination of theoretical lectures, textbook readings, and problem sets. While this approach has served generations of students, it faces several inherent limitations in today’s learning environment. Traditional textbooks, no matter how well-written, remain fundamentally passive learning tools. Students read about regression analysis, hypothesis testing, and statistical inference, but the gap between reading about these concepts and actually implementing them can be substantial.
Technical barriers compound these challenges. Learning econometrics typically requires installing statistical software, navigating complex syntax, managing data files, and troubleshooting installation issues—all before a single regression can be estimated. For many students, these technical hurdles can be discouraging, diverting energy away from understanding core concepts and toward wrestling with software configuration.
Moreover, there exists a persistent gap between theory and practical implementation. Students may understand the mathematical derivation of the ordinary least squares estimator but struggle to translate that knowledge into working code that analyzes real data. This disconnect between “knowing” and “doing” is still a challenge in econometrics education.
This Book’s Approach
This book takes a different approach. It serves as a companion to A. Colin Cameron’s textbook, Analysis of Economics Data: An Introduction to Econometrics (2022). Specifically, it brings its key lessons and examples into the interactive, computational world of Python programming and AI-enhanced learning.
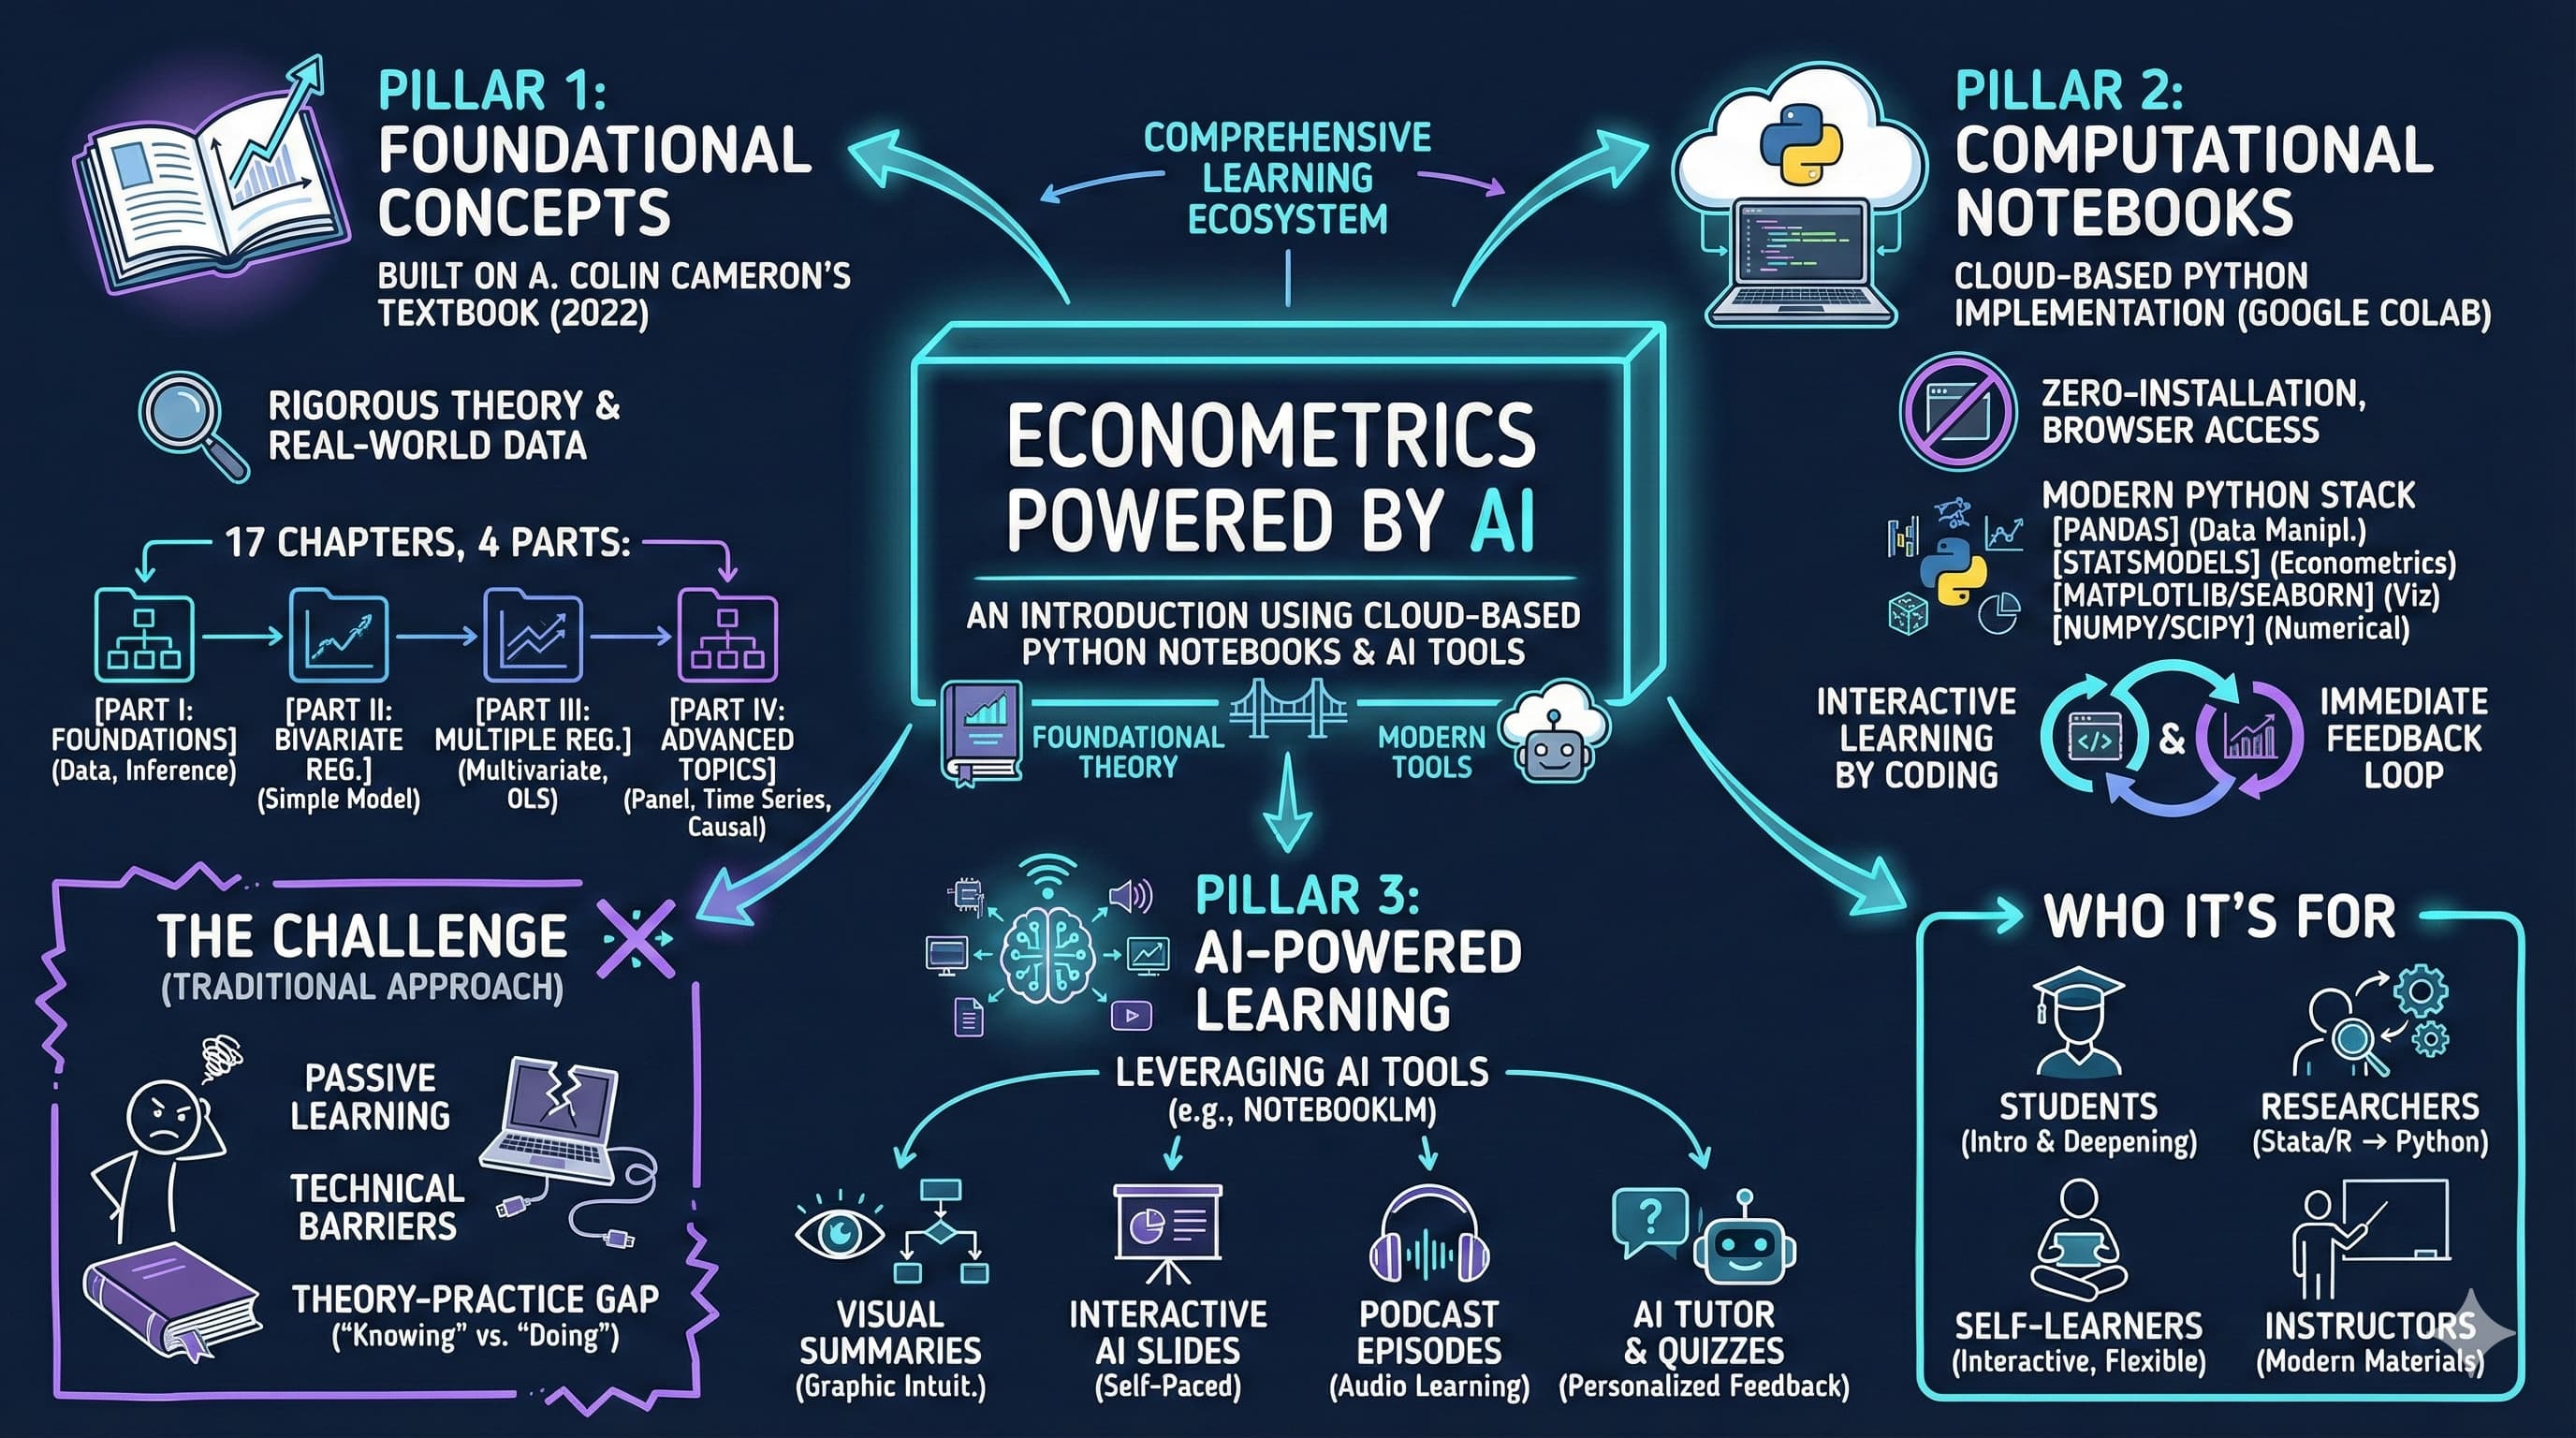
At the heart of this approach is a three-pillar methodology that combines Foundational Concepts, Computational Notebooks, and AI-Powered Learning. These three pillars work together to create a comprehensive learning ecosystem that addresses the limitations of traditional econometrics education while leveraging the best of what modern technology offers.
The foundational concepts pillar ensures that students build their understanding on Cameron’s pedagogical framework, covering everything from basic statistical foundations to advanced topics in panel data and causation. The computational notebooks pillar provides zero-installation, browser-based access to Python implementations of every concept, allowing students to learn by coding from the very first chapter. The AI-powered learning pillar enhances this foundation with visual summaries, interactive slides, podcast discussions, quizzes, and an AI tutor—all designed to reinforce learning through multiple modalities.
This is not just a textbook with code examples—it’s a reimagining of how econometrics can be taught and learned in the age of cloud computing and artificial intelligence.
Who This Book Is For
This book is designed for a diverse audience of learners:
Economics and social science students will find a comprehensive introduction to econometrics that emphasizes hands-on learning with real data. Whether you’re taking your first econometrics course or looking to deepen your quantitative skills, the combination of theory and practice provided here will serve you well.
Researchers transitioning from Stata or R to Python will appreciate the parallel structure that follows Cameron’s familiar textbook while introducing Python’s powerful ecosystem of data science libraries. Each chapter demonstrates how classic econometric techniques can be implemented using modern Python tools like Pandas, Statsmodels, and Linearmodels.
Self-learners seeking interactive resources will benefit from the zero-installation requirement and comprehensive AI support. Simply open a notebook in your browser and start learning—no complex setup required. The multiple learning modalities (notebooks, podcasts, slides, quizzes) allow you to create a personalized learning path that fits your style and schedule.
Instructors looking for modern teaching materials will find ready-made computational notebooks, AI-generated slides, and assessment tools that can supplement traditional lectures. The materials are designed to be flexible, allowing instructors to adopt the entire framework or selectively incorporate individual components into their existing courses.
Why This Book? Three Pillars of Learning
Pillar 1: Foundational Concepts
Built on Cameron’s Introductory Textbook
The foundation of this book rests on A. Colin Cameron’s Analysis of Economics Data: An Introduction to Econometrics (2022), an accessible introductory textbook that provides a clear exposition of econometric concepts and practical approach to data analysis. Cameron’s work provides comprehensive coverage of introductory econometric theory while maintaining an accessible writing style that resonates with students.
By building on this pedagogical framework, we ensure that the statistical and econometric foundations you learn are rigorous, complete, and aligned with how econometrics is actually practiced by researchers. The book features real-world datasets and examples drawn from economics and social sciences, demonstrating how econometric methods are applied to answer important research questions.
Core Statistical Principles
The book covers the complete spectrum of econometric methods, from foundational statistical concepts through advanced techniques. You’ll begin with statistical foundations, learning about descriptive statistics, probability distributions, sampling theory, and statistical inference. These fundamentals provide the mathematical and statistical toolkit needed for all subsequent econometric analysis.
From there, you’ll progress through bivariate regression analysis, learning how to model relationships between two variables, estimate linear relationships, and conduct hypothesis tests. Multiple regression analysis extends these techniques to multivariate settings, introducing concepts like omitted variable bias, multicollinearity, and model specification testing.
Finally, advanced topics cover panel data methods, time series analysis, and approaches to establishing causation—techniques that are essential for modern empirical research in economics and social sciences. Throughout, theory is consistently grounded in practical applications, showing how abstract statistical concepts translate into tools for answering real research questions.
17 Chapters, Four Parts
The book’s 17 chapters are organized into four coherent parts that build systematically from foundations to advanced applications:
Part I: Statistical Foundations (Chapters 1-4) introduces you to data analysis, summary statistics, the sample mean, and statistical inference. These chapters establish the statistical toolkit you’ll use throughout the course.
Part II: Bivariate Regression (Chapters 5-9) covers simple regression analysis, from data summarization through least squares estimation, statistical inference, case studies, and models with natural logarithms. These chapters develop your understanding of the fundamental regression model.
Part III: Multiple Regression (Chapters 10-13) extends regression to multiple explanatory variables, covering data summary techniques, statistical inference, advanced topics, and extensive case studies that demonstrate how multiple regression is applied in practice.
Part IV: Advanced Topics (Chapters 14-17) introduces indicator variables, variable transformations, model diagnostics, and concludes with panel data, time series methods, and causal inference—techniques at the frontier of applied econometric research.
Pillar 2: Computational Notebooks
Cloud-Based Python Implementation
Every one of the 17 chapters has a corresponding Google Colab notebook that brings the econometric concepts to life through interactive Python code. This cloud-based approach eliminates the single biggest barrier to learning computational econometrics: software installation and configuration.
With Google Colab, there’s zero installation required. You simply click an “Open in Colab” badge, and within seconds you’re running code in your browser. There’s no need to install Python, manage package dependencies, or troubleshoot compatibility issues. Google Colab provides free access to computing resources, including CPUs and GPUs, ensuring you have the computational power needed for data analysis.
This approach removes all technical barriers to getting started. Whether you’re using a Windows PC, a Mac, a Chromebook, or even a tablet, as long as you have internet access and a web browser, you can work through every chapter of this book.
Modern Python Stack
The notebooks leverage Python’s rich ecosystem of data science and statistical libraries, introducing you to the same tools used by professional data scientists and researchers worldwide.
Pandas serves as the foundation for data manipulation and analysis, providing powerful tools for loading, cleaning, transforming, and summarizing datasets. Statsmodels provides econometric modeling capabilities, including OLS regression, generalized linear models, and time series analysis. Linearmodels extends this toolkit with advanced regression techniques specifically designed for econometric applications.
For visualization, we use Matplotlib and Seaborn, which together provide publication-quality graphics for exploring data and presenting results. NumPy and SciPy handle the numerical computing that underlies all statistical analysis, from matrix operations to optimization algorithms.
Learning these tools doesn’t just teach you econometrics—it provides you with a valuable skillset that transfers directly to careers in data science, quantitative research, policy analysis, and consulting.
Interactive Learning by Coding
Google Colab notebooks are fundamentally interactive documents that combine code, explanations, and results in a single, cohesive environment. Unlike static textbooks or lecture slides, notebooks allow you to see the code that generates each table and figure, modify that code, and immediately see the results of your changes.
This immediate feedback loop transforms learning from passive consumption to active experimentation. Wondering what happens if you change a parameter? Modify the code and re-run the cell. Curious about how a result changes with different data? Load a different dataset and see for yourself. Want to extend an analysis beyond what the textbook shows? Add your own code cells and explore.
Each notebook provides step-by-step implementation of econometric concepts, starting from data loading and proceeding through analysis, visualization, and interpretation. Code is thoroughly commented and explained, ensuring you understand not just what each line does, but why it’s needed and how it fits into the broader analysis.
Accessibility and Convenience
The cloud-based approach provides unprecedented accessibility. You can access your work from any device with an internet connection—start working on your desktop at home, continue on a laptop at a café, and review results on a tablet while commuting. There are no storage space requirements on your local machine; everything is saved in the cloud.
Your notebooks are always up-to-date with the latest software dependencies, as Google Colab maintains the underlying Python environment. You never have to worry about package version conflicts or breaking changes—everything just works. The platform also includes collaborative features for group learning, allowing students to work together on assignments, share insights, and learn from each other’s approaches.
Pillar 3: AI-Powered Learning
Leveraging Google’s NotebookLM and AI Tools
The third pillar of our approach harnesses the power of artificial intelligence to enhance learning. We’ve developed AI-enhanced study materials for all 17 chapters, leveraging cutting-edge tools like Google’s NotebookLM and Gemini PRO to create multiple learning modalities that accommodate diverse learning preferences.
These AI tools provide interactive learning assistance, offering explanations, answering questions, and helping you develop deeper understanding of complex concepts. The materials support multiple modalities—visual, auditory, textual, and interactive—ensuring that regardless of your preferred learning style, you’ll find resources that resonate with you.
AI-Generated Visual Summaries
Each chapter includes a visual summary that distills the key concepts into an intuitive, graphical format. These summaries present chapter content visually, highlighting the relationships between concepts, the flow of ideas, and the main takeaways.
Visual summaries serve as both quick reference tools and review aids. Before diving into a chapter, you can preview the visual summary to understand what you’ll learn. After completing a chapter, the visual summary helps consolidate your understanding and serves as a memory aid for later review. Research consistently shows that visual learning enhances retention, and these AI-generated summaries leverage that insight.
AI-Generated Video Overviews
To complement the static visual summaries, each chapter includes an AI-generated video overview that brings key concepts to life through motion, animation, and narration. These short videos, typically less than 10 minutes, provide visual explanations of the most important ideas in each chapter, presented in an intuitive and engaging format.
The videos are designed for first-time learning and quick reviews. Before diving into a chapter’s notebook, watch the video overview to build a mental framework for the concepts you’ll encounter. The combination of visual animation and clear narration helps you understand the “big picture” before engaging with code and mathematical details. After completing a chapter, the video serves as an efficient review tool, allowing you to quickly refresh your understanding of key concepts without re-reading the entire notebook. Like all resources in this learning ecosystem, videos are AI-generated using cutting-edge tools, ensuring consistent quality and pedagogical clarity across all the 17 chapters.
Interactive AI Slides and Presentations
For each chapter, we’ve generated presentation materials using NotebookLM that complement the traditional slides created by Professor Cameron. These AI-generated slides are designed for self-paced learning, with clear explanations, progressive concept building, and visual aids that clarify complex ideas.
The slides are presentation-ready, making them useful not just for individual study but also for group discussions, study sessions, or classroom presentations. They provide an alternative way to engage with the material, breaking down complex topics into digestible chunks that can be reviewed at your own pace.
Podcast Episodes for Audio Learning
One of the most innovative features of this learning ecosystem is the availability of AI-generated podcast discussions for all 17 chapters. These podcasts present chapter content through conversational dialogue, making complex econometric concepts accessible through natural language discussion.
Podcasts provide a perfect learning modality for commuting, exercising, or any time when visual focus isn’t possible. The conversational format—where concepts are explained through dialogue rather than formal lecture—often makes difficult ideas more approachable. Complex topics are explained through back-and-forth discussion, reinforcing key concepts and providing alternative perspectives on the material.
These audio resources offer an alternative learning modality that complements the visual and interactive elements of notebooks and slides, ensuring you can continue learning even when you’re away from your computer.
Quiz and AI Tutor Integration
Assessment and feedback are critical components of effective learning. Each chapter includes interactive quizzes powered by EdCafe and NotebookLM that test your understanding of key concepts. These aren’t just multiple-choice questions—they’re interactive self-assessment tools that provide immediate feedback and personalized learning assistance based on your responses.
When you struggle with a concept, the AI tutor is available to provide code explanations, clarify theoretical points, and guide you toward understanding. This immediate, personalized support ensures you don’t get stuck—help is always available when you need it. The AI tutor can explain why a particular approach works, suggest alternative methods, and help debug code when things don’t work as expected.
Responsible Use of AI Tools
While AI tools provide powerful learning support, it’s crucial to understand their proper role in your education. AI serves as an enhancement, not a replacement for critical thinking and genuine understanding. The foundation of your learning remains Cameron’s authoritative textbook and the verified Python code in the notebooks—AI tools supplement this foundation, they don’t replace it.
It’s important to cross-reference AI-generated content with authoritative sources. While tools like NotebookLM and Gemini PRO are sophisticated, they can occasionally make mistakes or oversimplify complex concepts. You bear responsibility for verifying information and developing true understanding rather than simply accepting AI-generated explanations at face value.
All Python code in the notebooks has been carefully verified and tested for accuracy. When AI tools provide code explanations or suggestions, compare them against the tested code in the notebooks to ensure accuracy. The goal is to use AI tools to develop multiple learning pathways and deeper understanding—transparency about these tools’ capabilities and limitations is essential to using them effectively.
Key resources for learning
This book is designed to be used in conjunction with two essential companion resources:
The metricsAI Website (https://quarcs-lab.github.io/metricsai) provides access to: - Interactive Google Colab notebooks for all 17 chapters - AI-generated visual summaries, video overviews, and podcast episodes - Links to quizzes, AI tutors, and presentation slides - Quick summaries of foundational content
Cameron’s Original Textbook (Analysis of Economics Data: An Introduction to Econometrics, 2022) and materials (https://cameron.econ.ucdavis.edu/aed/index.html) provide: - Comprehensive explanations of econometric theory - Deeper mathematical derivations and proofs - Extended examples and applications - Additional exercises and practice problems - Original Stata, R, and Gretl code implementations - Comprehensive datasets and detailed slides
Together, these resources create a complete learning ecosystem: this book offers structured content and context and the website provides interactive computational tools with AI learning support.
How to Use This Book
Getting Started
One of the greatest advantages of this learning platform is that there’s no installation required—you can start learning immediately. The path from deciding to learn econometrics to running your first regression can be measured in seconds, not hours or days.
To begin, simply find the chapter you want to study and click the “Open in Colab” badge. Within moments, you’ll have a fully functional Python environment in your browser, complete with all necessary libraries, datasets, and code. You can run code cells, modify examples, and experiment with variations immediately.
We recommend following the four-part progression of the book, starting with Statistical Foundations and working through to Advanced Topics. Each chapter builds on previous material, so working sequentially ensures you have the necessary background for more complex concepts. However, the modular structure also allows you to jump to specific topics of interest if you’re already familiar with foundational material.
As you work through each chapter, make use of the supplementary AI materials as needed. Some learners will want to use every resource—notebook, visual summary, podcast, slides, and quiz. Others might focus primarily on the notebooks with occasional reference to other materials. The flexible design allows you to create a learning path that suits your needs and preferences.
For Each Chapter
To get the most out of each chapter, we recommend a multi-stage approach that combines different learning modalities:
Start by reading foundational concepts from Cameron’s textbook. While this is optional (the notebooks are self-contained), reading the corresponding textbook chapter first provides valuable theoretical context and mathematical derivations that complement the computational focus of the notebooks. The textbook explains the “why” behind methods, while notebooks show the “how.”
Run the Python notebook, executing code cells step-by-step. Don’t just run the cells passively—read the explanations, study the code, and make sure you understand what each section accomplishes. Experiment by changing parameters, trying different datasets, or extending analyses beyond what’s shown. This active engagement is where deep learning happens.
Review the visual summary for a quick overview of key concepts. The visual summary helps consolidate what you’ve learned and provides a different perspective on the chapter’s main ideas. Visual representations often reveal connections between concepts that aren’t immediately obvious in text or code.
Watch the video overview for an animated explanation of the chapter’s key concepts. Unlike the static visual summary, the video uses motion and narration to demonstrate dynamic relationships and step-by-step processes. This is particularly valuable for understanding how econometric techniques work in practice—you can see regression lines being fitted, distributions changing with different parameters, or hypothesis tests being conducted. The short format (under 10 minutes) makes videos ideal for focused learning sessions or quick reviews before exams.
Listen to the podcast for a conversational explanation of the chapter’s content. The podcast offers yet another way to engage with the material, particularly useful for reinforcement and review. Many learners find that hearing concepts explained conversationally helps cement understanding in ways that reading or coding alone doesn’t achieve.
Study the AI slides to see the material presented in presentation format. The slides break down complex topics into digestible pieces, making them ideal for review and for identifying areas where you might need additional study.
Review Cameron’s original slides for the authoritative instructor perspective. These slides, created by Professor Cameron himself, provide the traditional academic presentation of the material and often include additional insights and examples not found elsewhere.
Take the quiz to test your understanding. The EdCafe quizzes provide immediate feedback on whether you’ve truly grasped the key concepts. Don’t skip this step—self-assessment is crucial for identifying gaps in understanding before moving forward.
Consult the AI tutor whenever you need help. Whether you’re stuck on a coding problem, confused about a statistical concept, or want a deeper explanation of a particular point, the NotebookLM and EdCafe AI tutors are available to provide personalized assistance.
Customize Your Learning!
By purchasing this book, you gain access to PDF versions of each chapter. These PDFs are designed to be used with a wide range of AI-powered learning tools, giving you substantial flexibility to custimize your learning path.
Note: If you purchased the book on Leanpub, the PDFs are available directly from your Leanpub library.
The chapter PDFs are fully compatible with several AI tools that support adaptive and interactive learning. For example, NotebookLM (https://notebooklm.google.com/) can transform chapters into podcast-style audio discussions, generate personalized quizzes and flashcards, and produce interactive learning guides. EdCafe (https://www.edcafe.ai/) allows you to create custom lesson plans, interactive quizzes, and AI chatbots. It also provides personalized feedback and analytics to monitor your learning progress. AISheets (https://www.aisheets.study/) converts chapter PDFs into interactive worksheets, concept maps, and fill-in-the-blank exercises that can be edited, customized, and exported as PDFs for offline study. Importantly, the outputs generated by these tools can be adapted to multiple languages and learning styles, highlighting AI’s potential to promote inclusive learning.
You are encouraged to experiment with these PDFs and AI tools to identify the combination that best aligns with your learning preferences and objectives. Whether you prefer listening to AI-generated discussions during your commute, reinforcing understanding through interactive quizzes, or working systematically with structured worksheets, these tools offer multiple complementary pathways for mastering new concepts. They are most effective when used as supplements to—rather than substitutes for—active engagement with the Python notebooks.
Acknowledgments
A. Colin Cameron
This entire project would not exist without the foundational work of Professor A. Colin Cameron. His textbook, Analysis of Economics Data: An Introduction to Econometrics (2022), represents years of refinement in teaching econometrics with clarity, rigor, and practical relevance. Professor Cameron’s generous permission to use his textbook content and structure made this computational companion possible.
Beyond the textbook itself, Professor Cameron has created and shared extensive teaching materials—original Stata, R, and Gretl code implementations, comprehensive datasets, and detailed PDF slides. These materials have served students and instructors, and they continue to serve as the authoritative reference for this Python implementation.
Most fundamentally, Professor Cameron’s pioneering approach to making econometrics accessible and practical has been the inspiration for this entire project. His work demonstrates that rigorous econometric education need not be intimidating or inaccessible. This book attempts to extend that philosophy into the cloud computing and AI era, maintaining Cameron’s commitment to clarity while leveraging new technological capabilities.
Technology and Platform Partners
This project relies heavily on cutting-edge technology platforms that have made modern, accessible education possible:
Google Colab provides the cloud computing infrastructure that makes zero-installation learning a reality. By offering free access to powerful computing resources and maintaining up-to-date Python environments, Colab has democratized access to data science education in ways that would have been unimaginable just a few years ago.
Google’s NotebookLM powers the AI learning tools—podcasts, slides, and tutoring—that provide personalized learning support. This sophisticated AI technology transforms static educational content into interactive learning experiences tailored to individual needs and learning styles.
Google’s Gemini PRO generates the visual summaries that help consolidate understanding and provide alternative perspectives on chapter content. The ability to automatically create meaningful visualizations of complex concepts represents a significant advance in educational technology.
EdCafe provides the platform for interactive quizzes and AI tutoring, offering the assessment and feedback mechanisms that are essential for effective learning. Their tools help ensure that learning is not just exposure to content but genuine mastery of concepts.
Open Source Community
This book builds on the incredible work of the open source community that has created and maintains Python’s scientific computing ecosystem. The developers of Statsmodels, Pandas, NumPy, Matplotlib, and countless other libraries have created the tools that make sophisticated statistical analysis accessible to anyone with a computer and internet connection.
Special thanks go to the creators of Linearmodels and other econometric software tools that extend Python’s capabilities specifically for econometric analysis. The documentation writers and maintainers who make these complex tools accessible through clear explanations and examples deserve particular recognition—their work is often invisible but absolutely essential.
The open source ethos—that knowledge and tools should be freely shared for the benefit of all—is fundamental to this project. We hope this book contributes back to that community by introducing new users to Python’s capabilities and demonstrating how these tools can be applied to econometric analysis.
Students, Reviewers, and Family
Finally, thanks are due to the beta testers who worked through early versions of these notebooks and materials, providing invaluable feedback on what worked, what didn’t, and what needed clarification. Their suggestions have improved the accessibility and clarity of the final product immeasurably.
Early adopters who used these materials in courses and self-study helped identify gaps, correct errors, and refine explanations. The integration of AI tools in particular benefited from their feedback on what types of support were most valuable at different stages of learning.
This book is ultimately for students—those learning econometrics now and those who will learn in the future. The goal has been to create materials that make that learning journey more accessible, more engaging, and more successful. If this book helps you understand econometrics better, apply it more confidently, and appreciate its power for answering important questions, then the effort has been worthwhile.
This book is dedicated to my family, whose unwavering support and encouragement have made this journey possible. Their patience during long hours of writing, coding, and testing has been a source of strength and motivation. Thank you for believing in this vision and standing by me throughout this endeavor.
Now, let’s begin the journey into econometrics, powered by AI and brought to life through code.