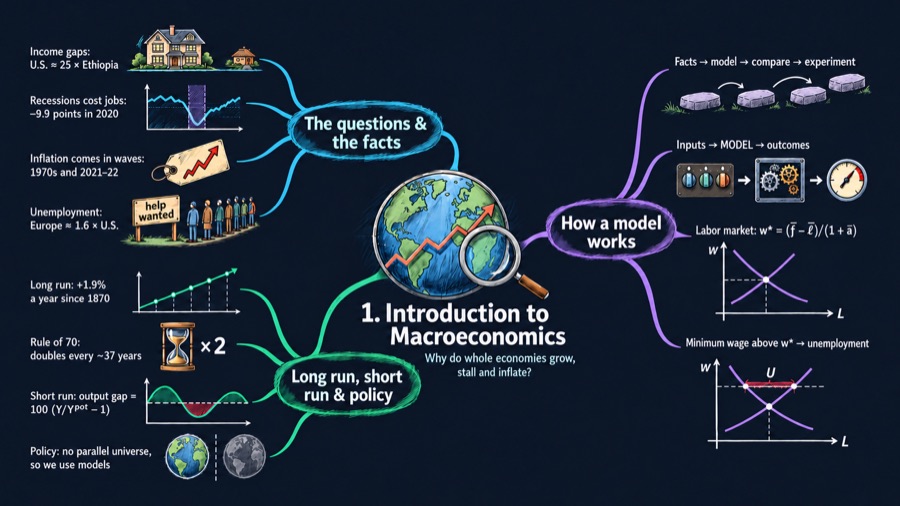
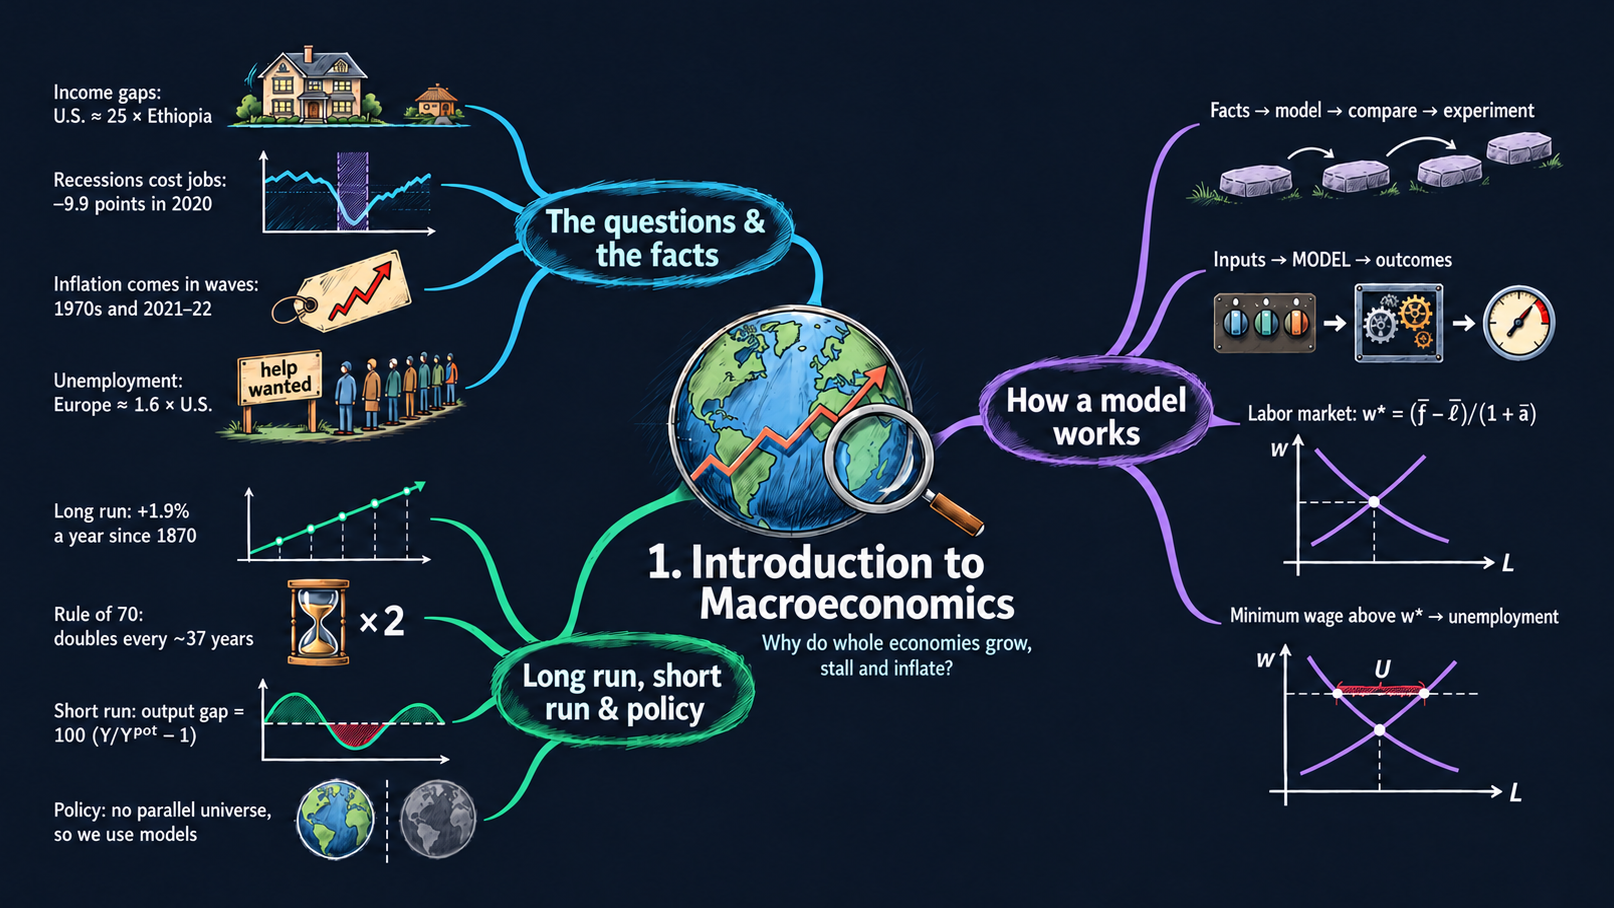
What can we learn by looking at the whole economy?
Start with income, jobs, and prices. Discover how economists move from facts to models, then use those models to ask new questions.
 Explore the chapter map ↗
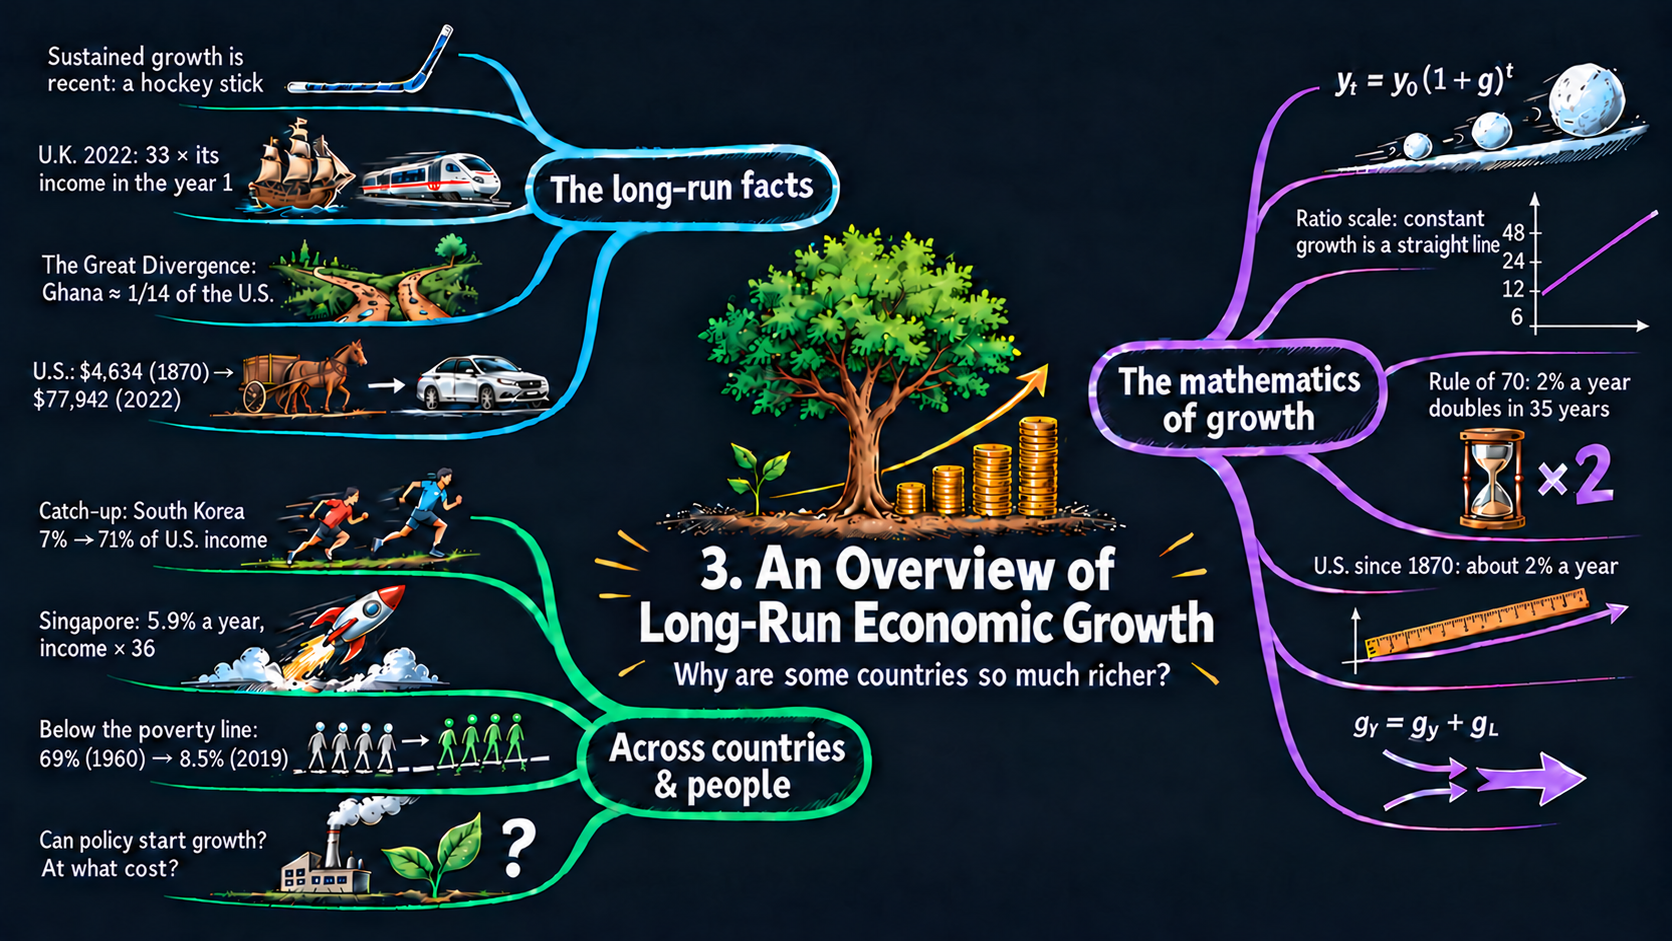
How did the world become so much richer?
Trace living standards across countries and centuries. Explore the power of compounding and the striking differences in when sustained growth began.
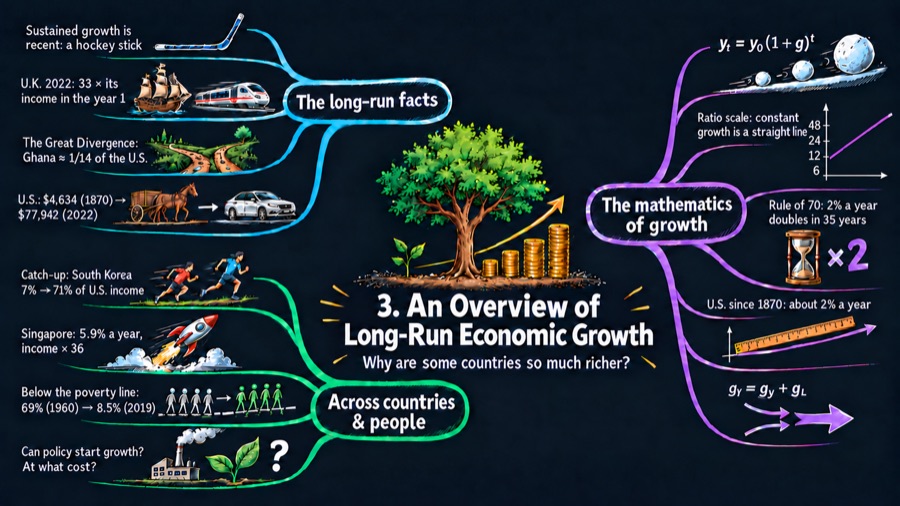 Explore the chapter map ↗
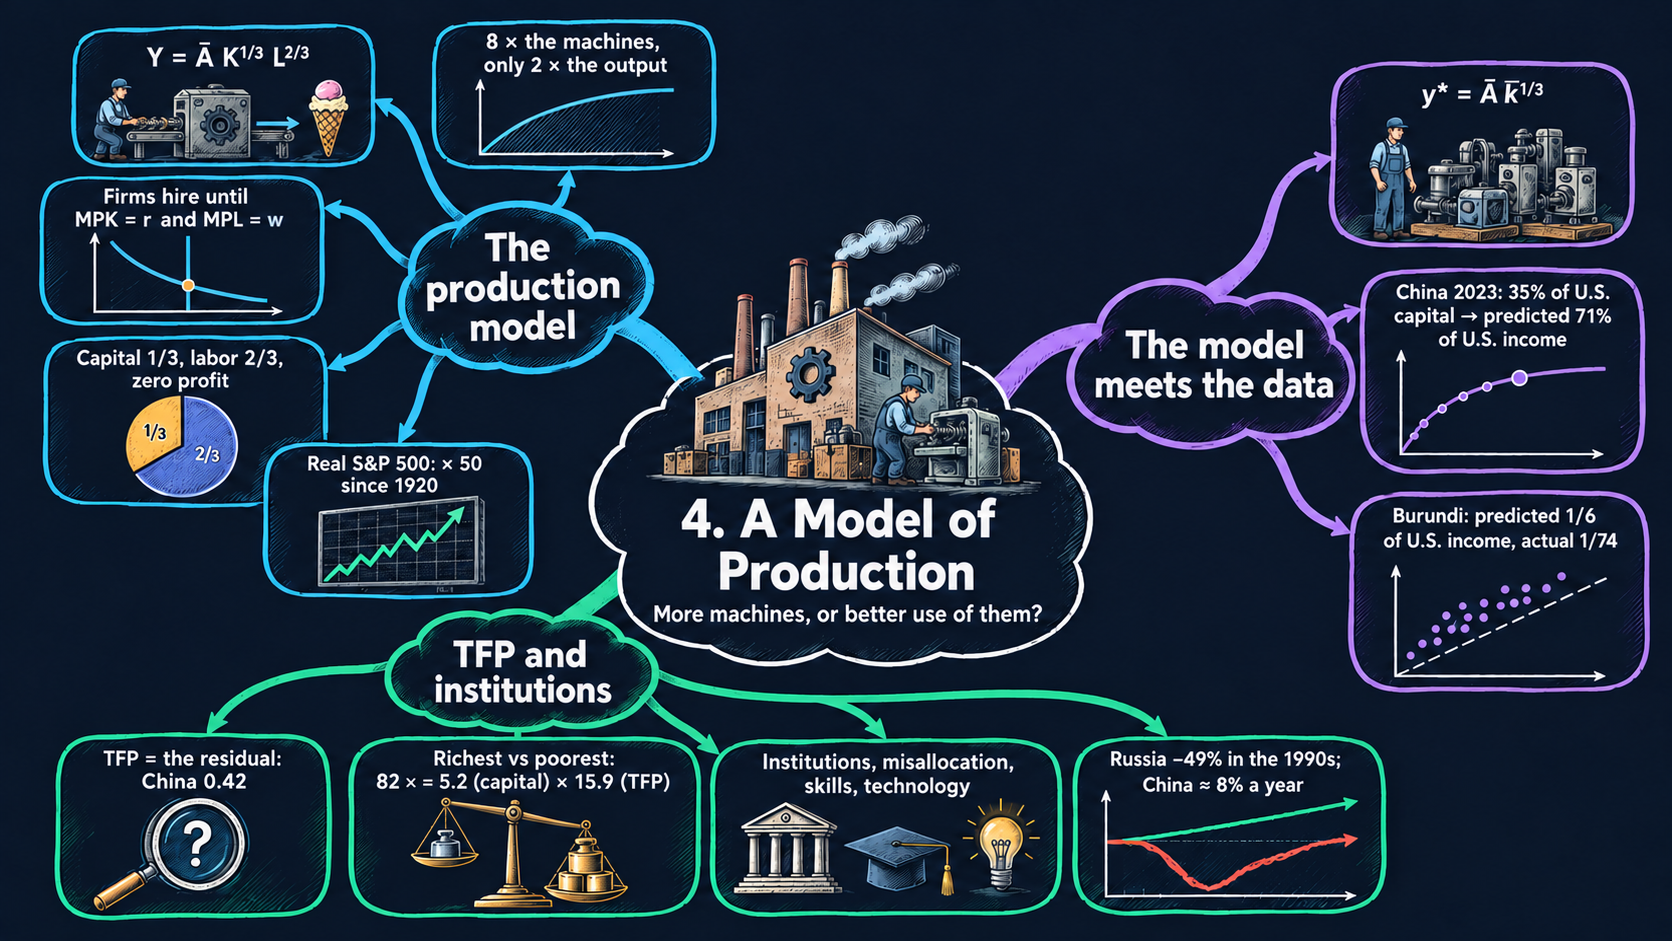
Why do some economies produce so much more?
Build a production model from capital, labor, and productivity. Compare its predictions with the data to see how much of the income gap it can explain.
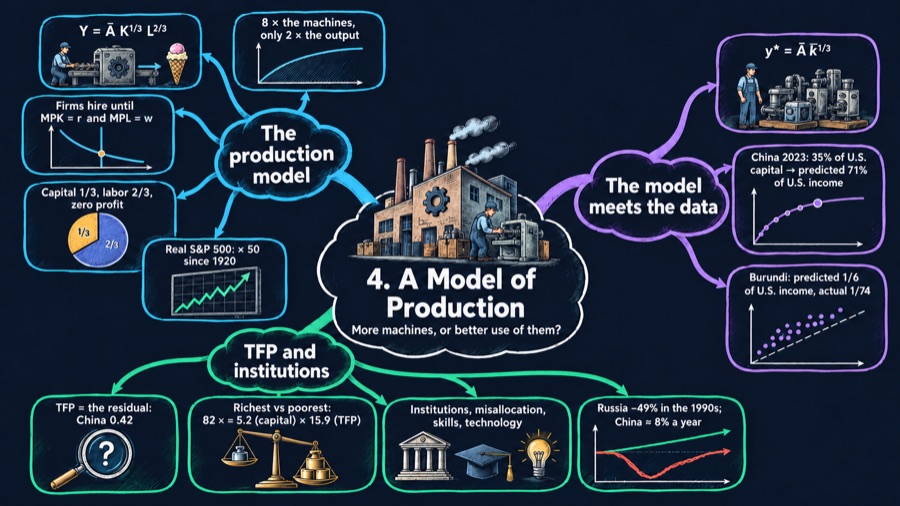 Explore the chapter map ↗
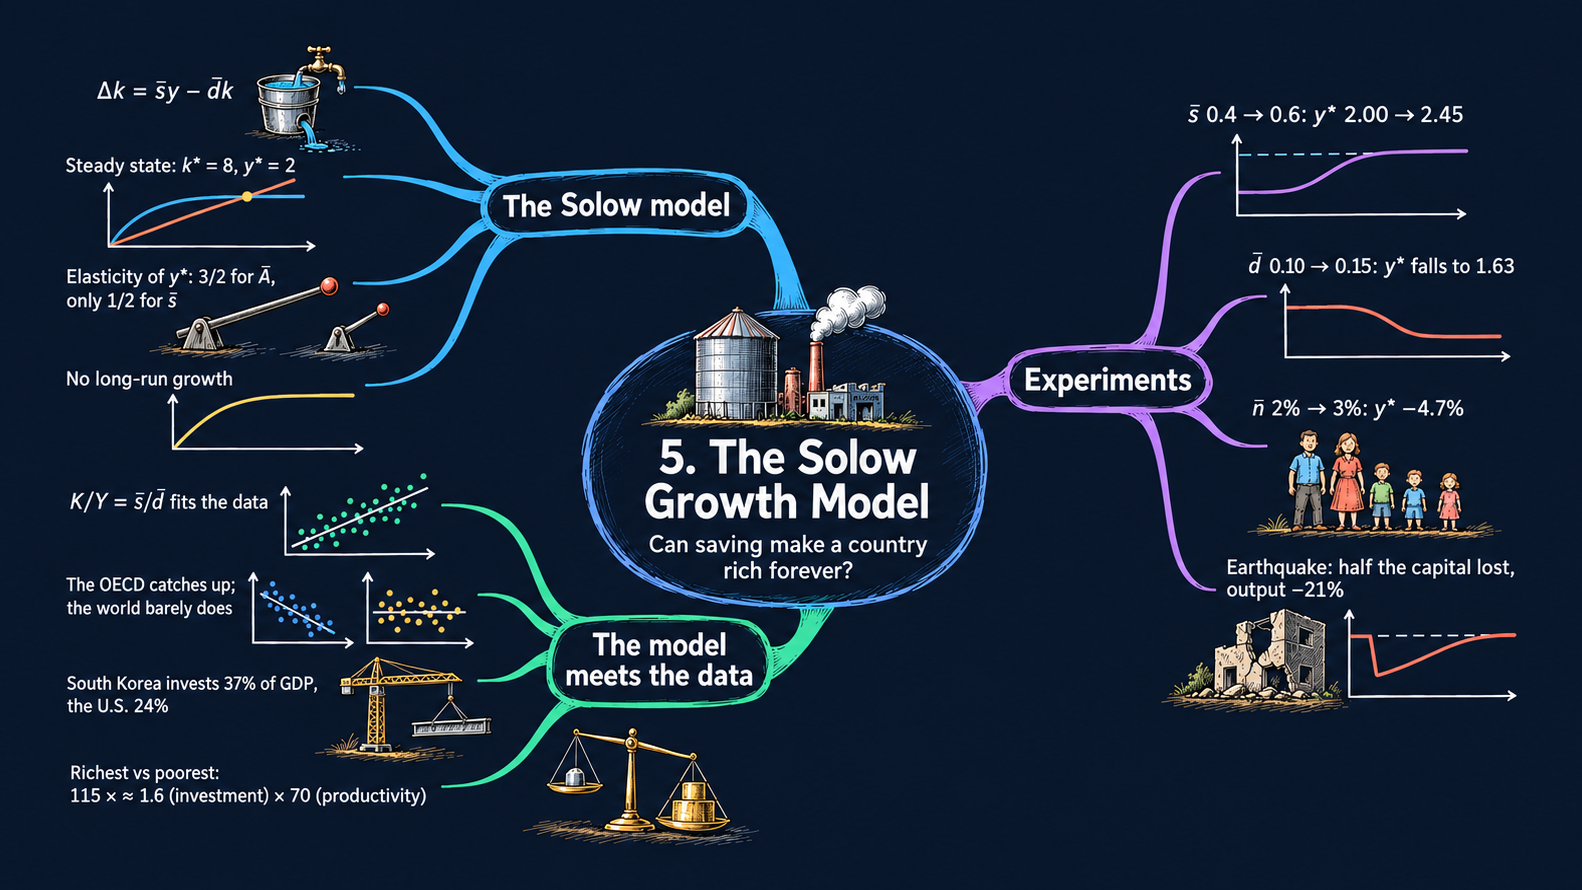
Can saving more make a country richer?
Operate the Solow model and watch capital accumulate. Explore steady states, transition dynamics, and the limits of growth driven by investment alone.
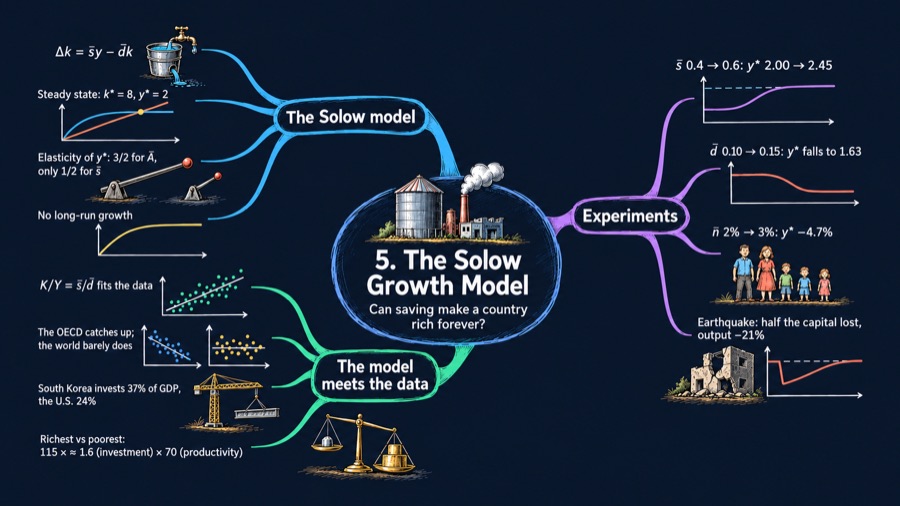 Explore the chapter map ↗
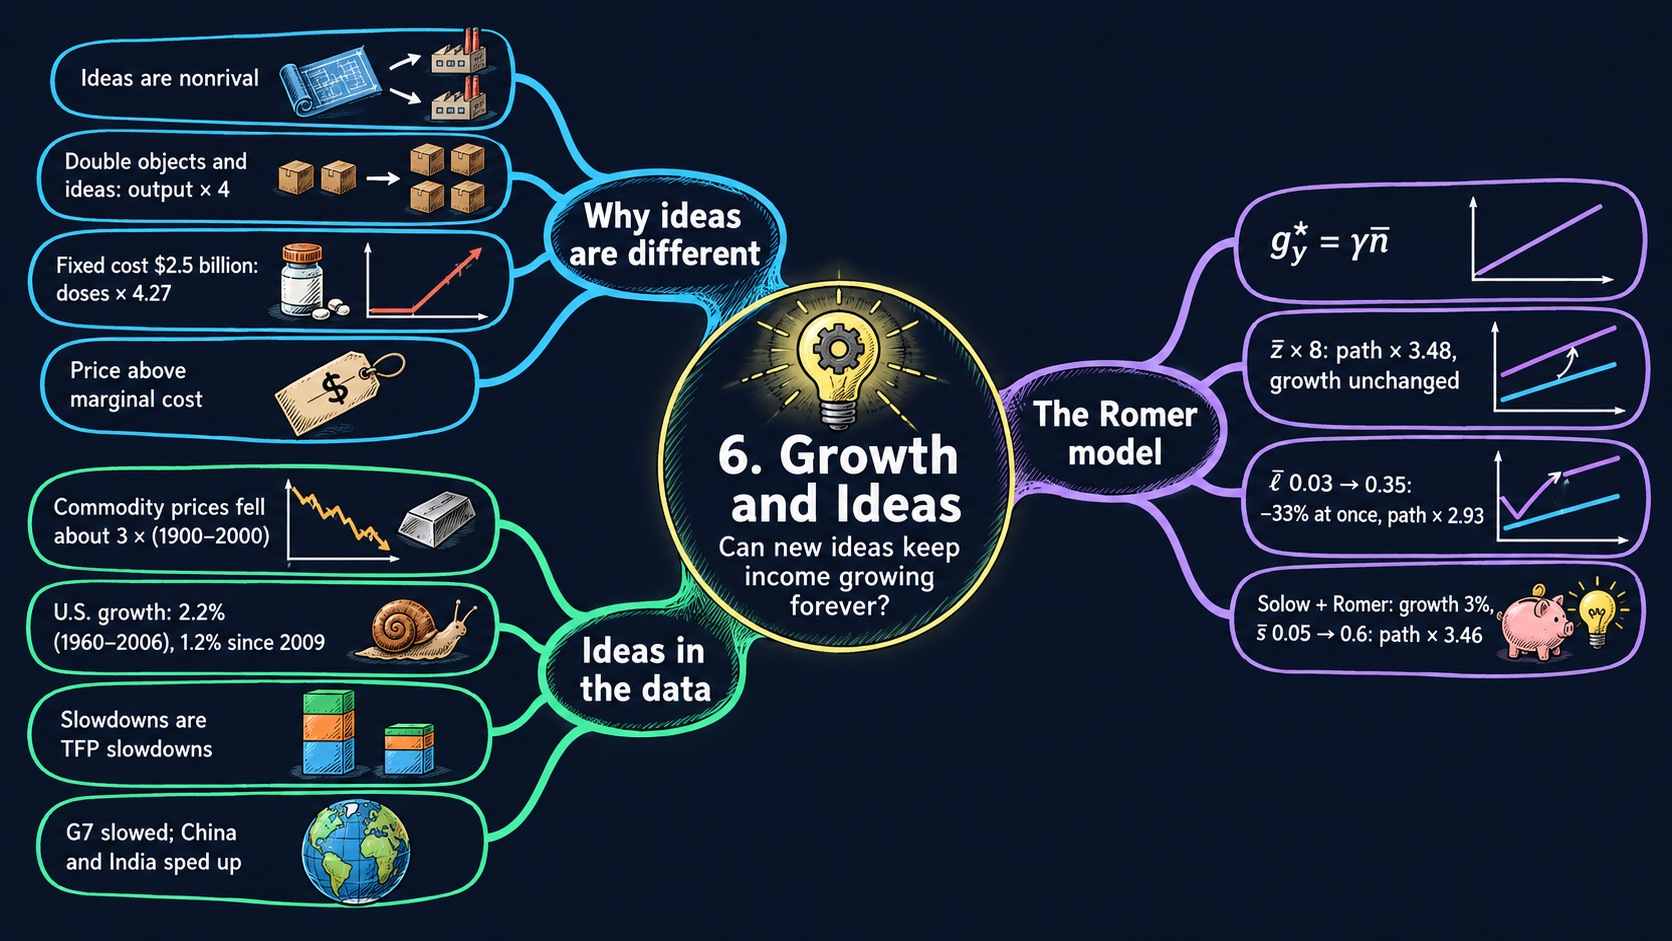
What keeps economic growth going?
Ideas can be used by many people at once. Explore how this changes the economics of production and why research can sustain rising living standards.
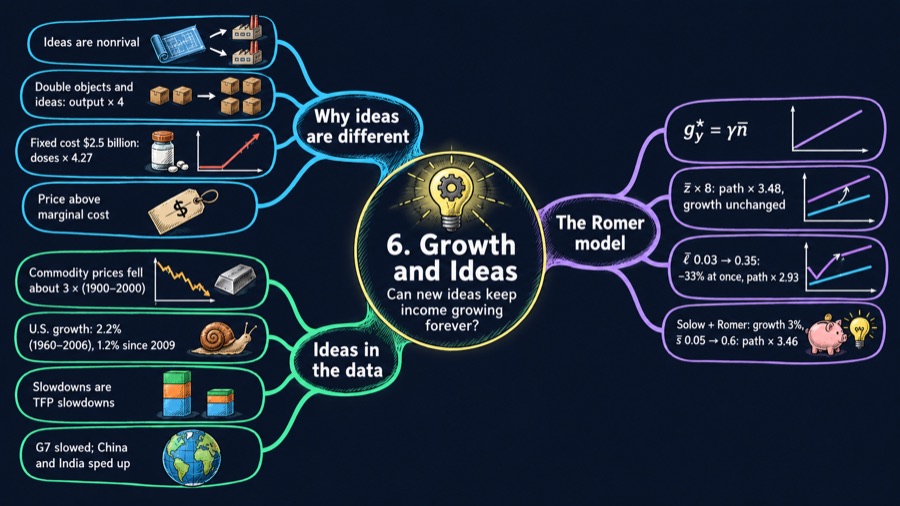 Explore the chapter map ↗
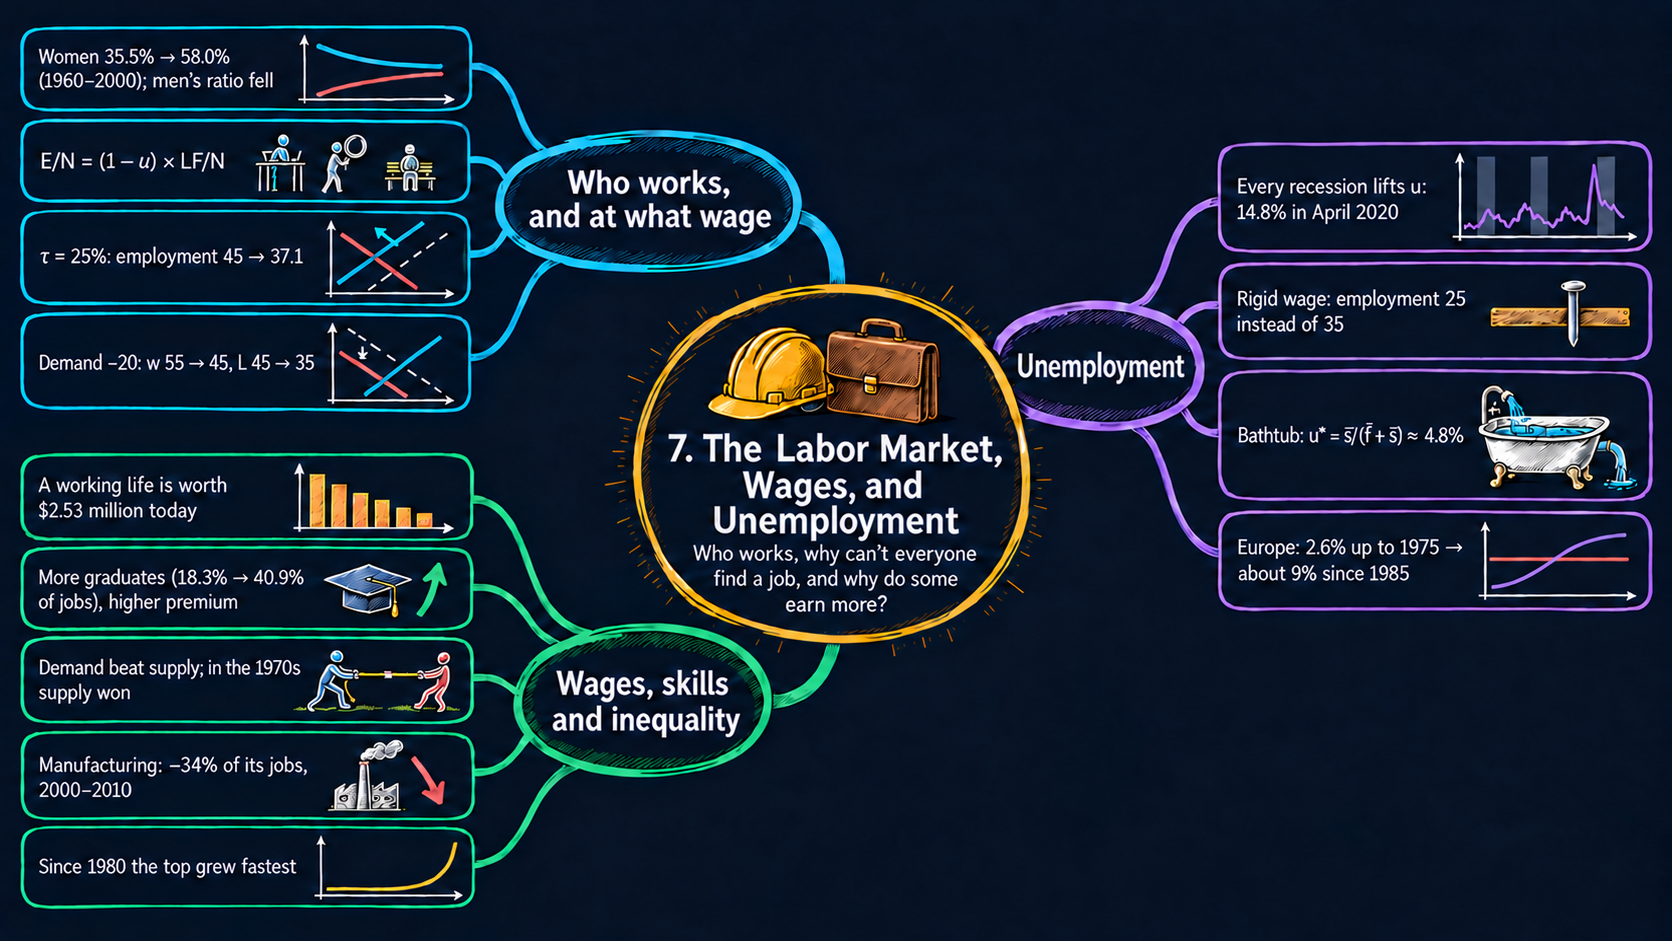
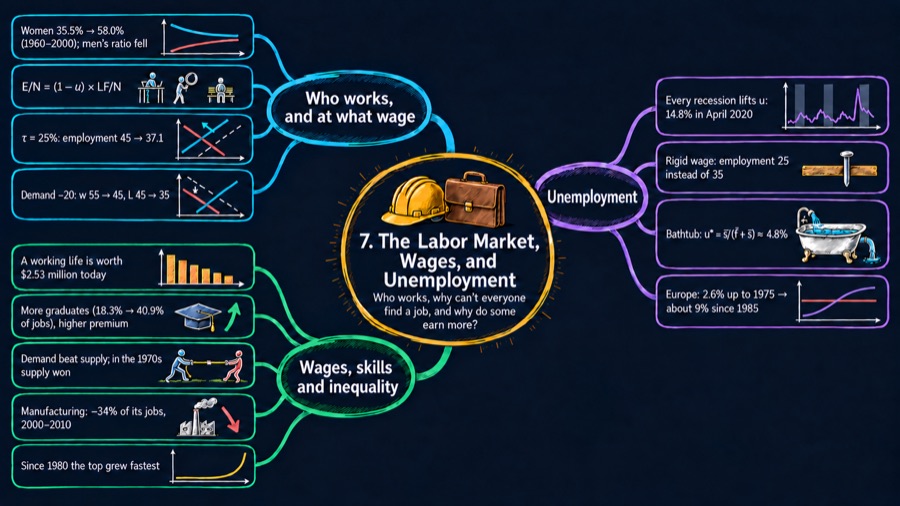
Why are some people unemployed even when jobs exist?
Connect wages and employment to labor supply and demand. Then follow workers into and out of jobs to understand persistent unemployment.
 Explore the chapter map ↗
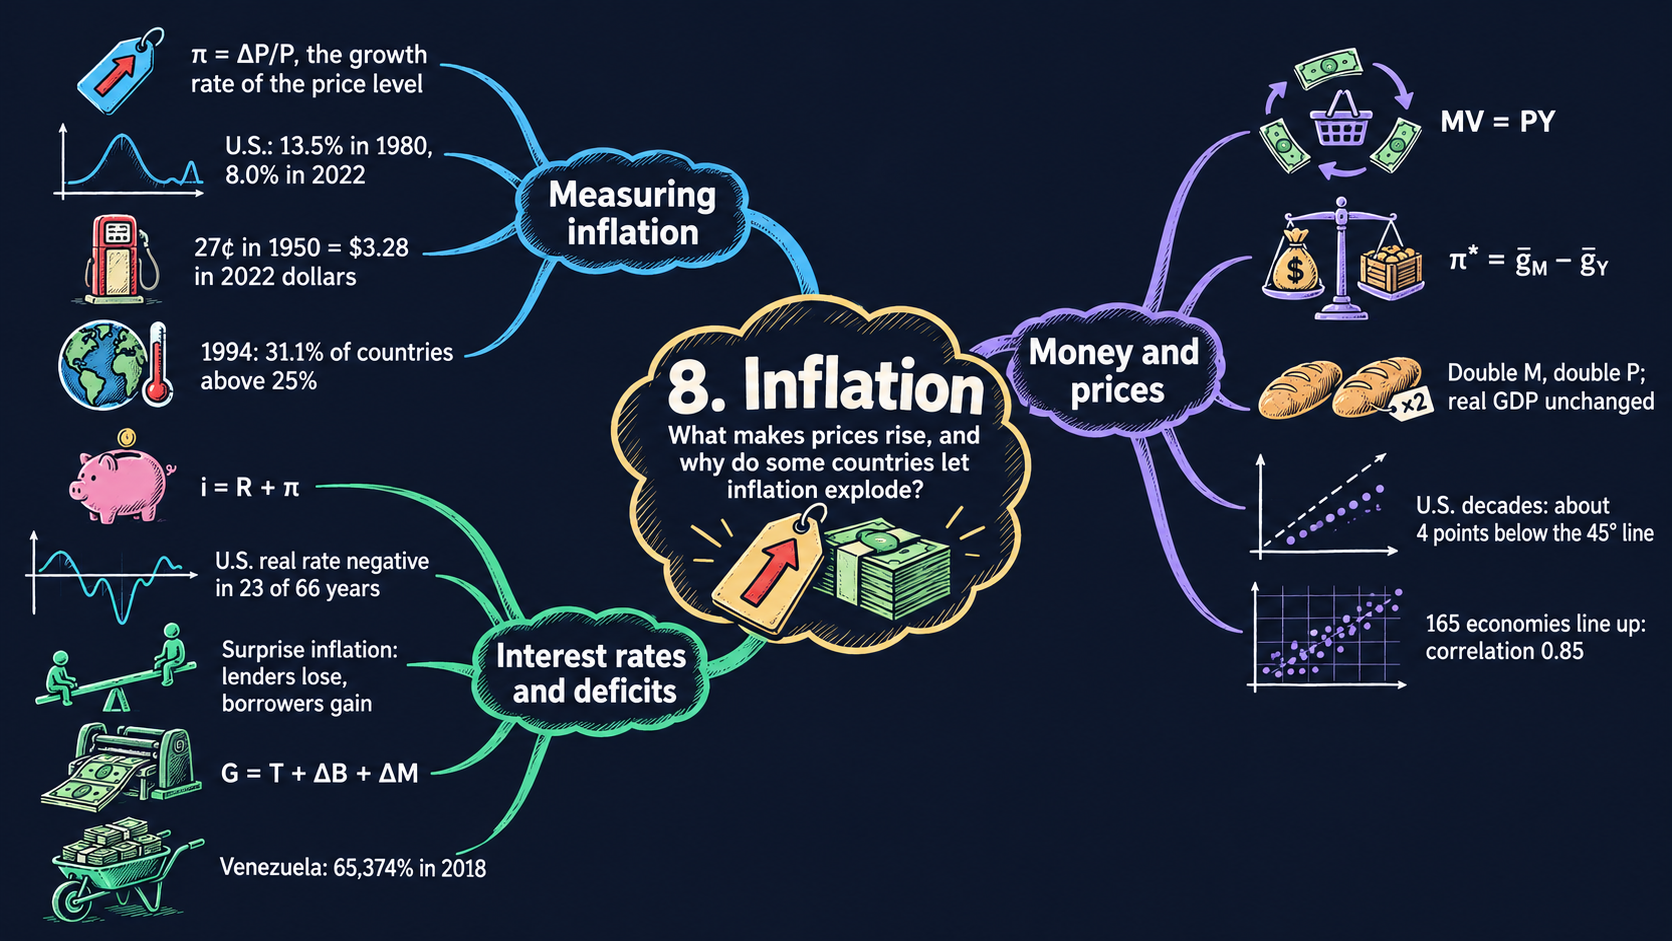
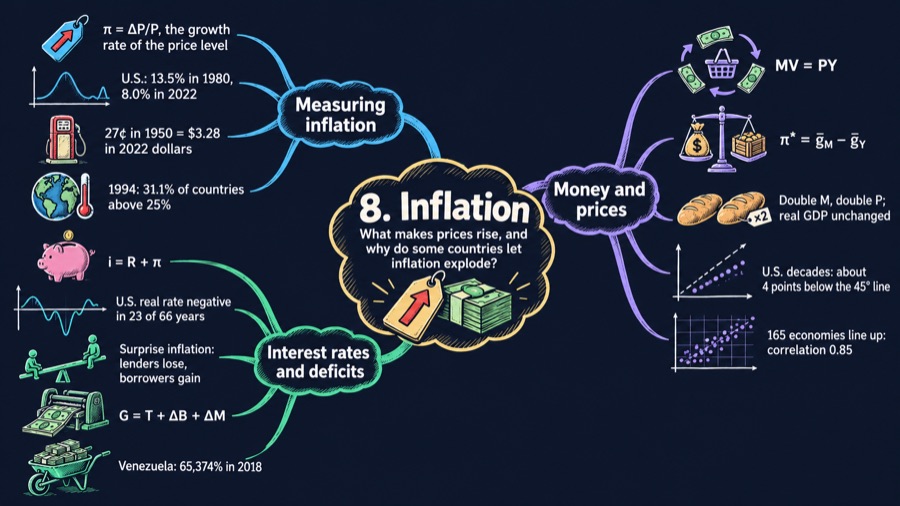
Why does money lose its purchasing power?
Measure inflation in the data and connect prices to money and output. Explore the quantity theory, real interest rates, and the costs of inflation.
 Explore the chapter map ↗
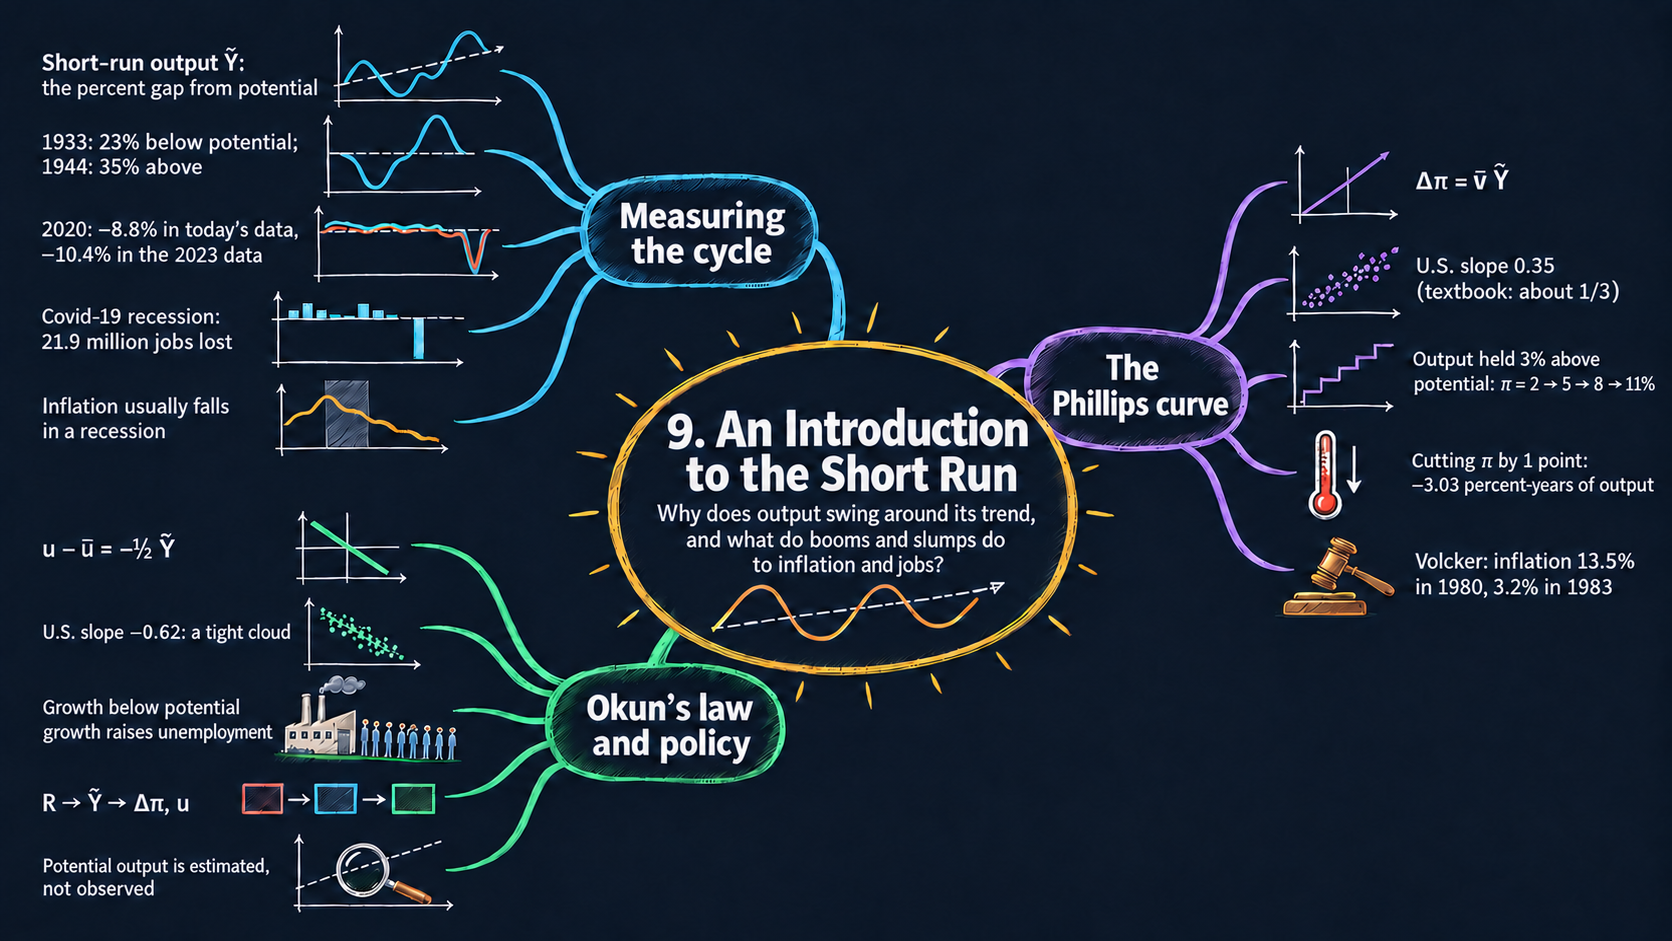
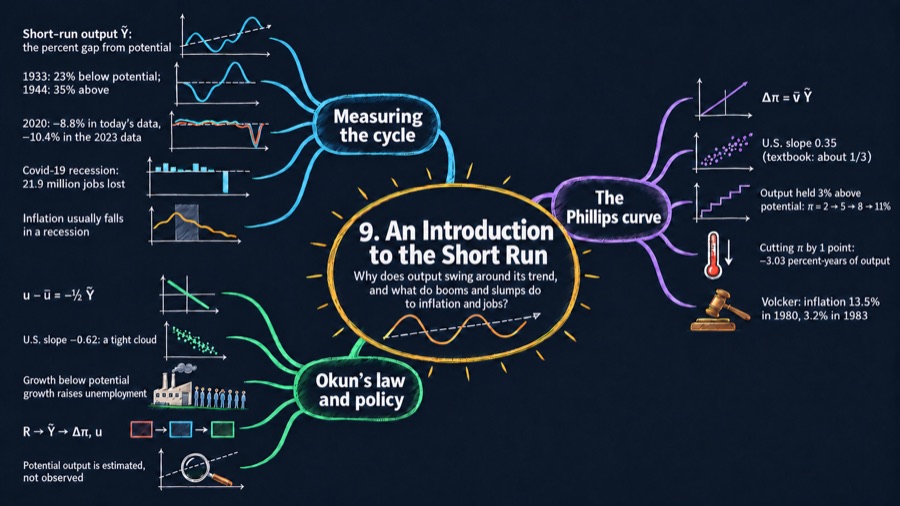
Why does the economy move in ups and downs?
Separate the long-run path of output from short-run fluctuations. Use data on output, jobs, and inflation to describe what happens in a recession.
 Explore the chapter map ↗
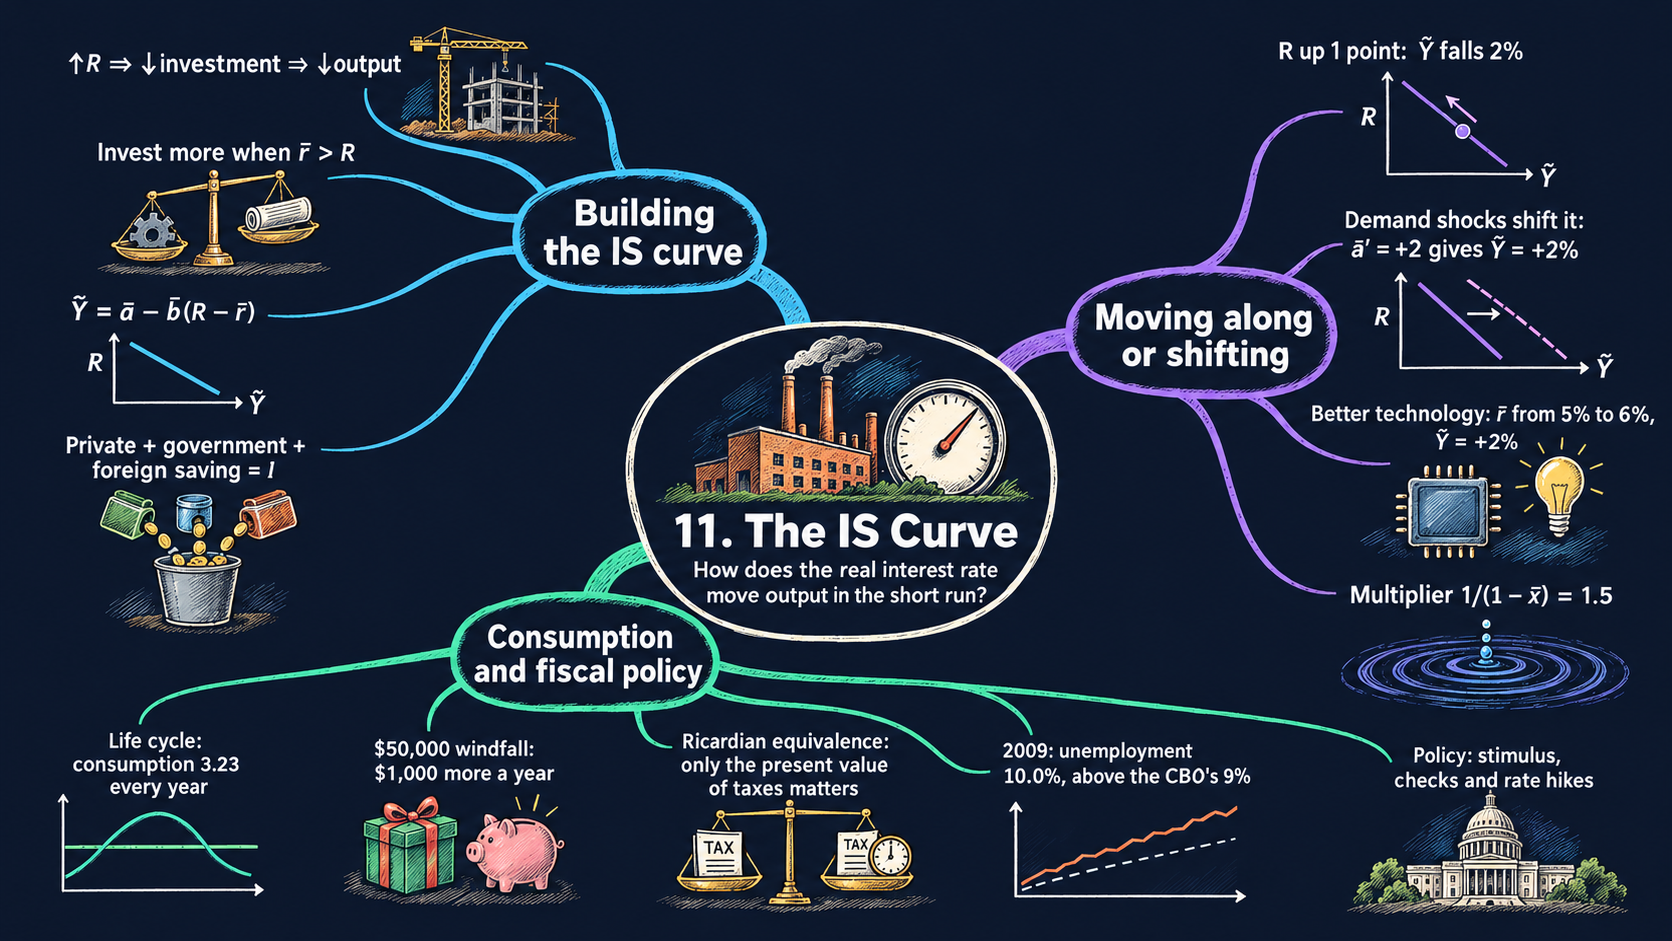
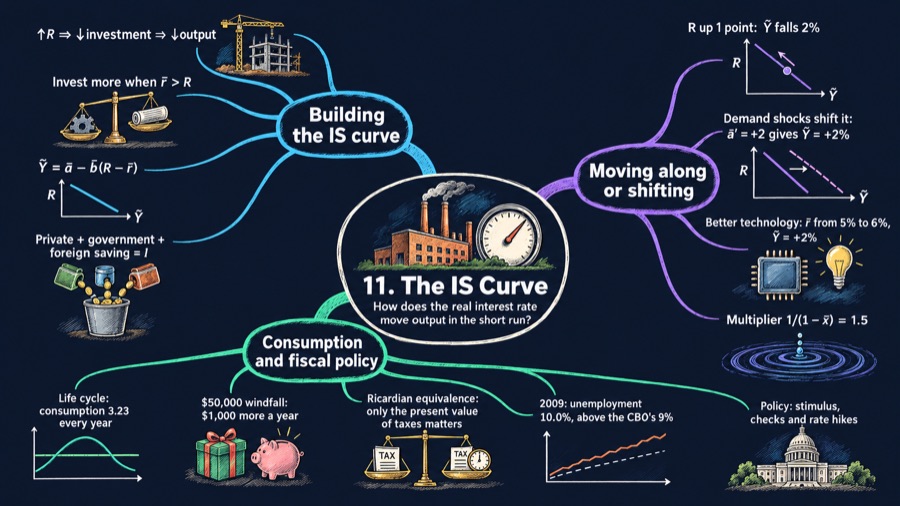
How do interest rates change spending and output?
Build the IS curve from the national income identity. Change demand and borrowing costs to see why short-run output moves.
 Explore the chapter map ↗
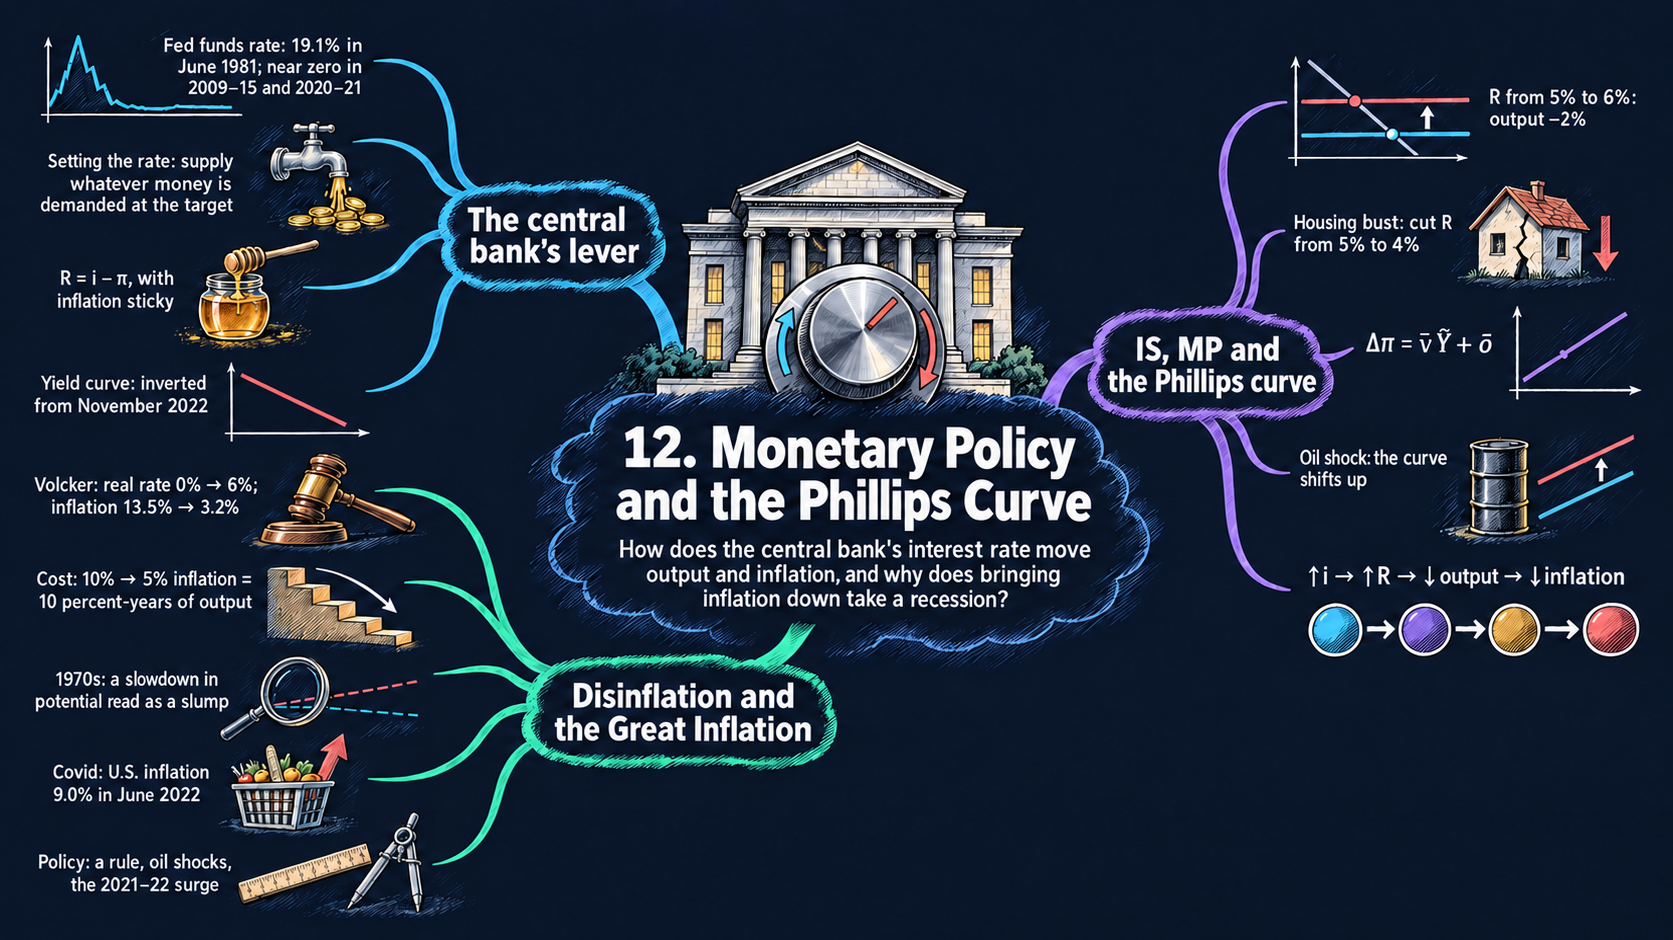
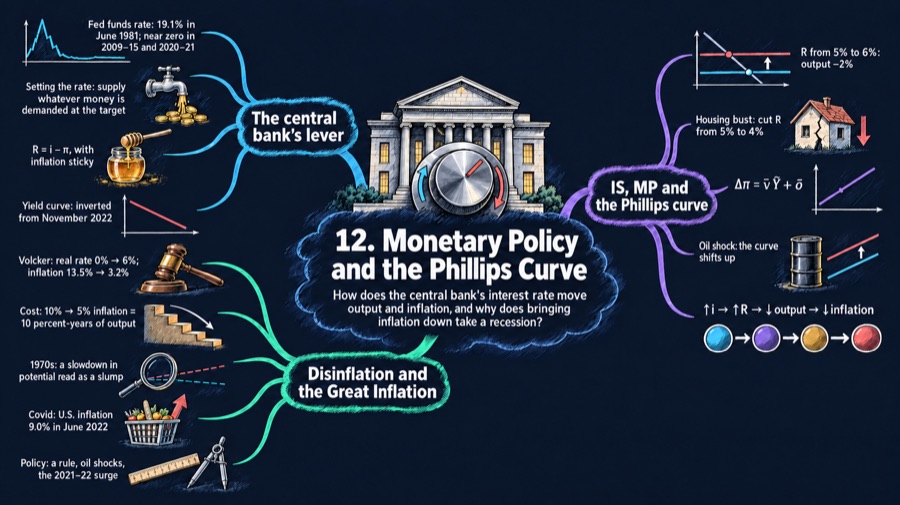
How can a central bank bring inflation down?
Connect monetary policy to the IS and Phillips curves. Follow the path of output and inflation when the central bank changes the interest rate.
 Explore the chapter map ↗
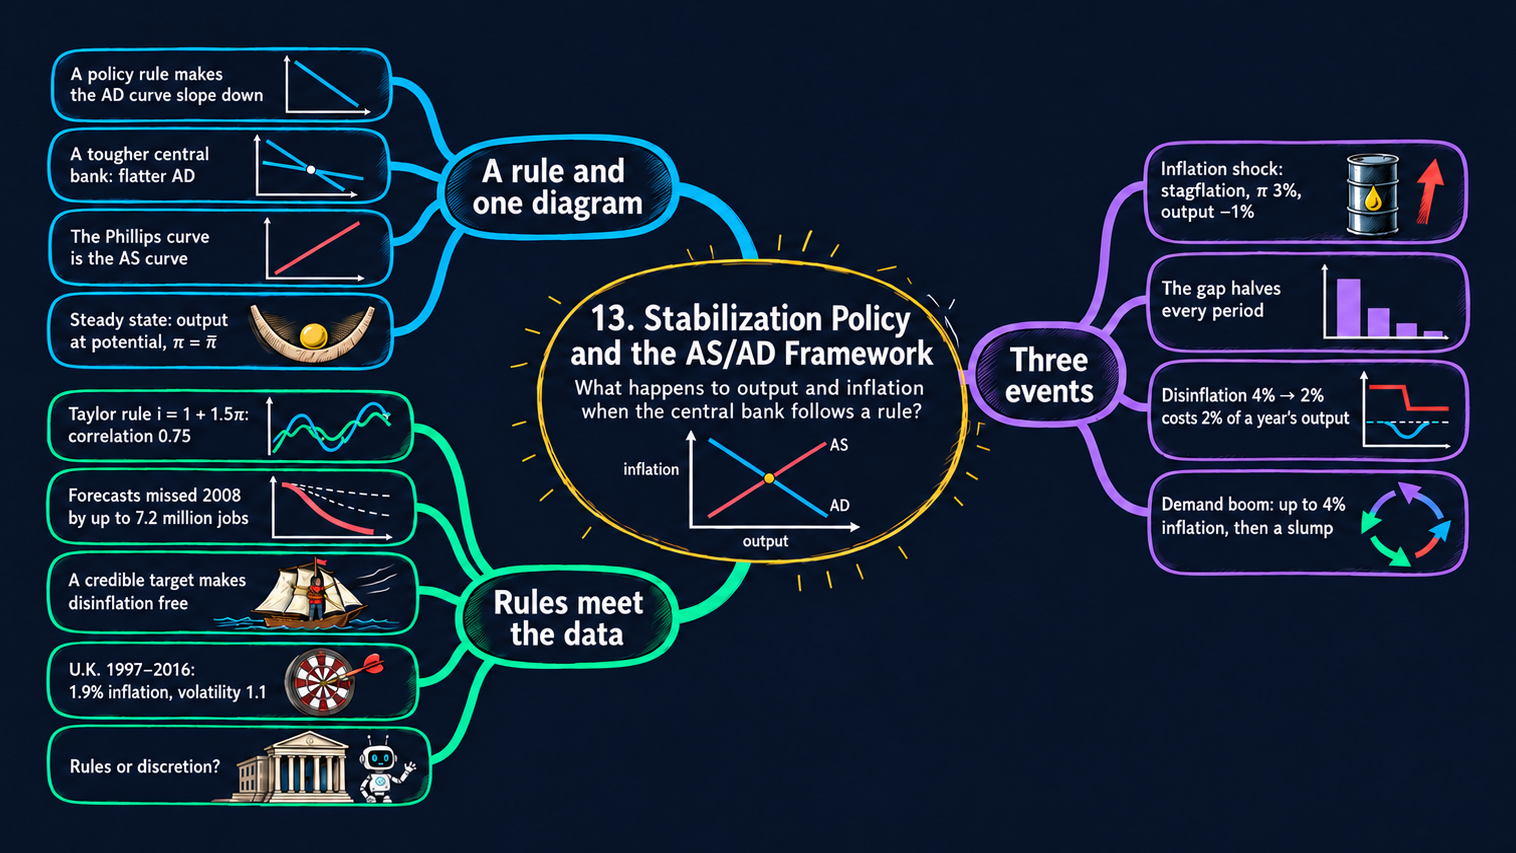
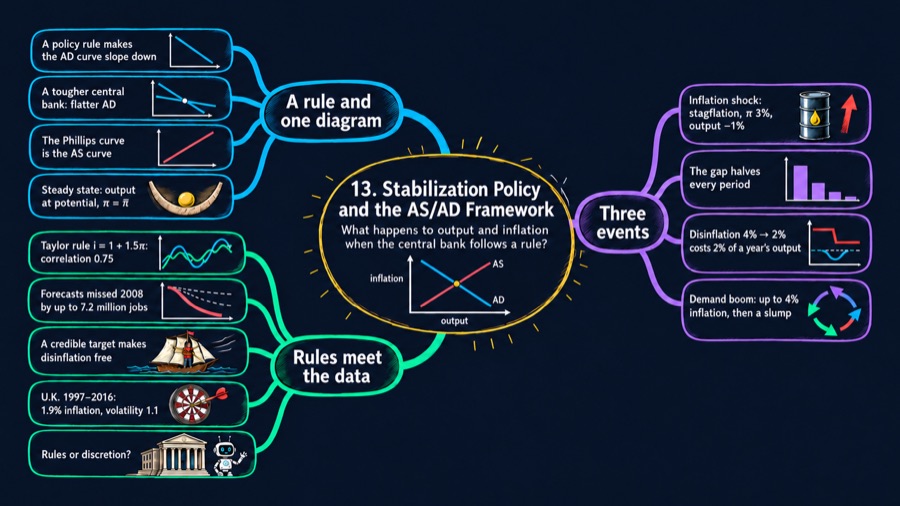
Can policy cushion an economic shock?
Bring the short-run model together in the AS/AD diagram. Explore how policy rules, expectations, and different shocks shape the adjustment.
 Explore the chapter map ↗
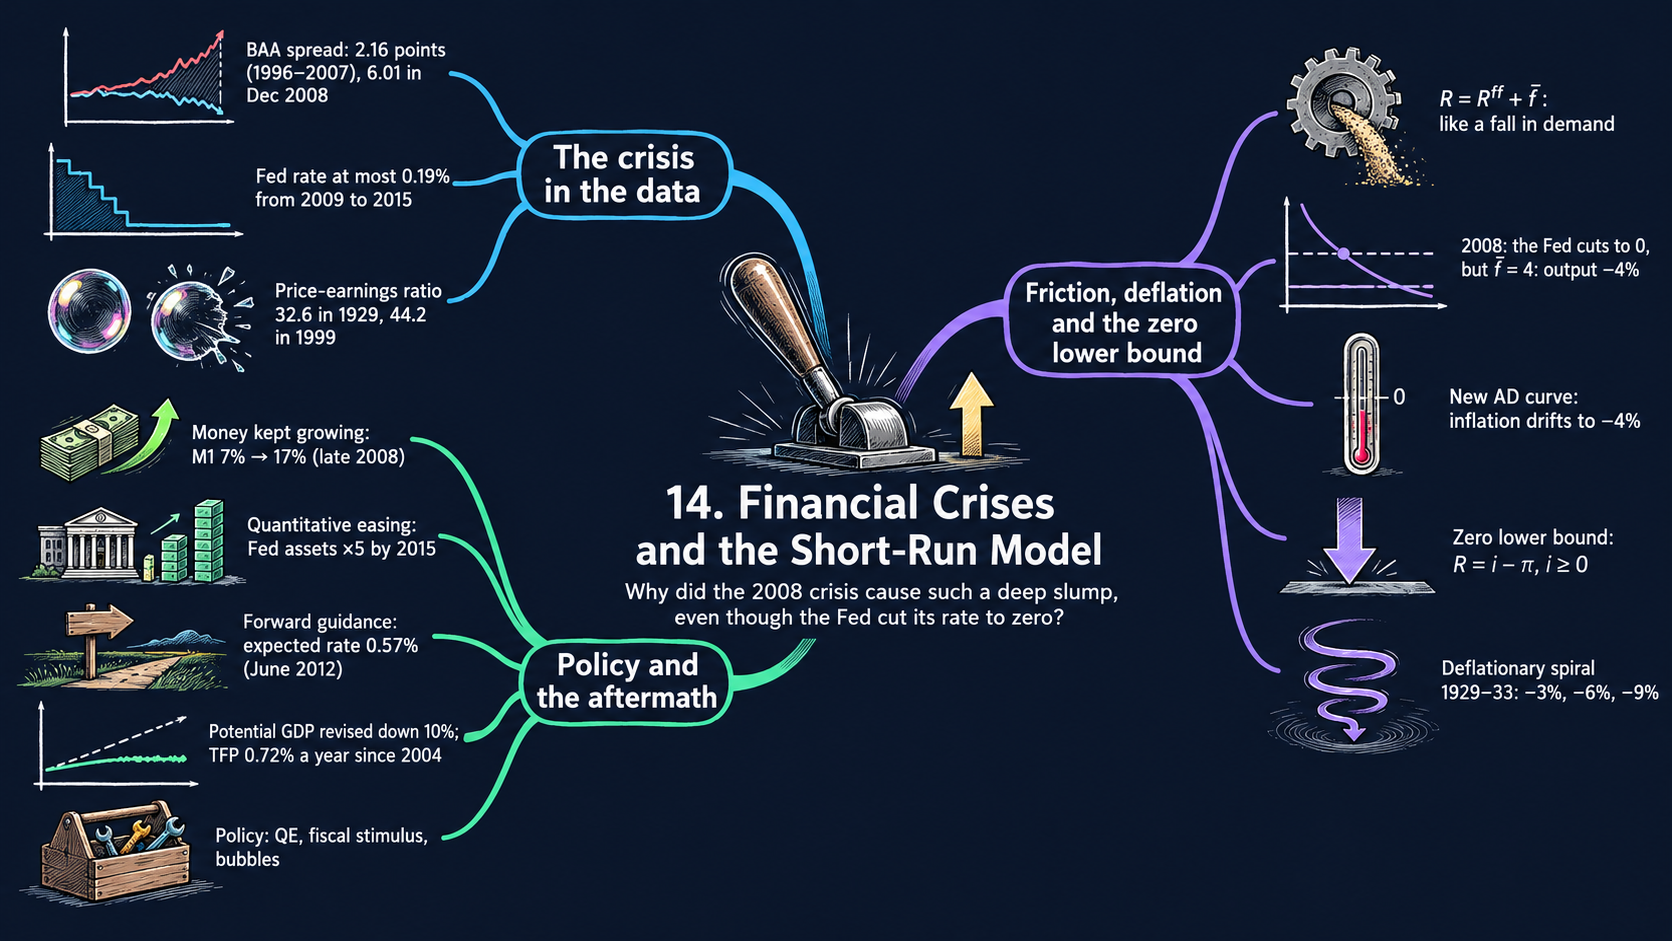
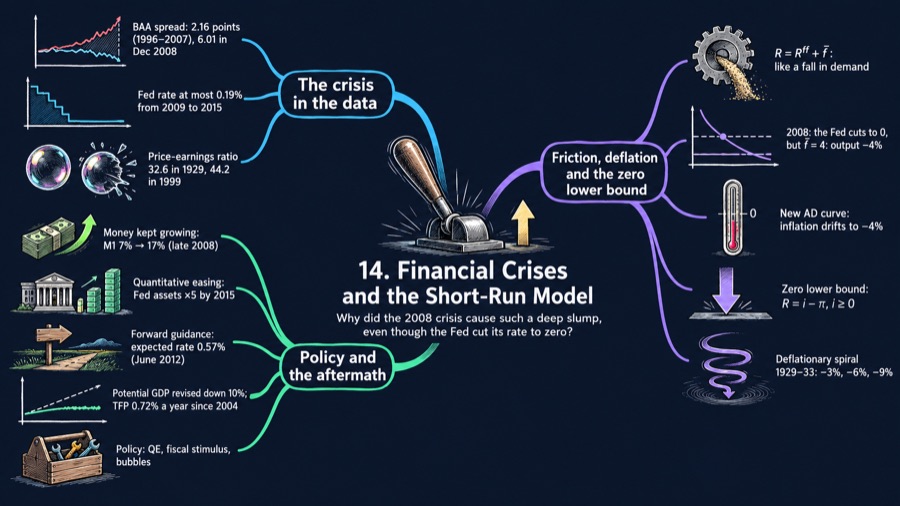
What happens when the financial system stops working?
Add risk premiums and financial frictions to the short-run model. Examine how a credit crisis, deflation, and policy constraints can deepen a recession.
 Explore the chapter map ↗
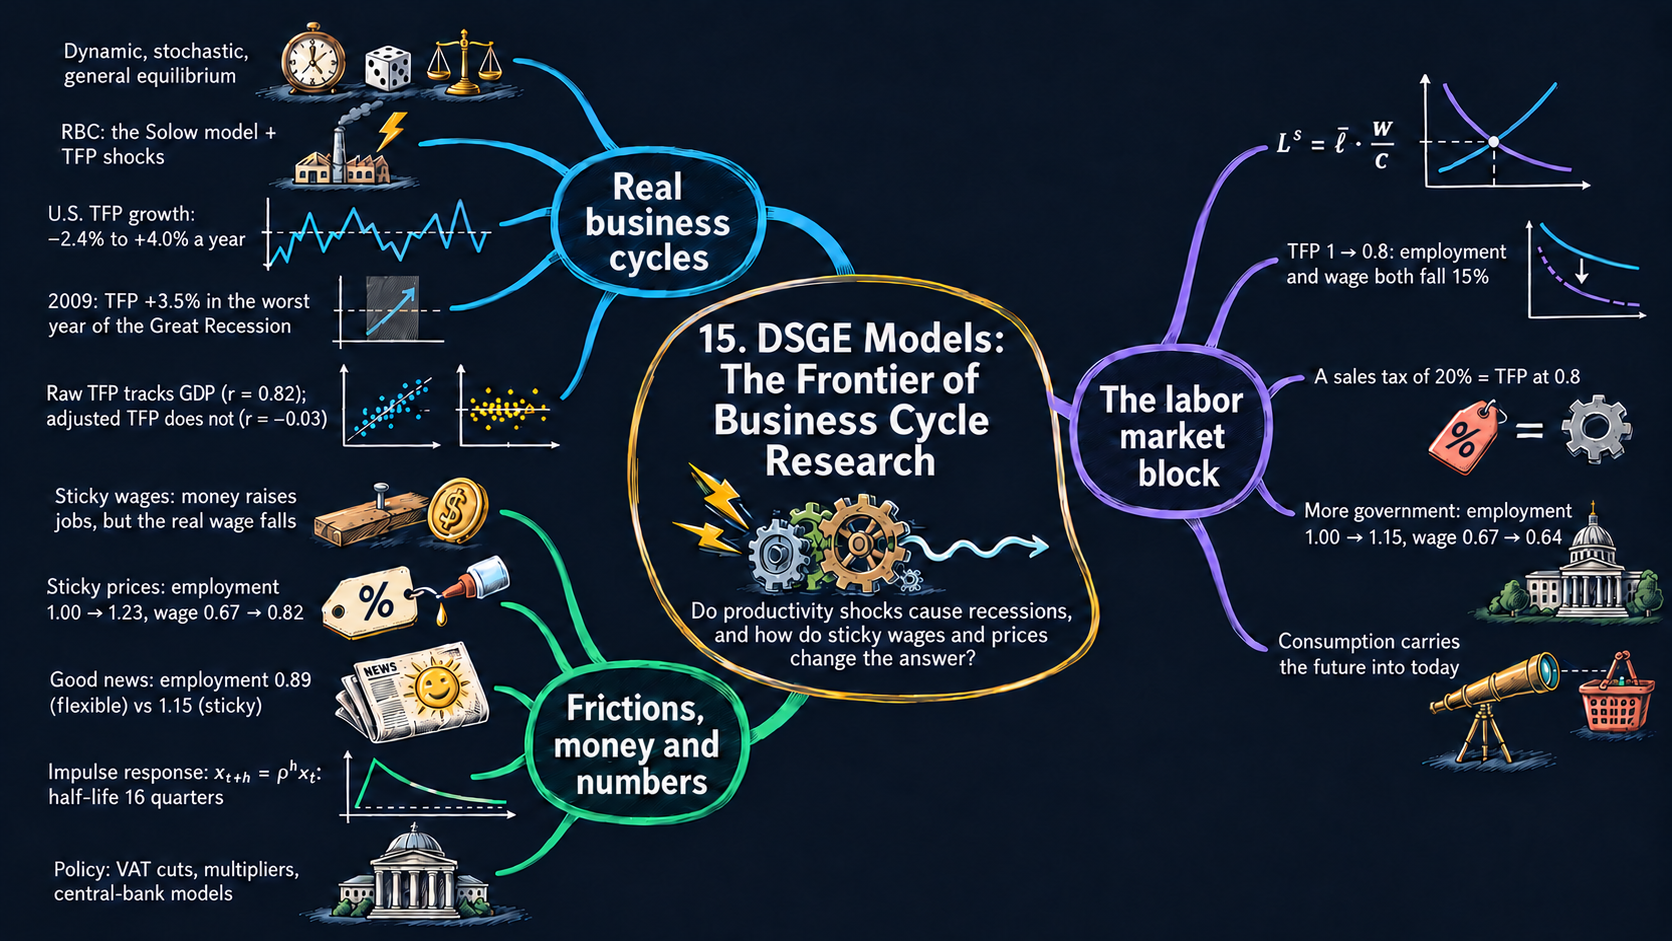
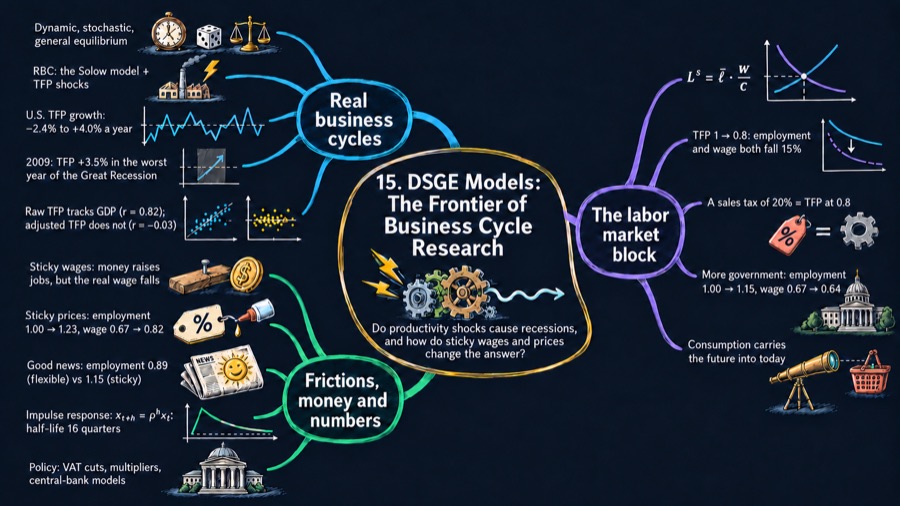
How do modern models explain business cycles?
Meet the agents, shocks, and frictions inside DSGE models. Explore how productivity, labor markets, and sticky prices shape the economy’s response.
 Explore the chapter map ↗
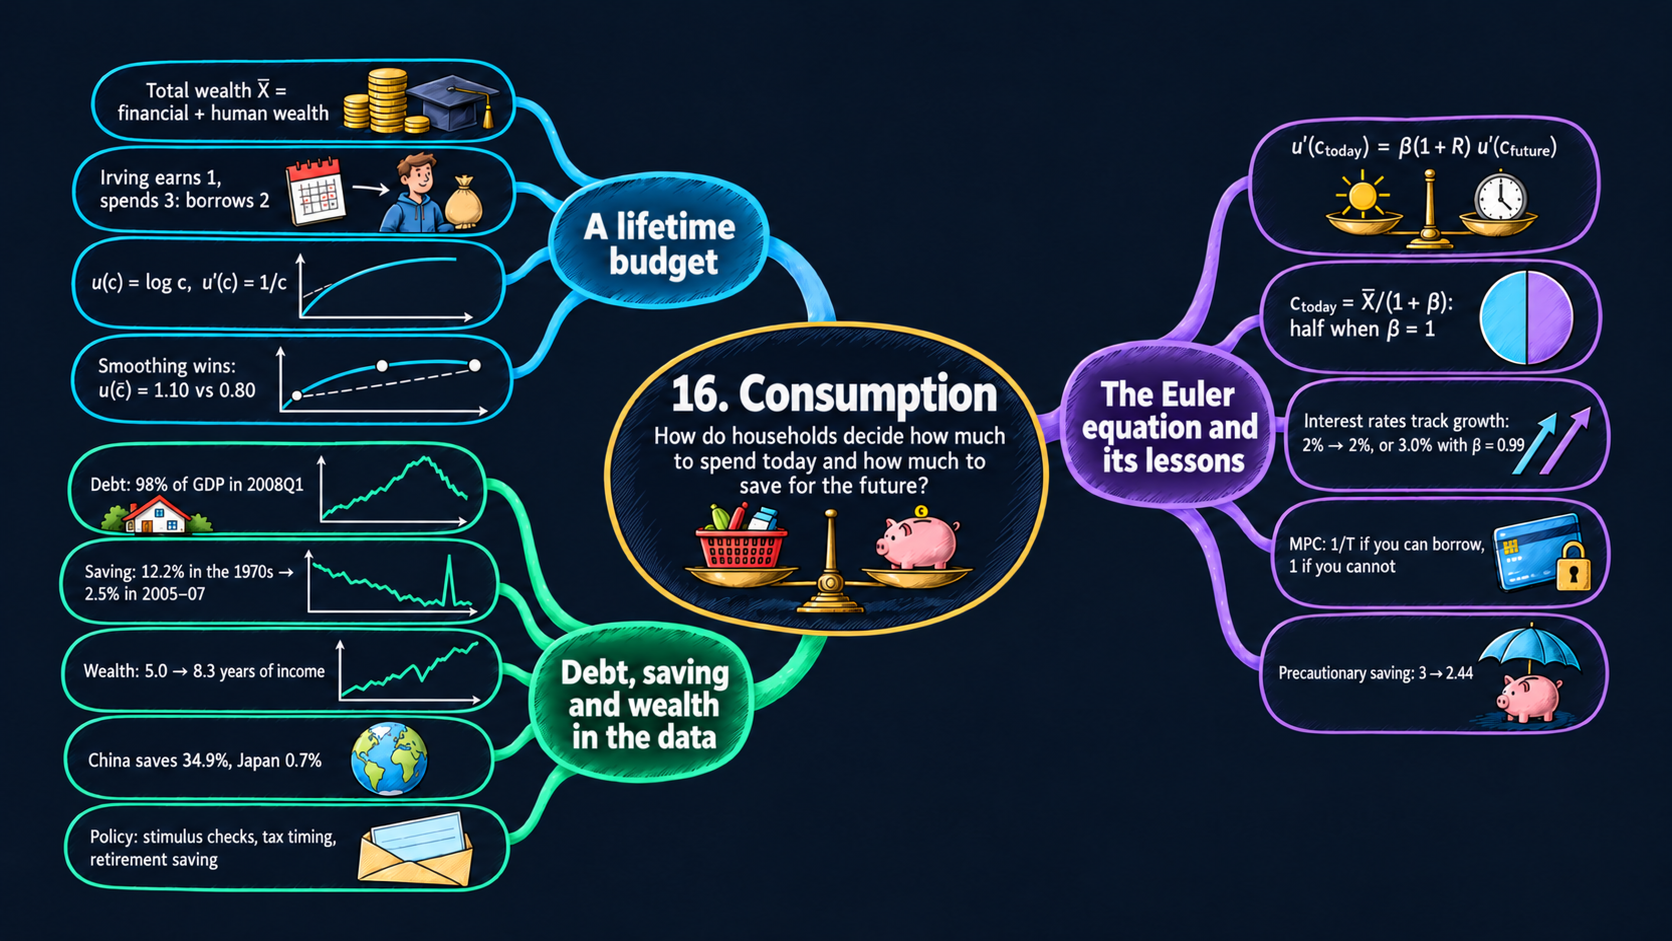
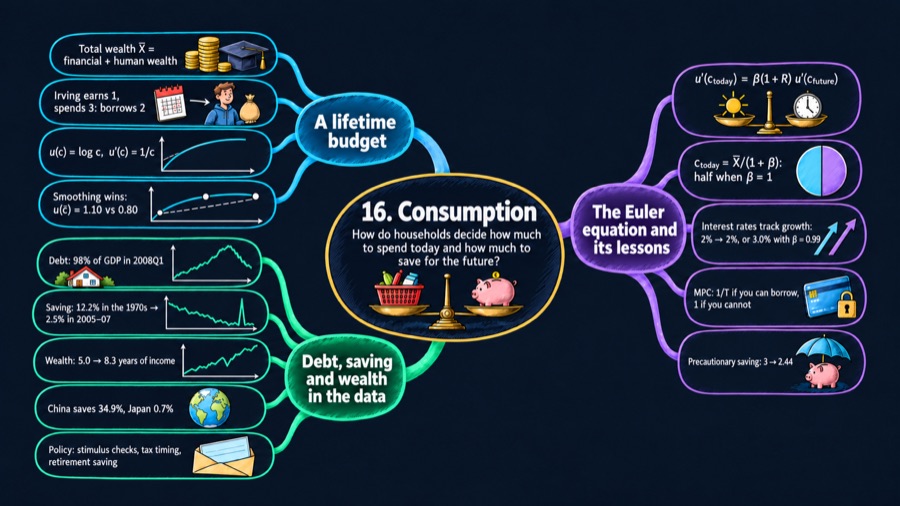
How do households decide what to spend today?
Spread income and wealth across a lifetime. Use a two-period model to explore consumption smoothing, patience, and the role of interest rates.
 Explore the chapter map ↗
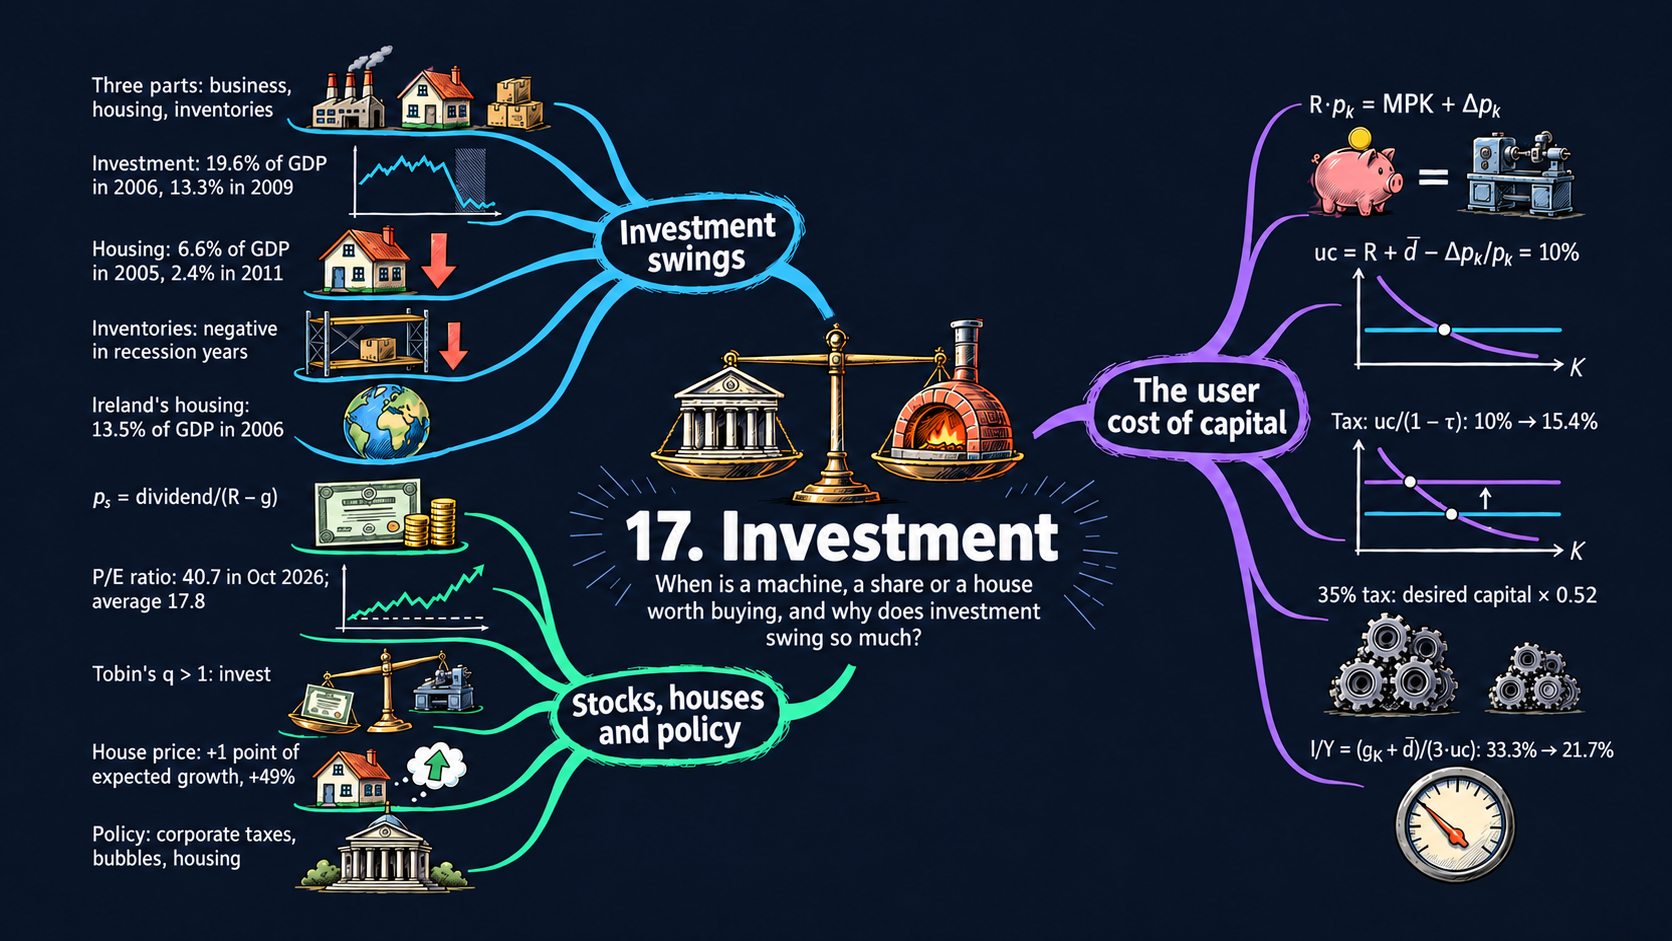
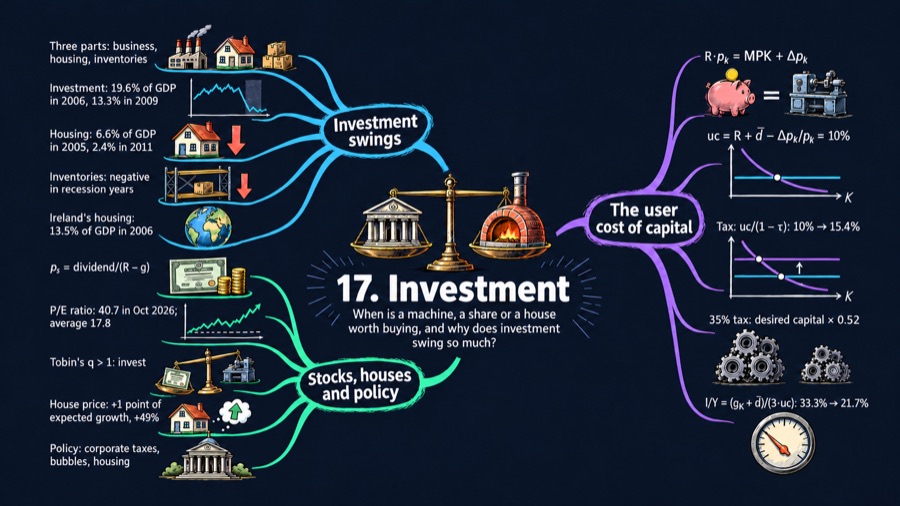
What makes a new investment worthwhile?
Compare the return on capital with its cost. Connect firms’ investment choices to interest rates, taxes, stock prices, and housing.
 Explore the chapter map ↗
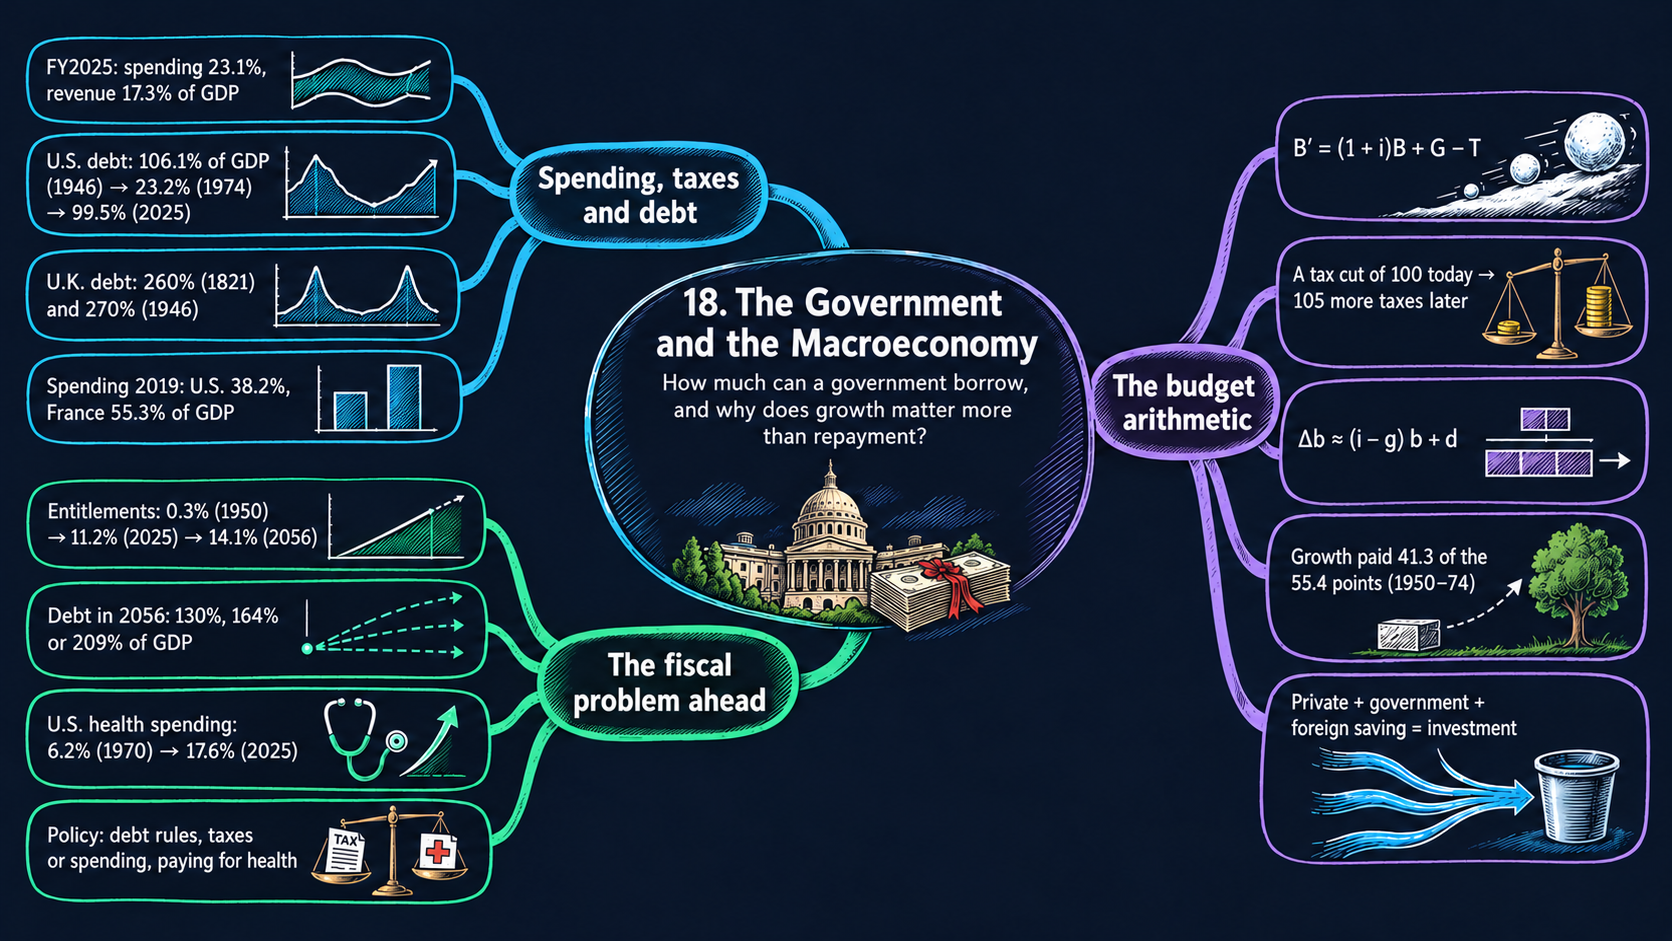
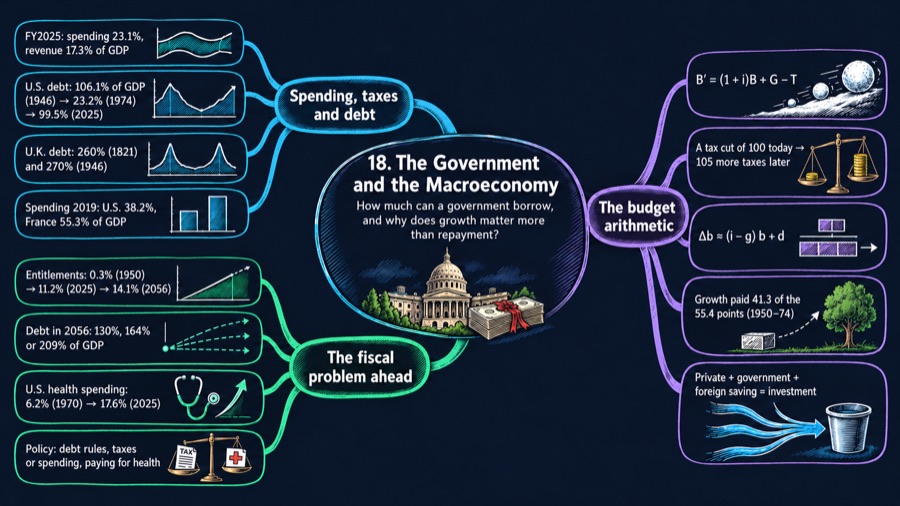
How do today’s deficits shape tomorrow’s choices?
Follow government spending, taxes, and borrowing through the budget constraint. Explore debt dynamics and the choices involved in financing public spending.
 Explore the chapter map ↗
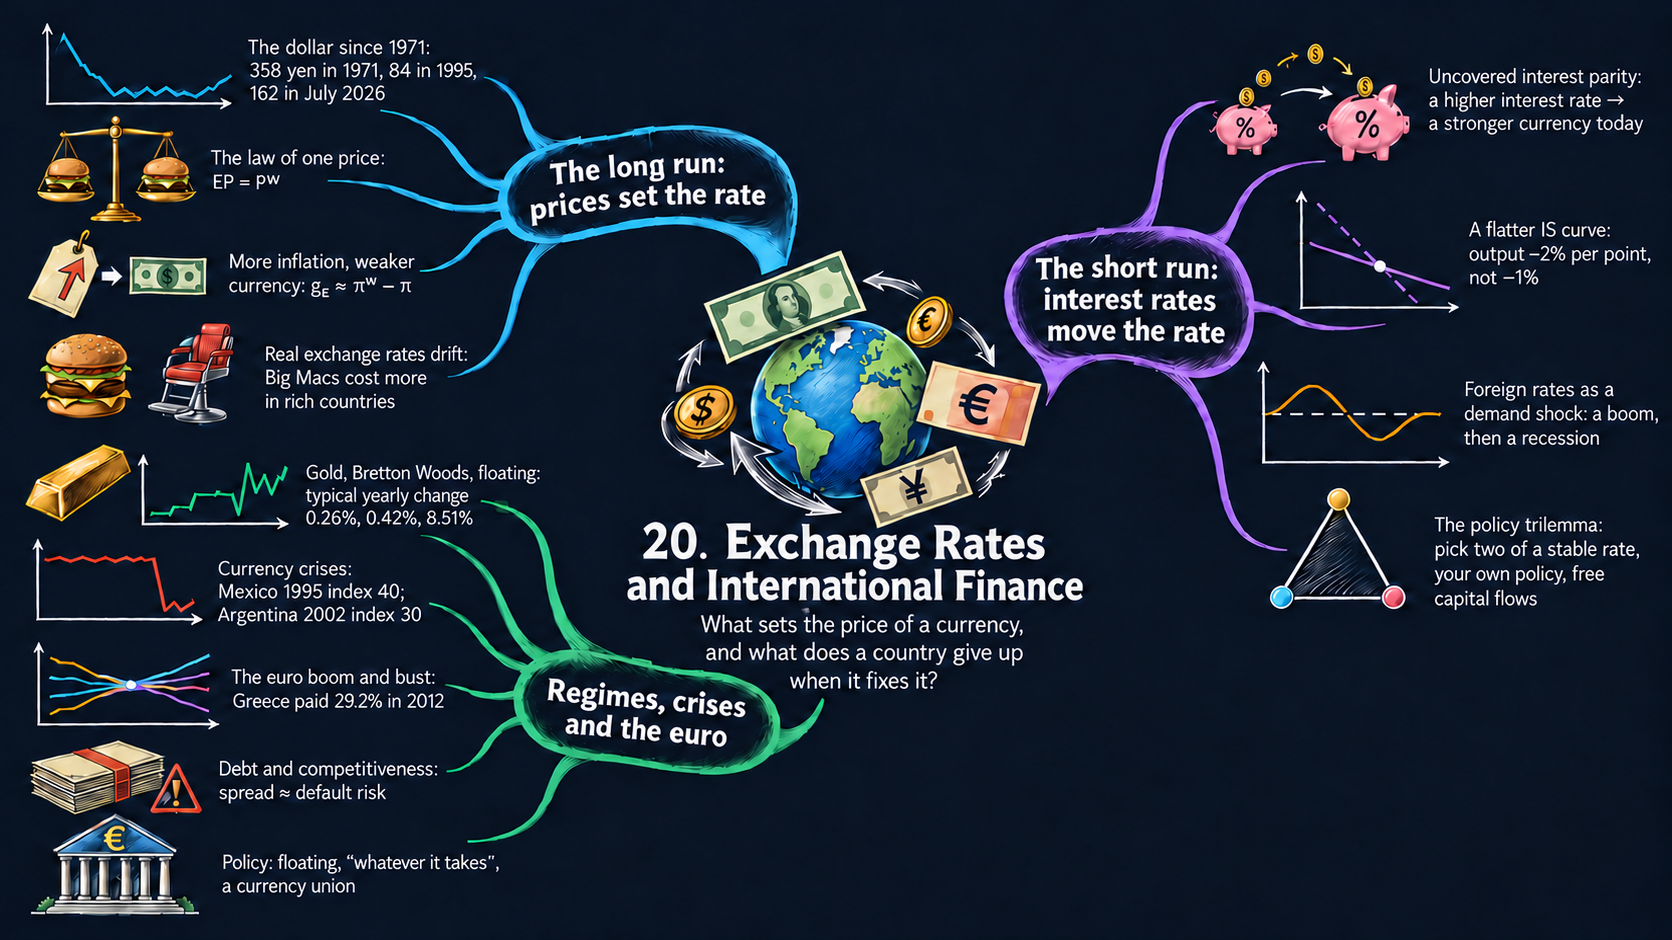
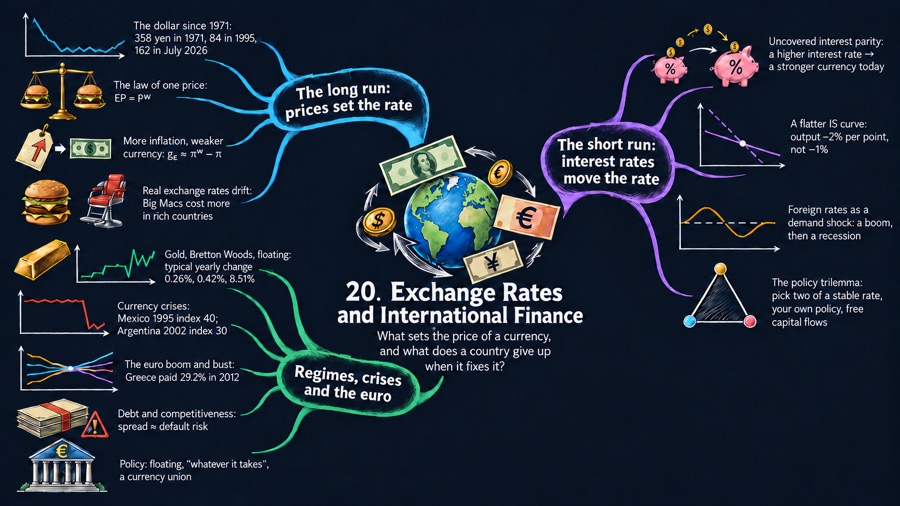
What moves a currency’s value?
Compare purchasing power across countries and returns across currencies. Explore exchange rates, international finance, and policy in an open economy.
 Explore the chapter map ↗
No matching chapter collections. Try another search or topic.
Figure Apps are called Model Apps in the book.
 Explore the chapter map