
Long-run growth
Why are some countries
so much richer?

Start with the differences in living standards. Then ask what capital, ideas, and institutions can explain.
Data · Maddison Project · 1950–2022
Explore Chapter 3 ↗A FIELD GUIDE TO THE WHOLE ECONOMY
Find the facts.
Explain the economy.
Why do living standards rise? What causes recessions and inflation? Explore the data, put models to work, and ask better questions—with Python and AI.
A Python Companion to Intermediate Macroeconomics.

A learning project by Carlos Mendez
A companion to Macroeconomics
by Charles I. Jones · 6th edition.


21 chapters / 9 appendices / Learn by doing
From data to understandingTHREE PILLARS. ONE CONNECTED APPROACH.
Find a pattern. Build an explanation.
Use AI to go further—and check every step.
Download, plot, and explore real economic data. Compare countries and periods to discover which patterns hold—and which questions to ask next.
Explore Data AppsOperate the models that explain the facts. Move a slider, change a parameter, and compare the prediction with what the data show.
Explore Figure AppsWork with an AI assistant in Colab, see the big picture in mind maps and slides, and learn by changing the code. Use AI, but check its answers.
Start with Python and AITHE FULL CURRICULUM
Follow the chapters in order, or start with the question on your mind. Read, code, explore, or listen—each chapter gives you a way in.
Start with income, jobs, and prices. Discover how economists move from facts to models, then use those models to ask new questions.
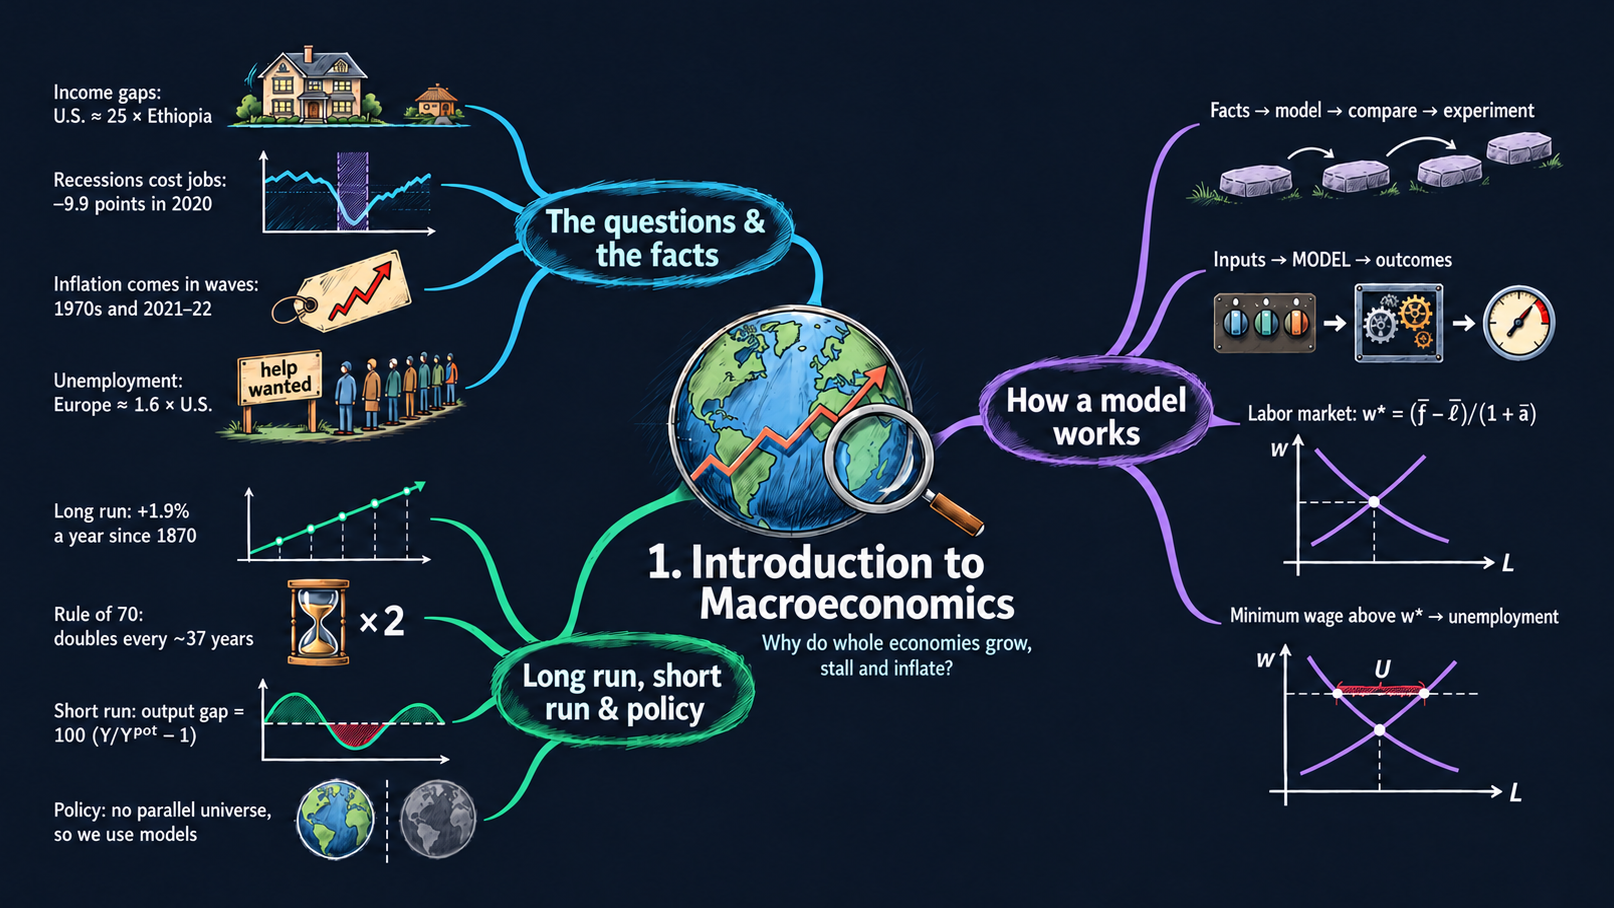 Explore the chapter map ⊕ Mind map
AI podcast · 22 min
Now: Opening
Follow production, spending, and income through the national accounts. Learn what GDP measures, how prices change, and what the headline numbers leave out.
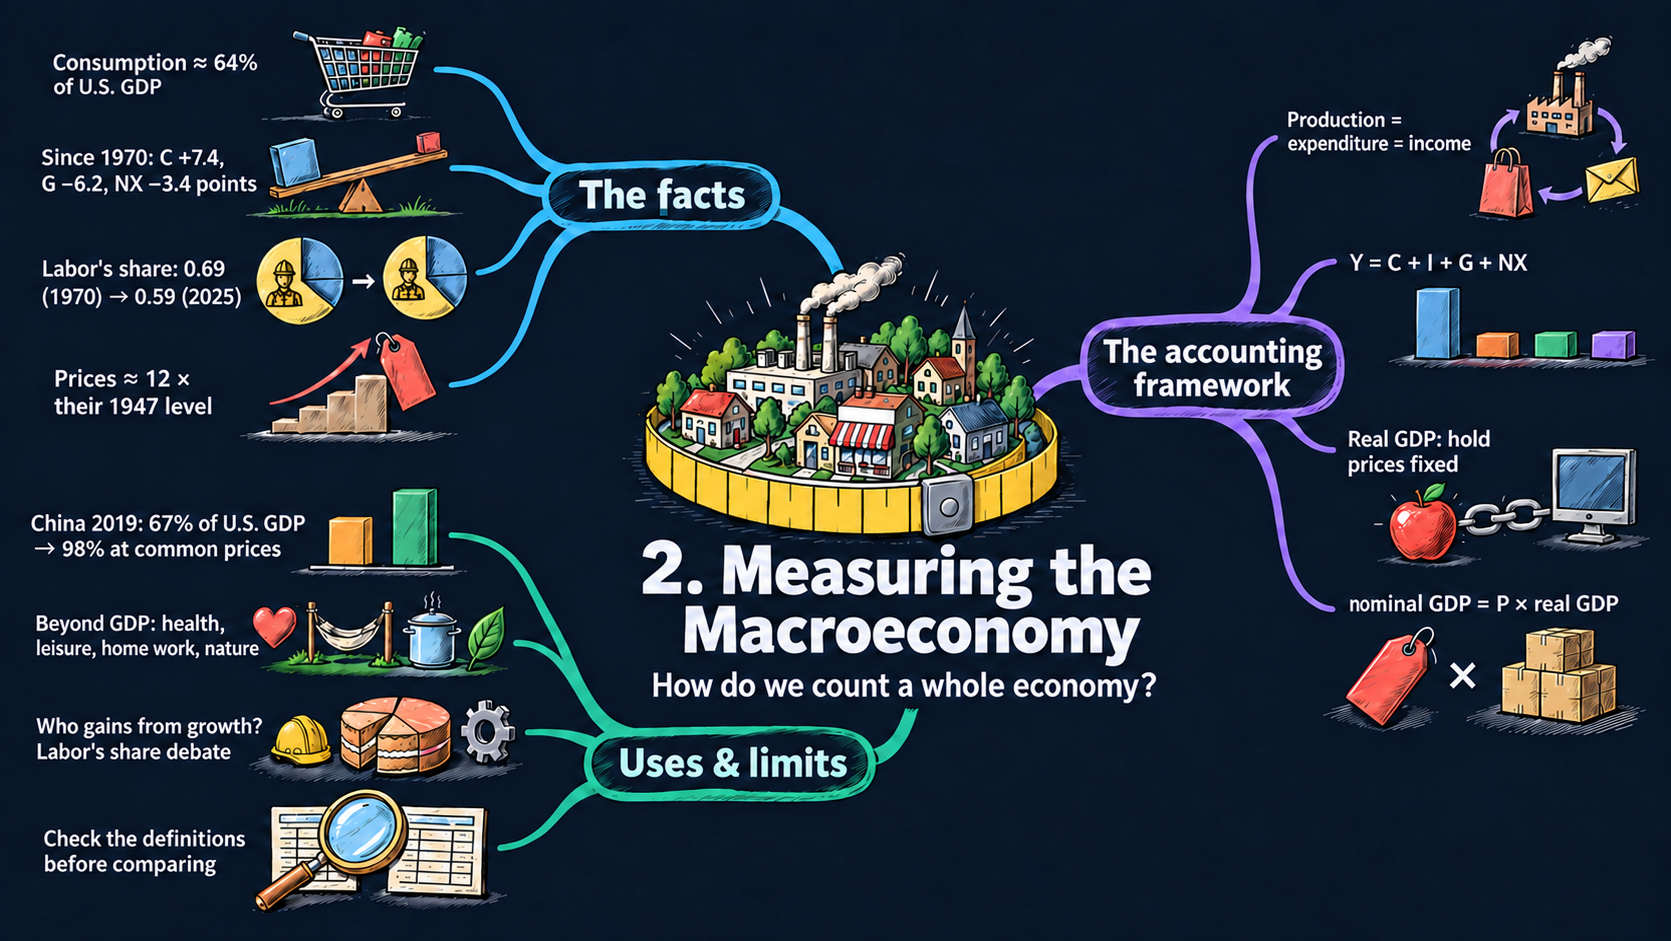 Explore the chapter map ⊕ Mind map
AI podcast · 22 min
Now: Opening
Trace living standards across countries and centuries. Explore the power of compounding and the striking differences in when sustained growth began.
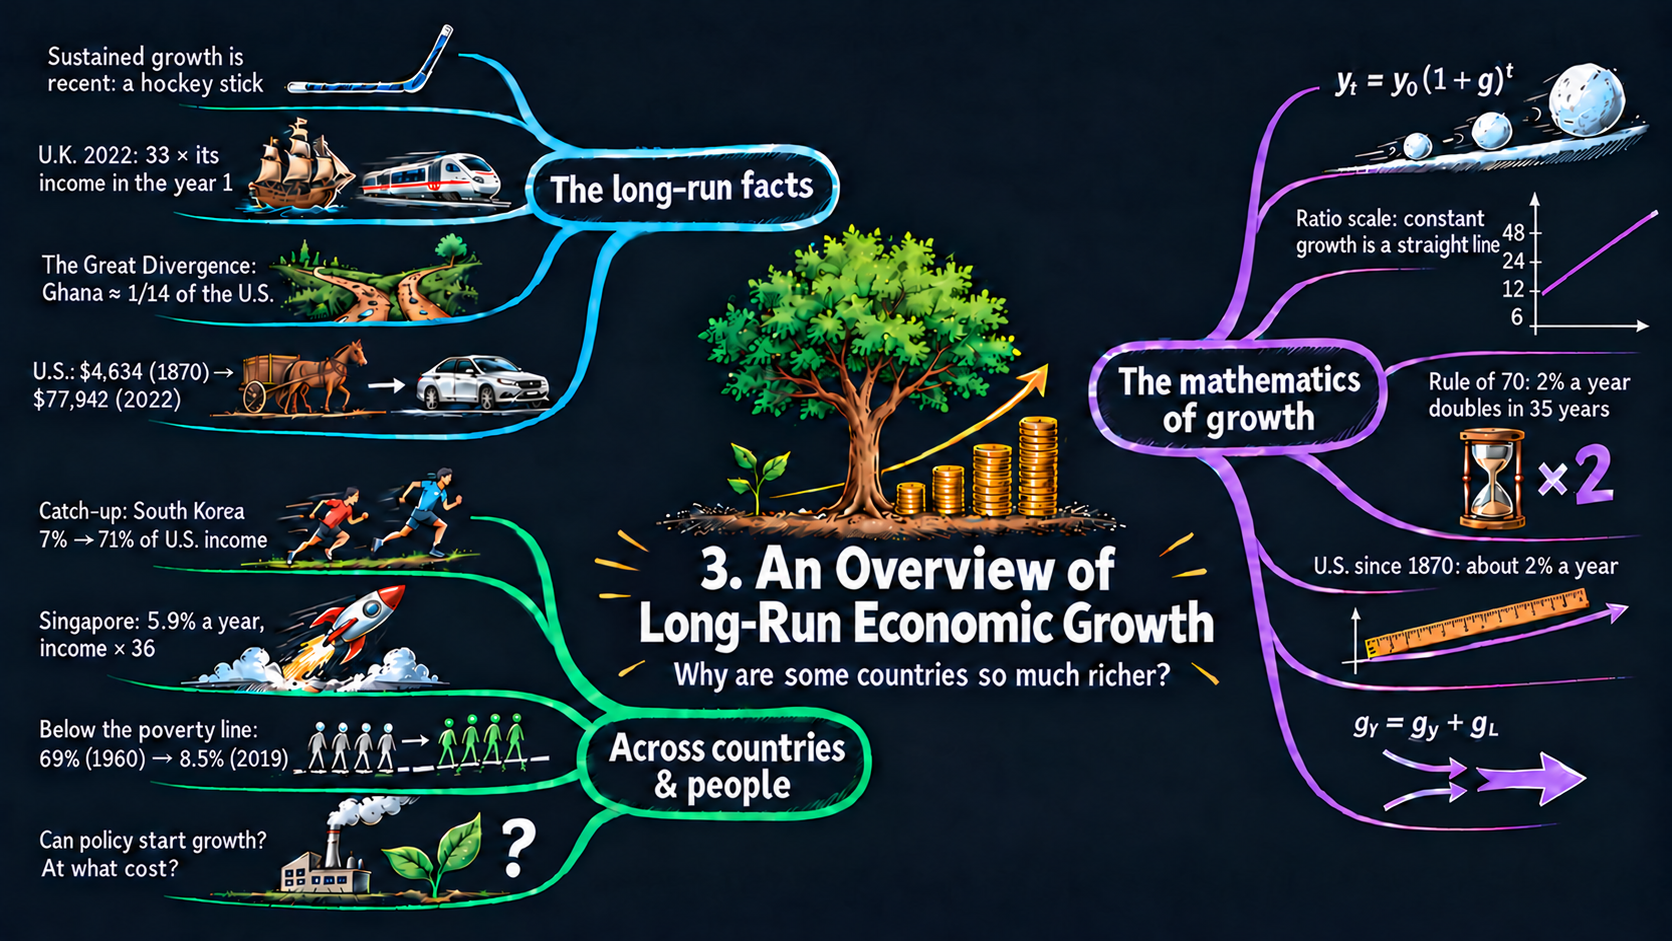 Explore the chapter map ⊕ Mind map
AI podcast · 22 min
Now: Opening
Build a production model from capital, labor, and productivity. Compare its predictions with the data to see how much of the income gap it can explain.
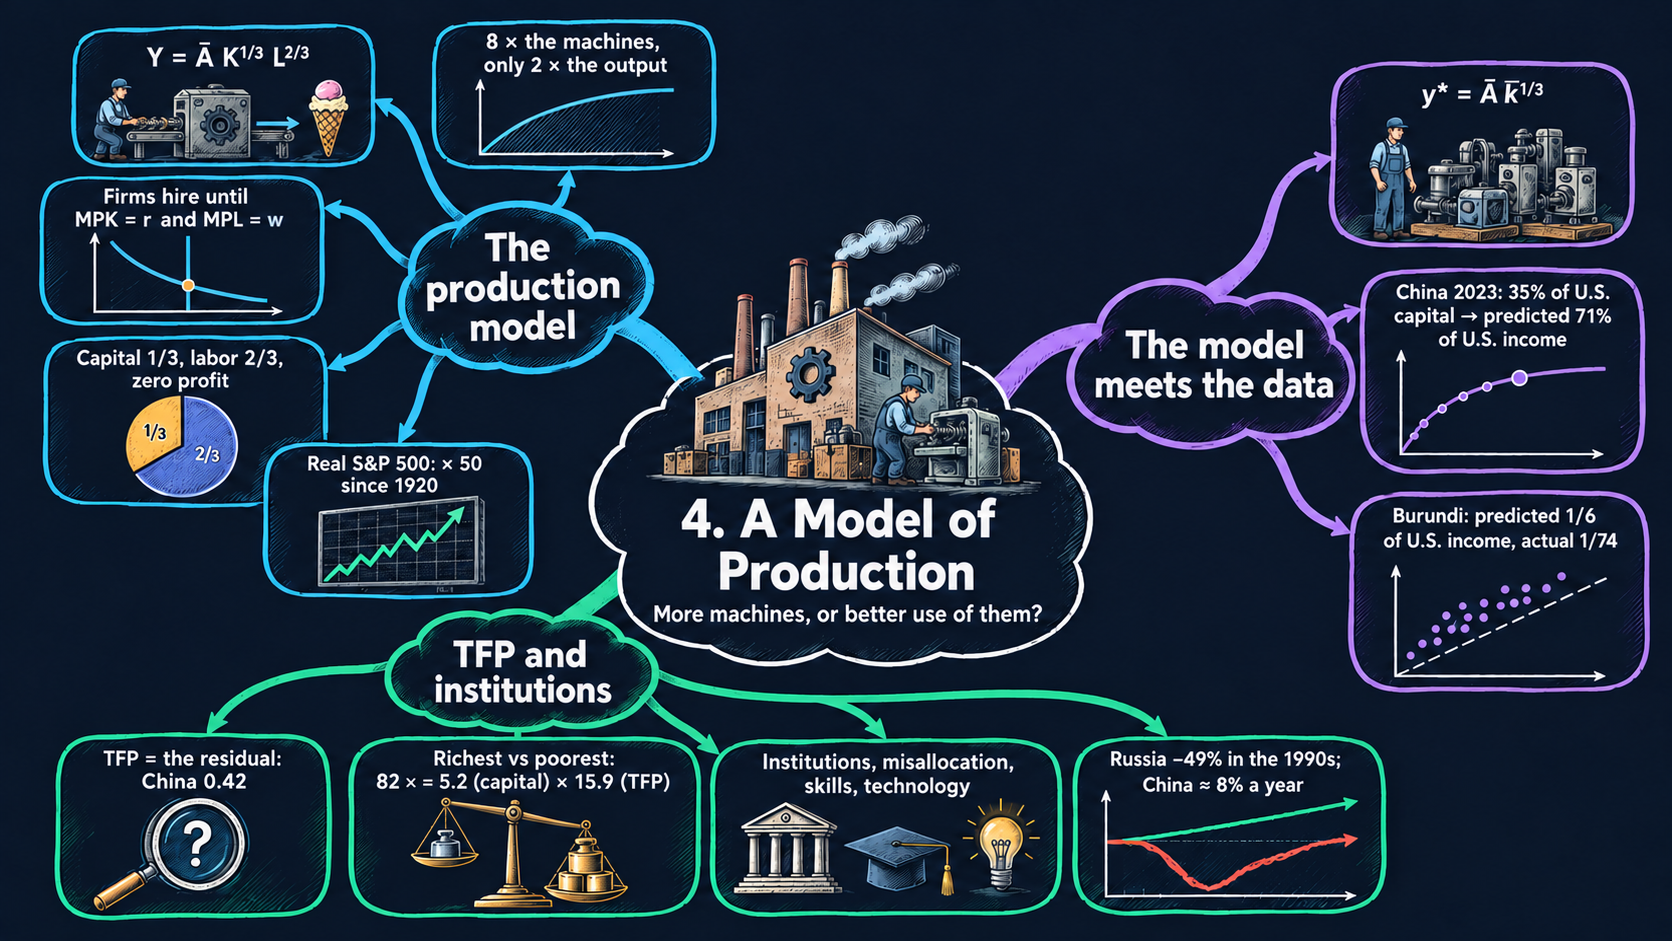 Explore the chapter map ⊕ Mind map
AI podcast · 23 min
Now: Opening
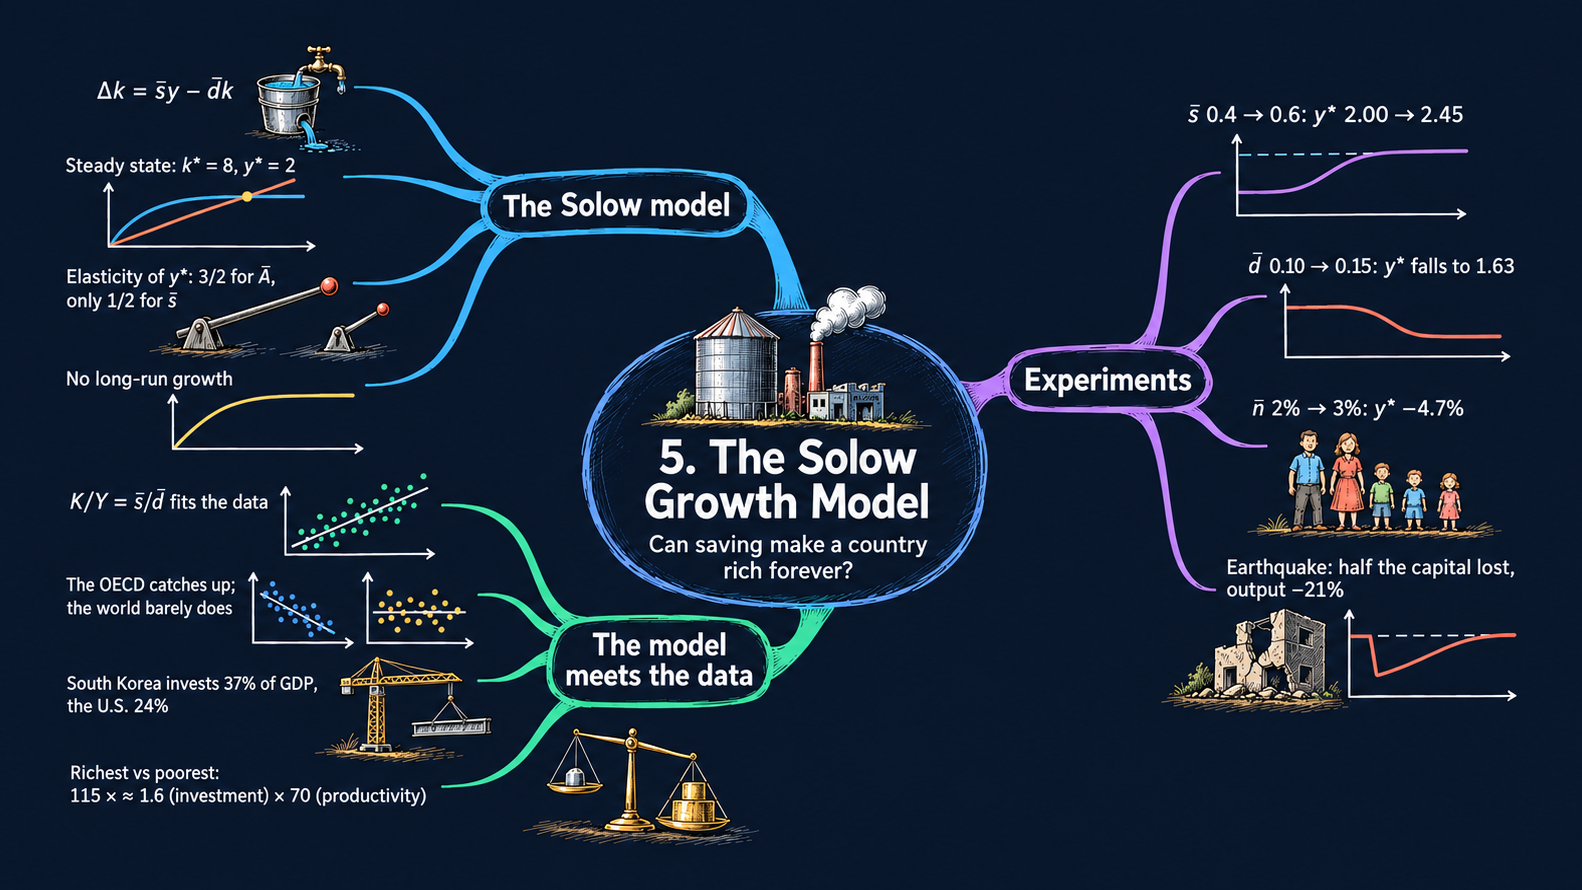
Operate the Solow model and watch capital accumulate. Explore steady states, transition dynamics, and the limits of growth driven by investment alone.
 Explore the chapter map ⊕ Mind map
AI podcast · 22 min
Now: Opening
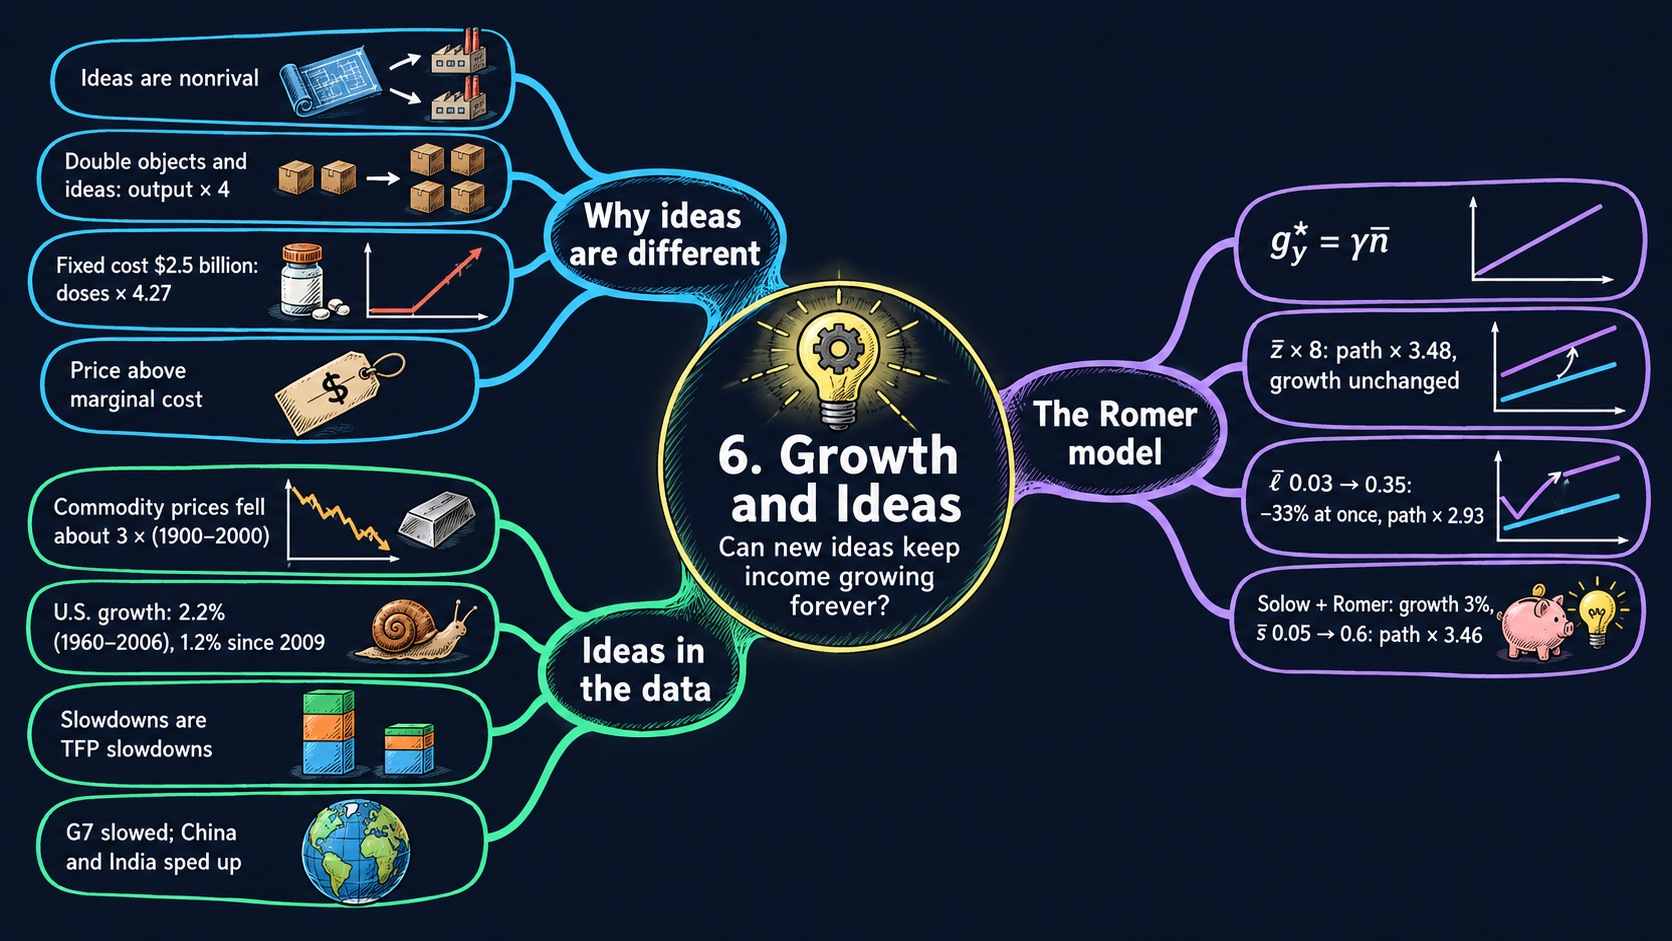
Ideas can be used by many people at once. Explore how this changes the economics of production and why research can sustain rising living standards.
 Explore the chapter map ⊕ Mind map
AI podcast · 23 min
Now: Opening
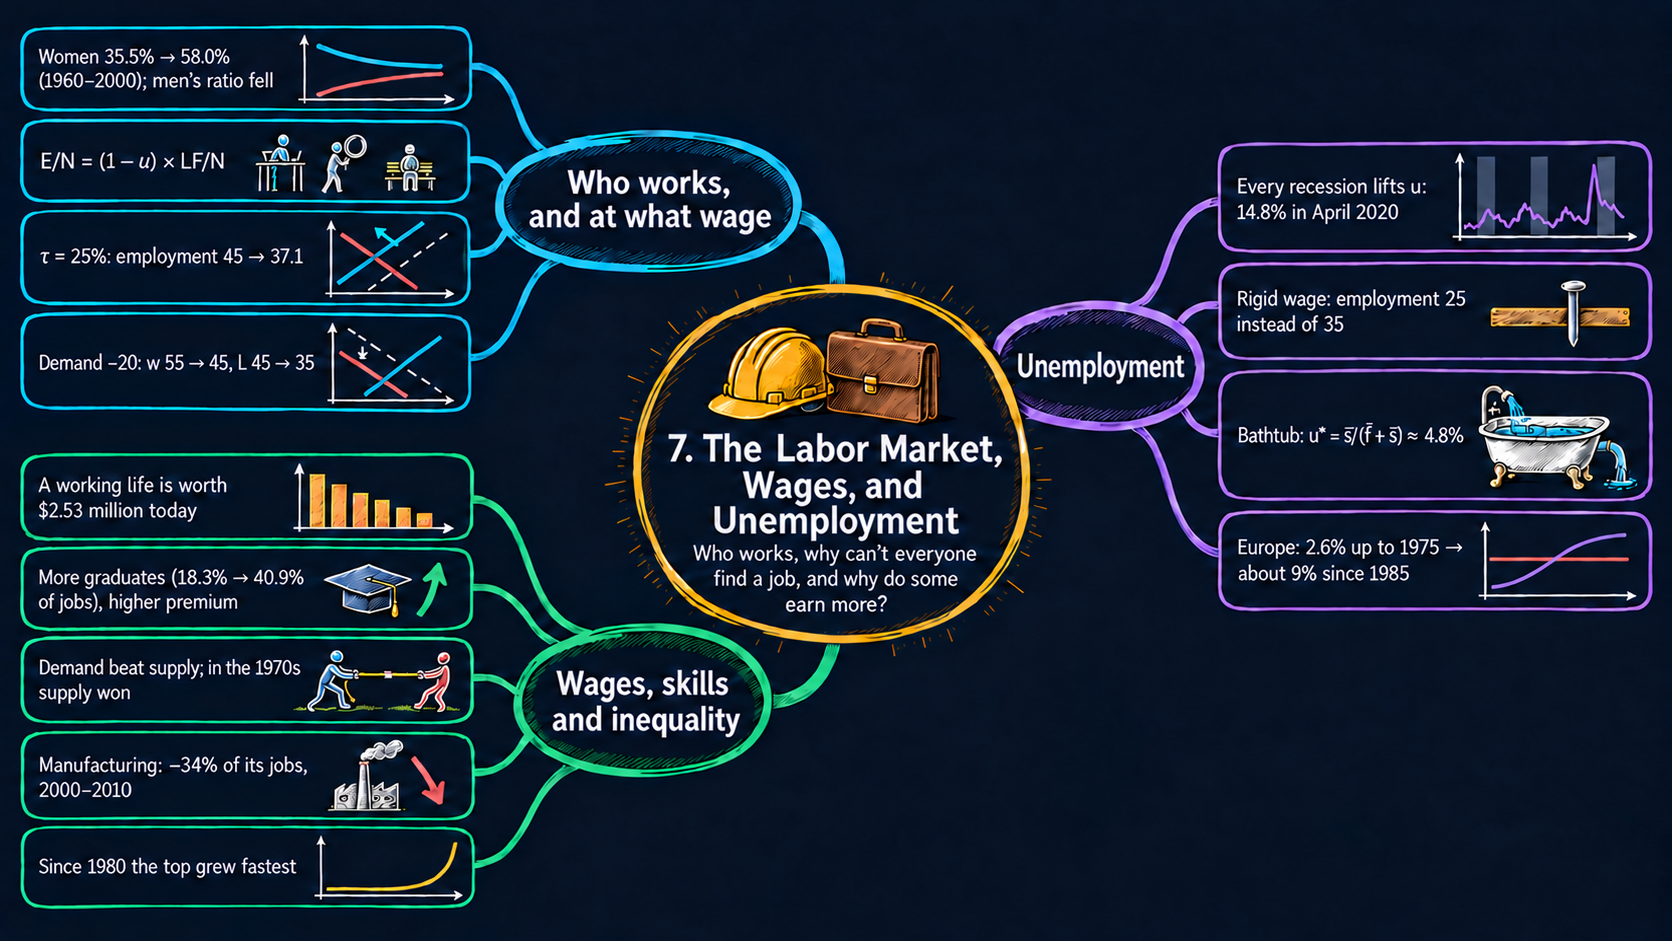
Connect wages and employment to labor supply and demand. Then follow workers into and out of jobs to understand persistent unemployment.
 Explore the chapter map ⊕ Mind map
AI podcast · 22 min
Now: Opening
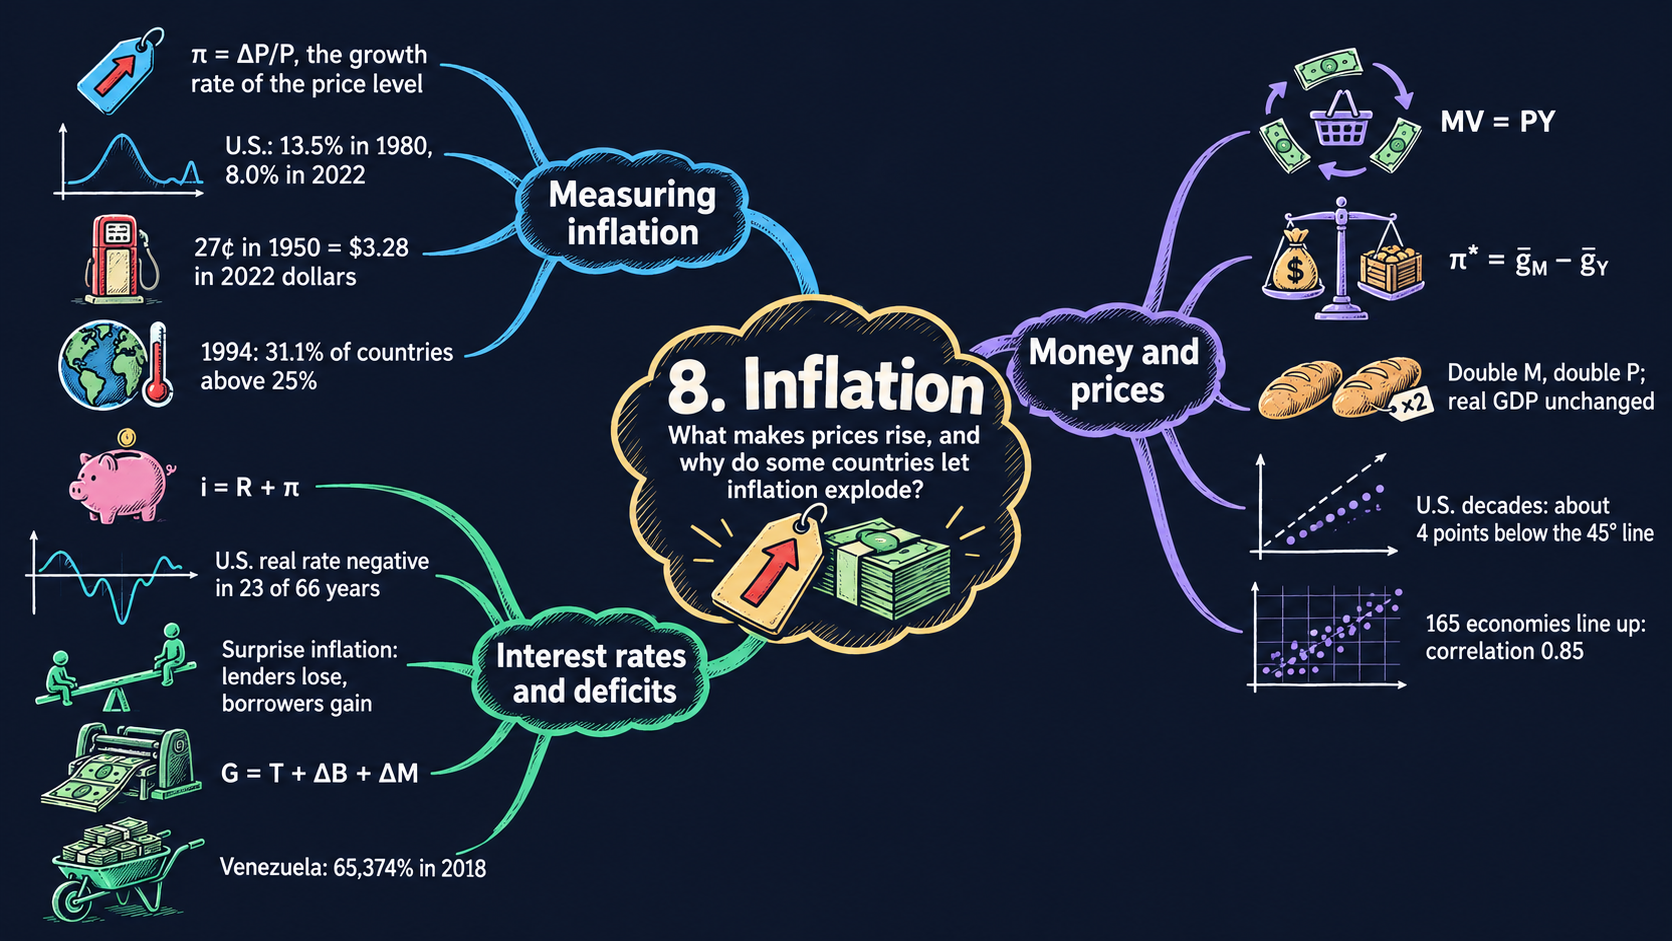
Measure inflation in the data and connect prices to money and output. Explore the quantity theory, real interest rates, and the costs of inflation.
 Explore the chapter map ⊕ Mind map
AI podcast · 23 min
Now: Opening
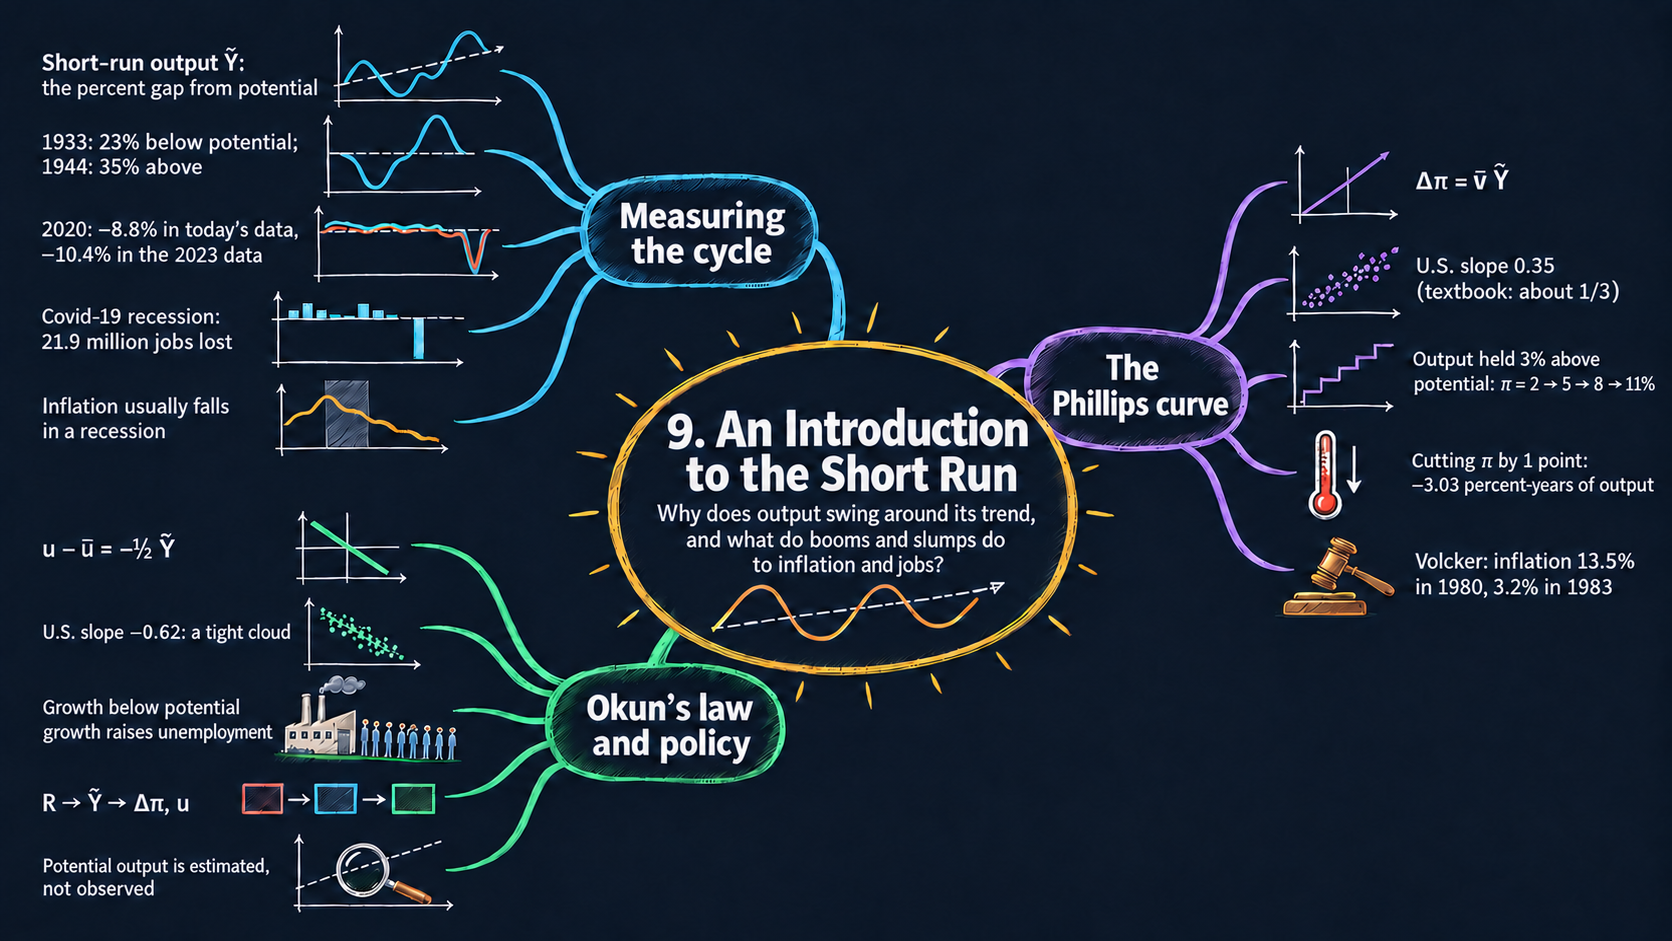
Separate the long-run path of output from short-run fluctuations. Use data on output, jobs, and inflation to describe what happens in a recession.
 Explore the chapter map ⊕ Mind map
AI podcast · 23 min
Now: Opening
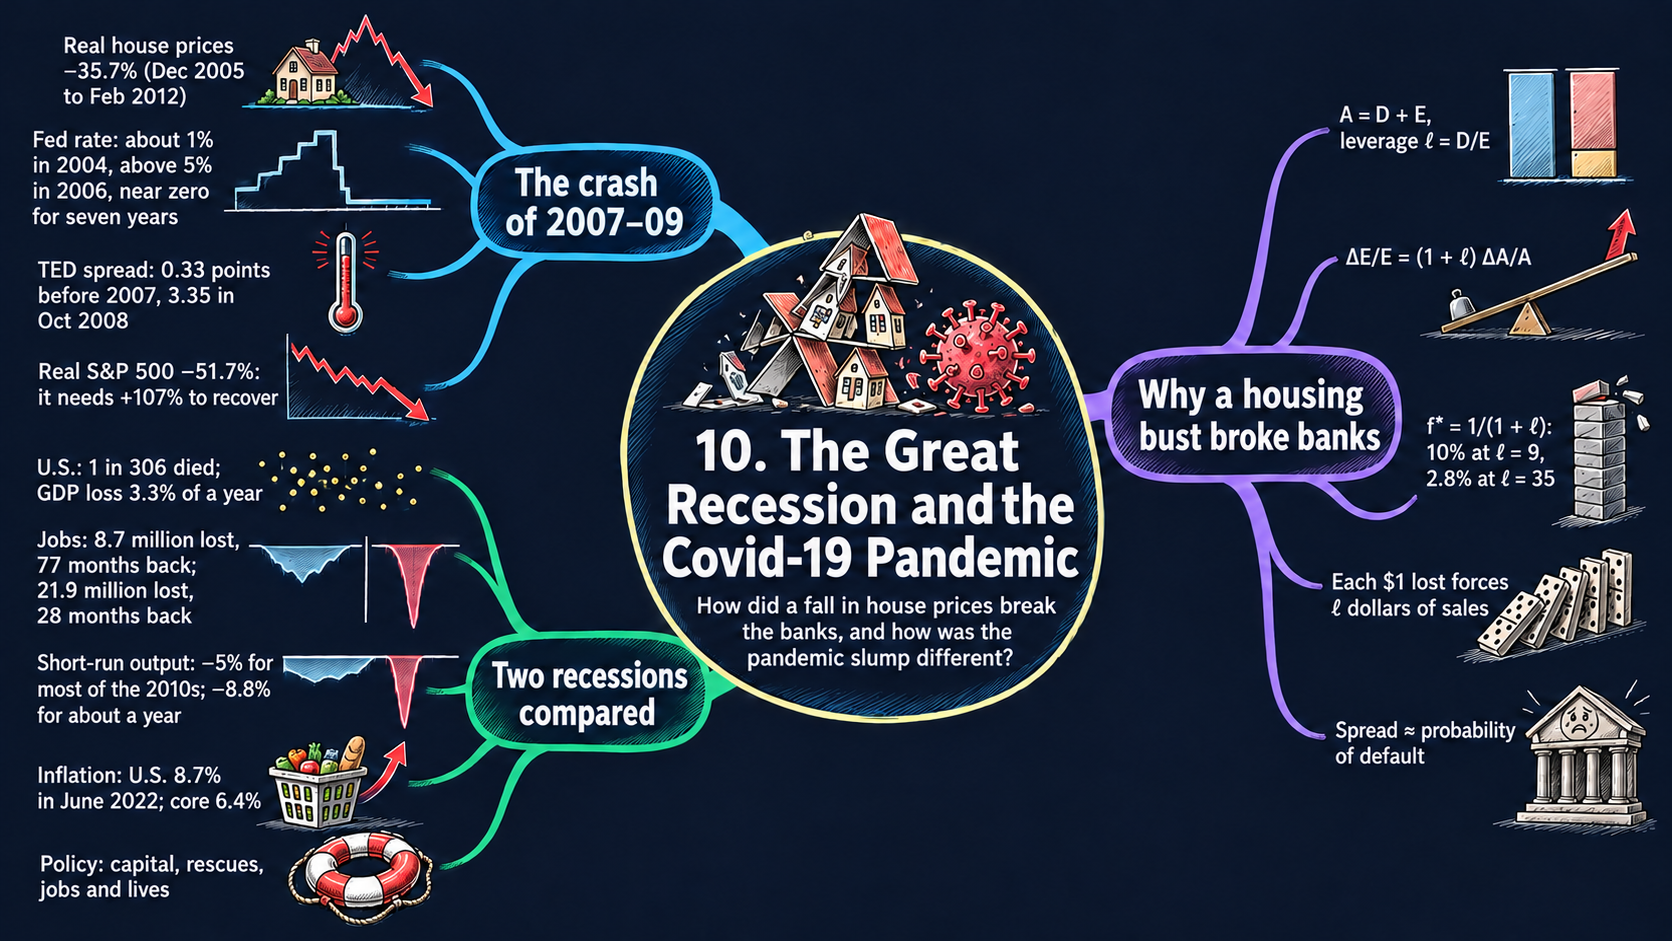
Compare two very different downturns. Trace housing, financial markets, output, and employment to see how each shock spread through the economy.
 Explore the chapter map ⊕ Mind map
AI podcast · 22 min
Now: Opening
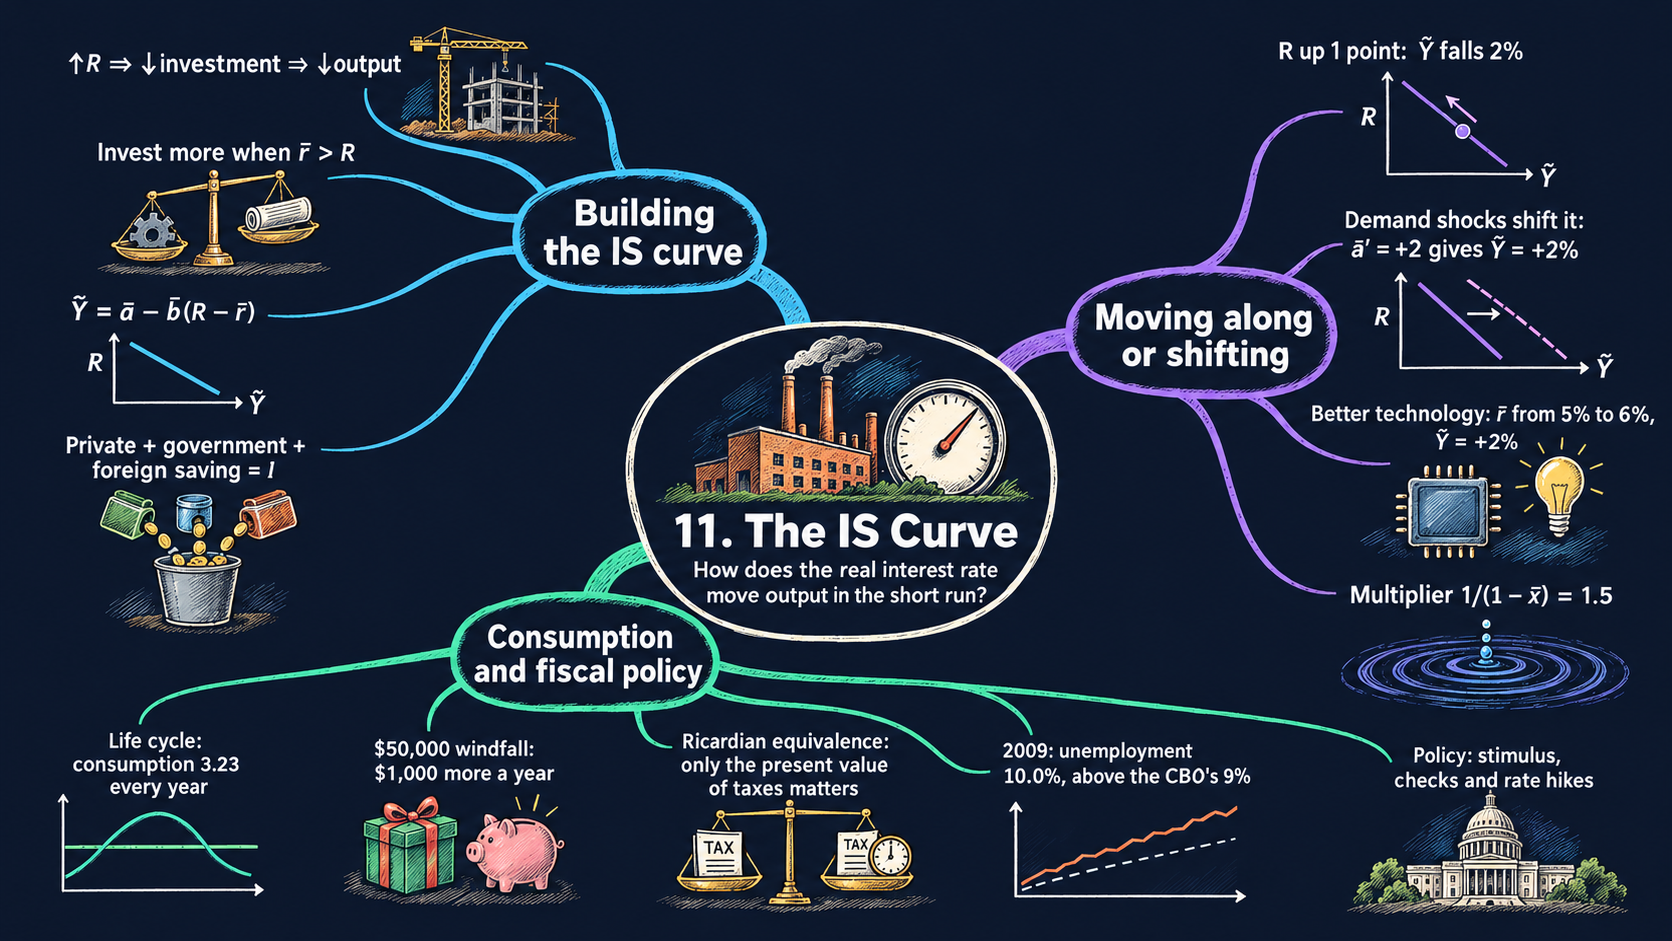
Build the IS curve from the national income identity. Change demand and borrowing costs to see why short-run output moves.
 Explore the chapter map ⊕ Mind map
AI podcast · 22 min
Now: Opening
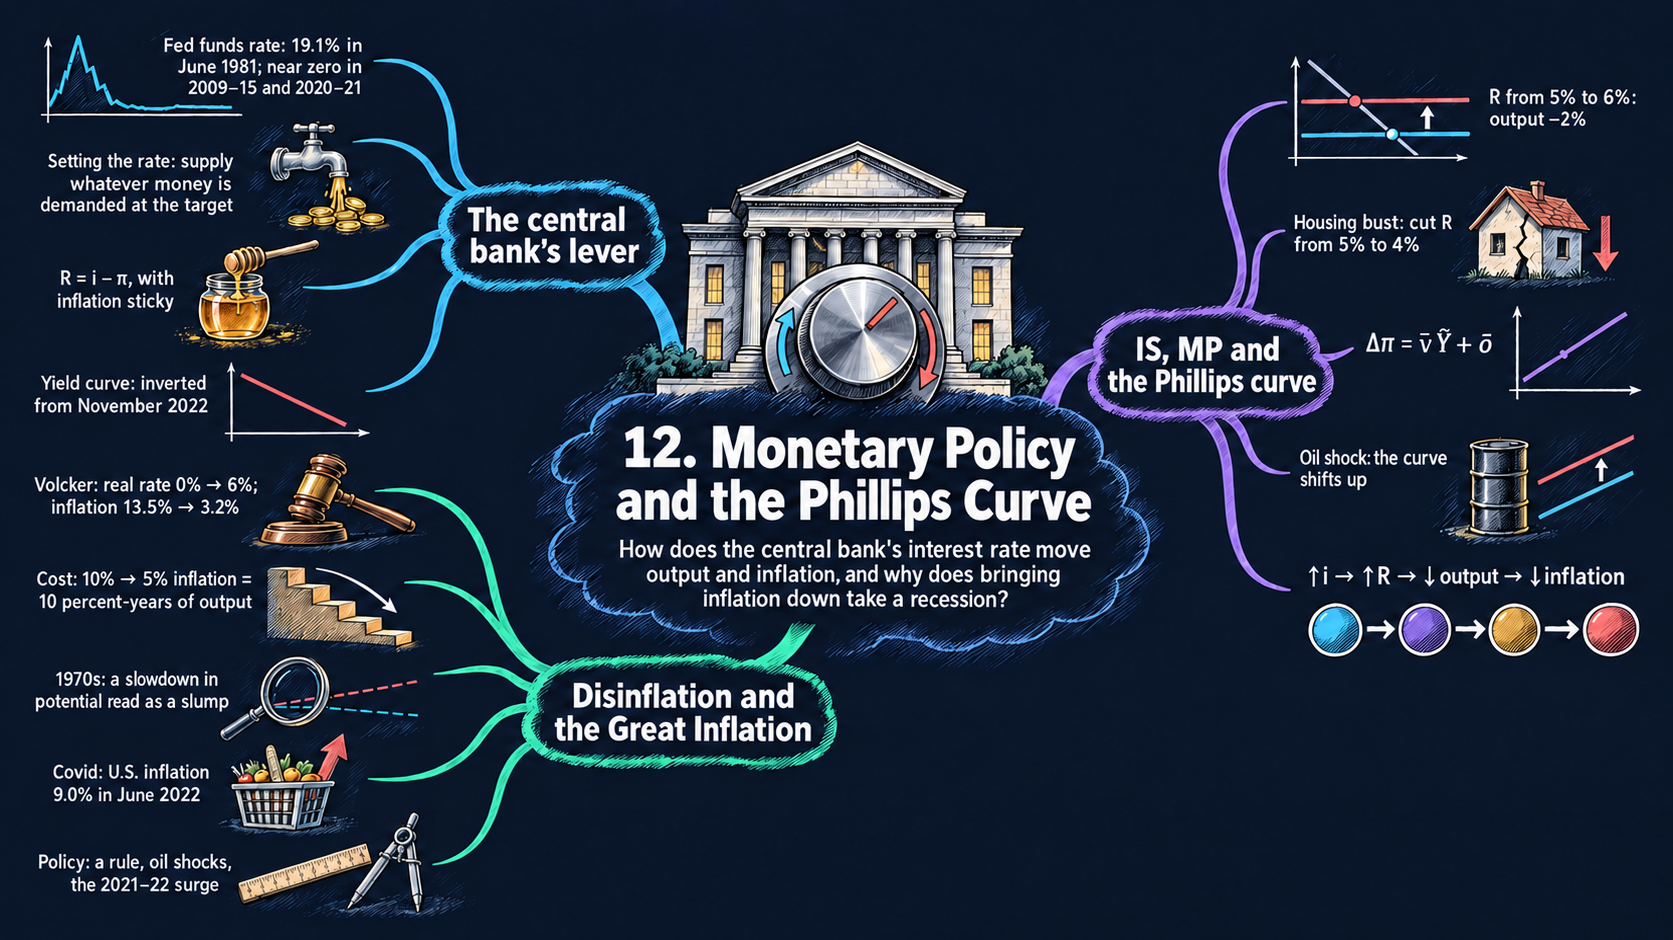
Connect monetary policy to the IS and Phillips curves. Follow the path of output and inflation when the central bank changes the interest rate.
 Explore the chapter map ⊕ Mind map
AI podcast · 22 min
Now: Opening
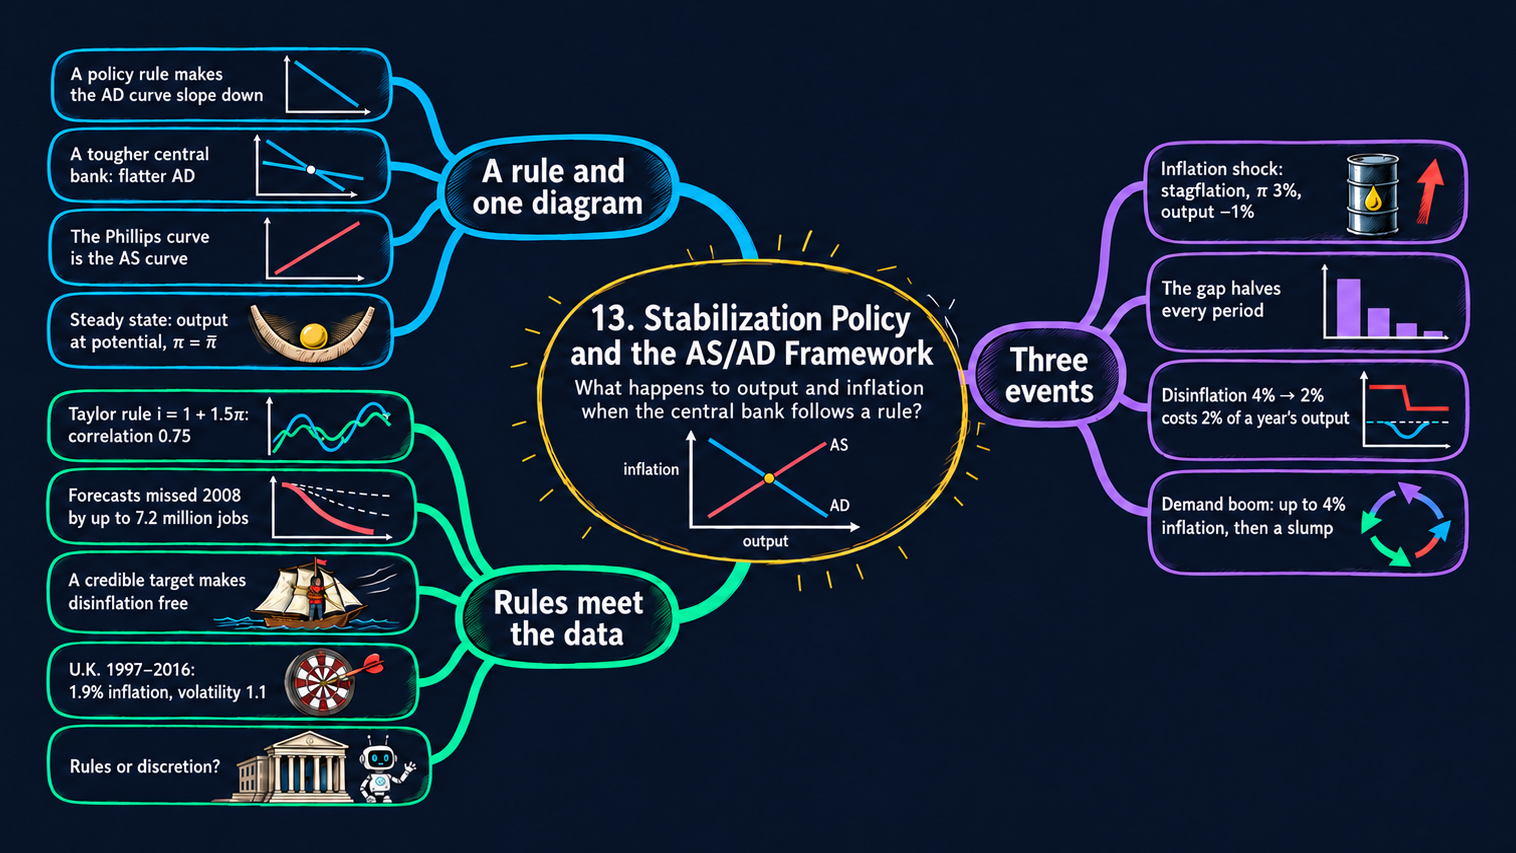
Bring the short-run model together in the AS/AD diagram. Explore how policy rules, expectations, and different shocks shape the adjustment.
 Explore the chapter map ⊕ Mind map
AI podcast · 22 min
Now: Opening
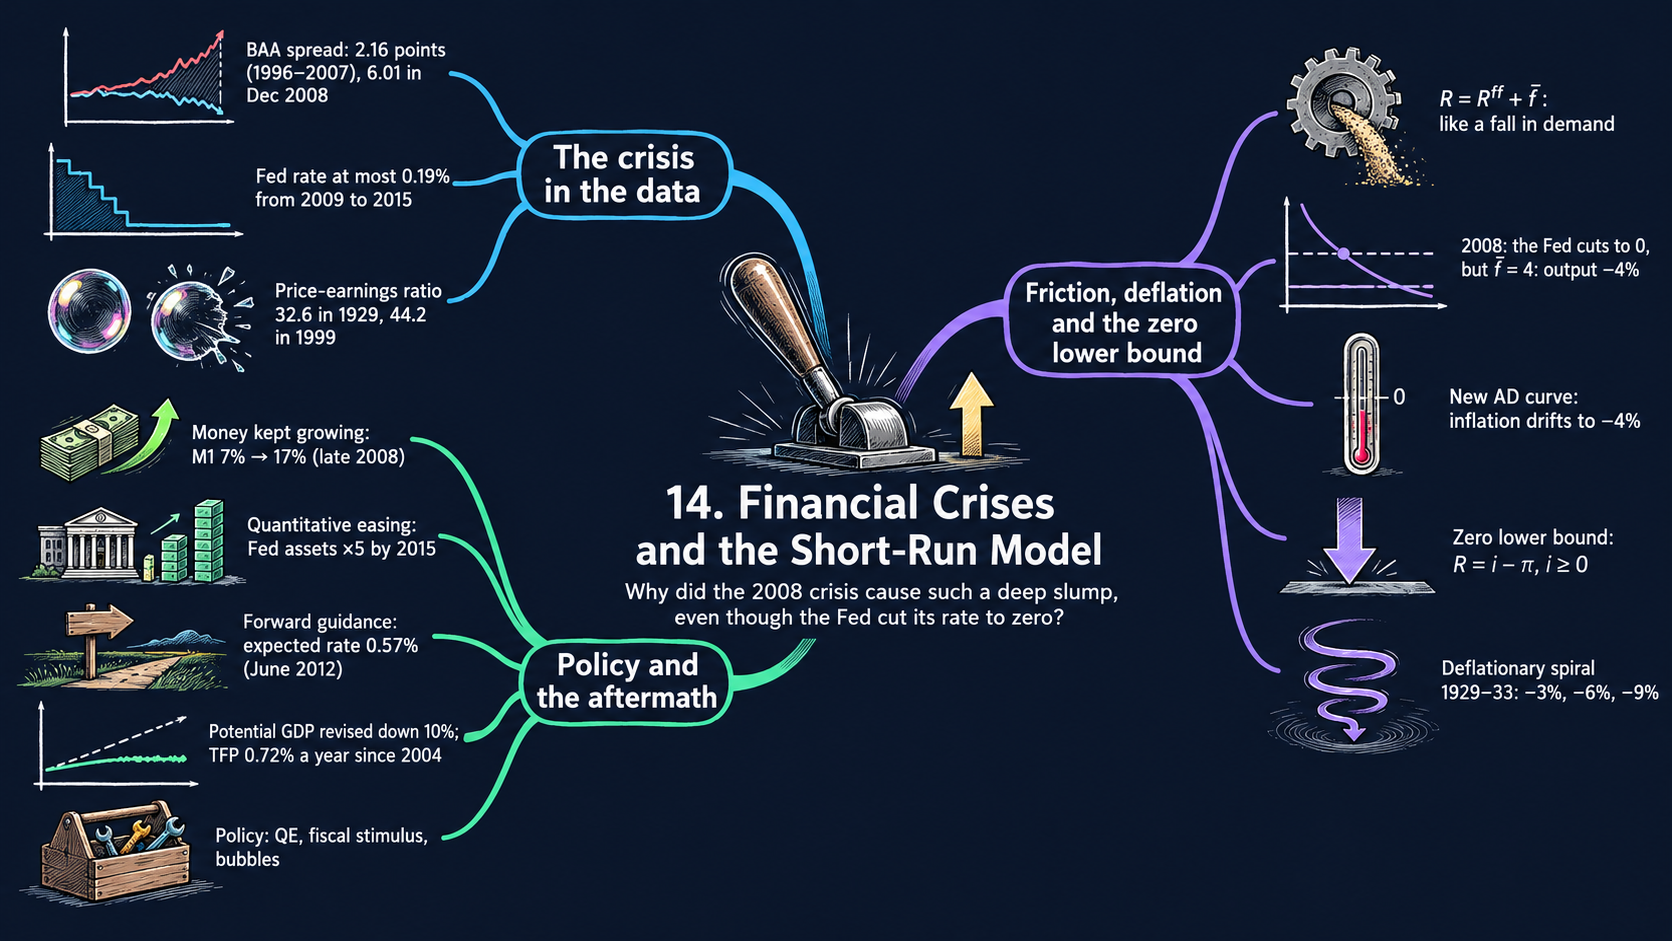
Add risk premiums and financial frictions to the short-run model. Examine how a credit crisis, deflation, and policy constraints can deepen a recession.
 Explore the chapter map ⊕ Mind map
AI podcast · 22 min
Now: Opening
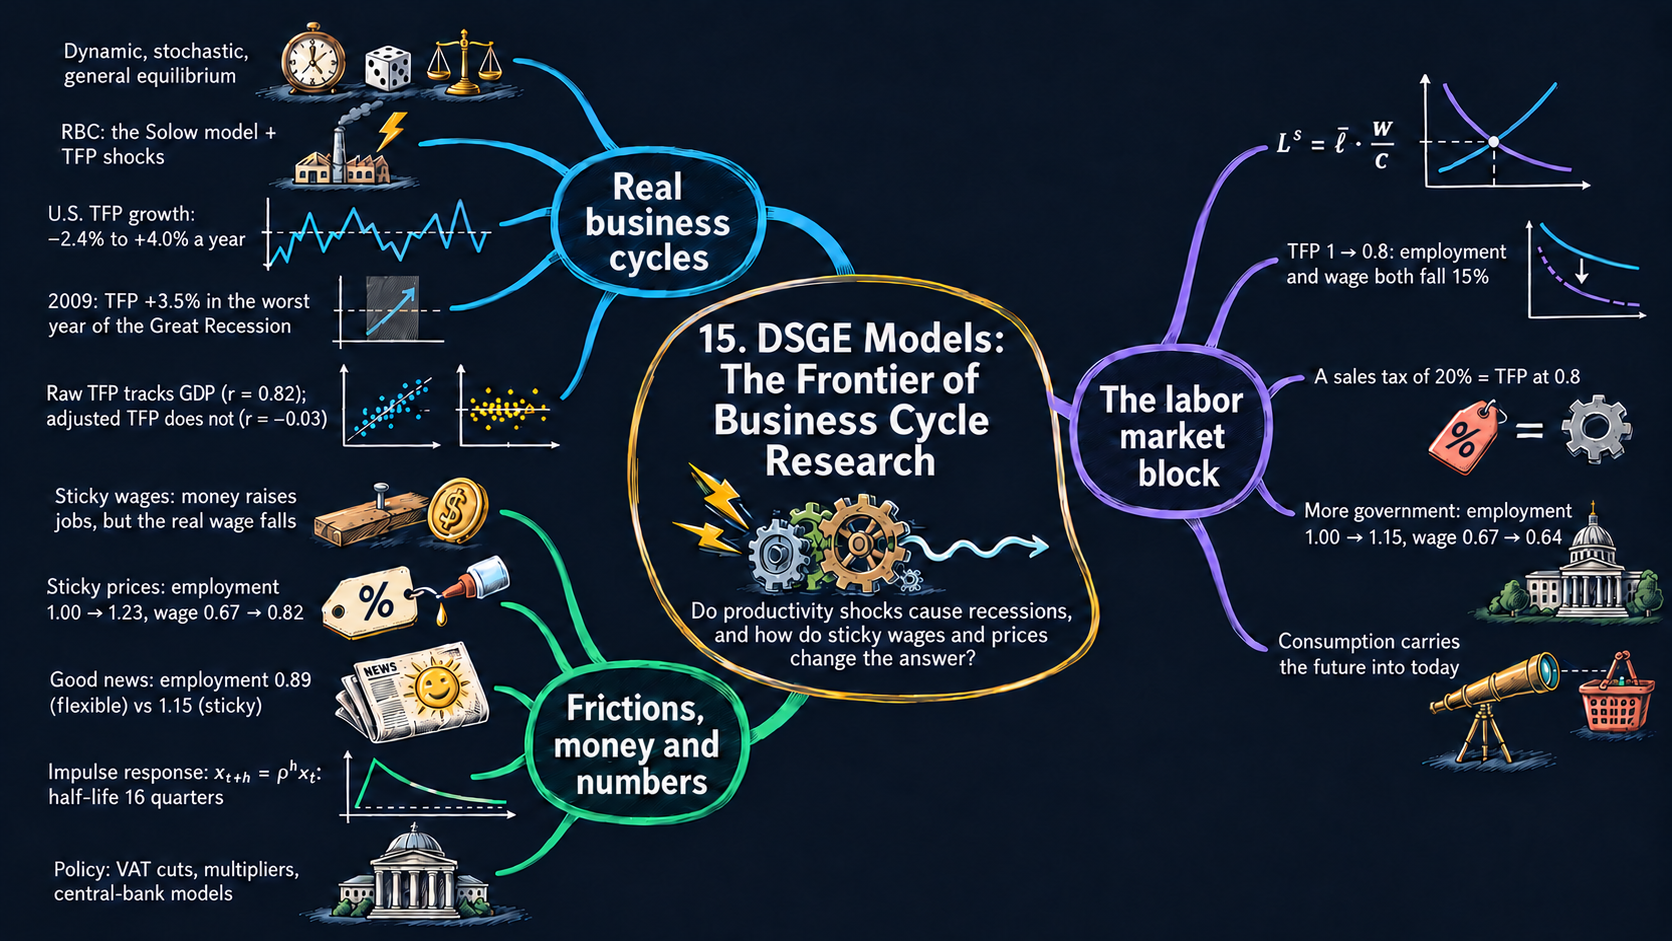
Meet the agents, shocks, and frictions inside DSGE models. Explore how productivity, labor markets, and sticky prices shape the economy’s response.
 Explore the chapter map ⊕ Mind map
AI podcast · 23 min
Now: Opening
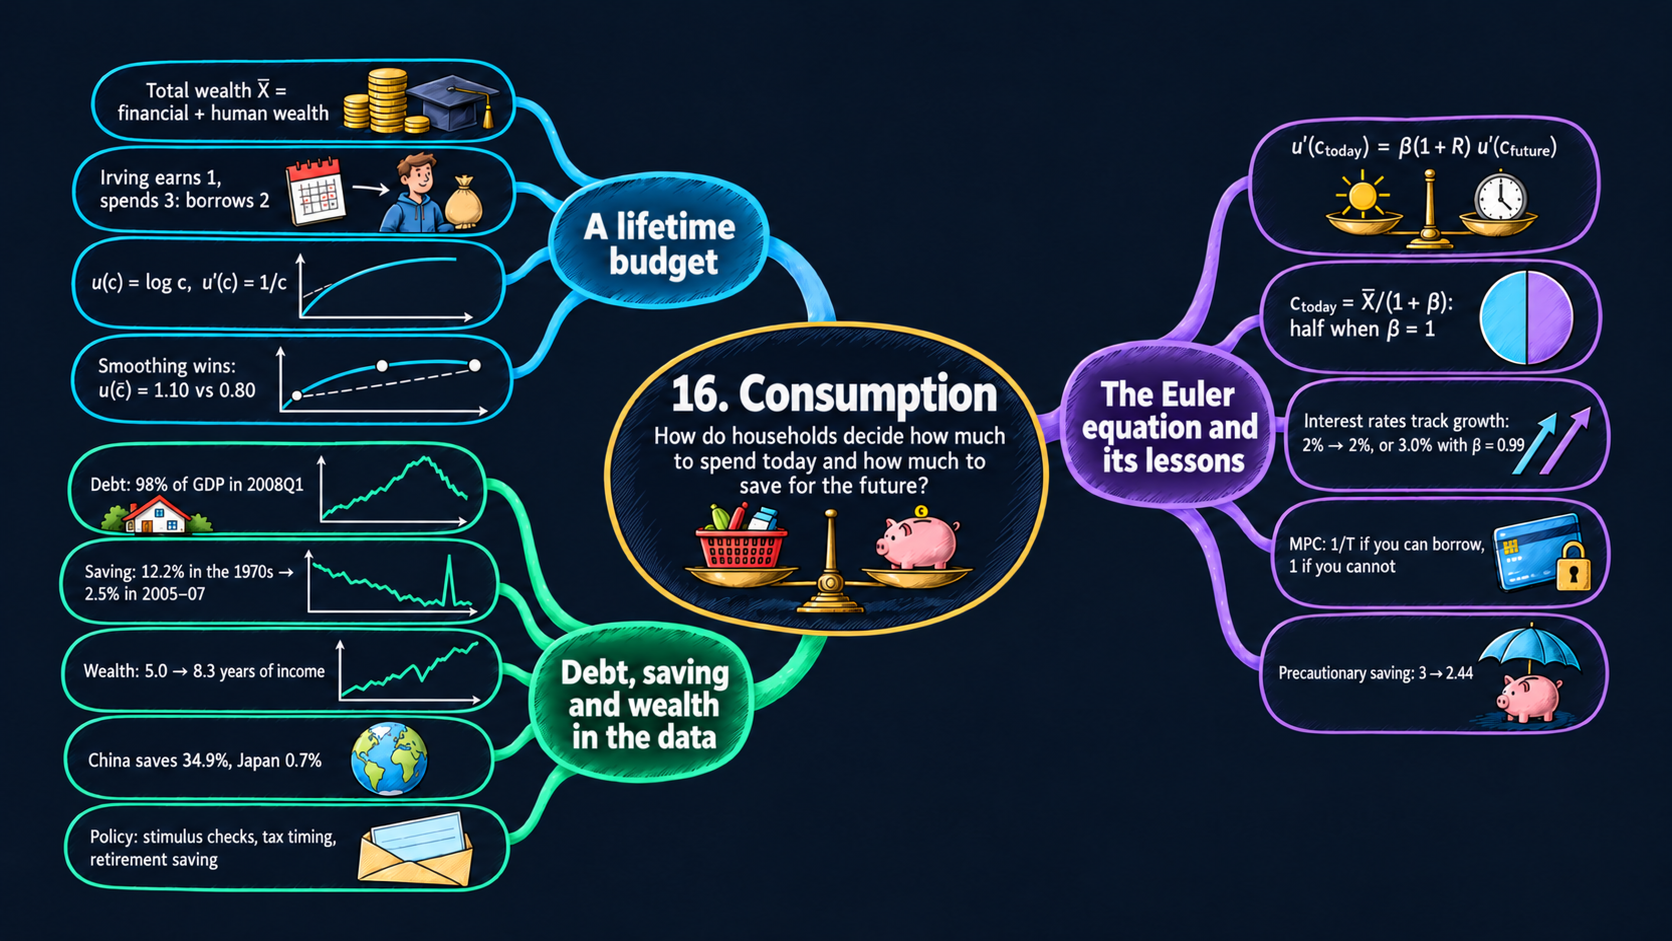
Spread income and wealth across a lifetime. Use a two-period model to explore consumption smoothing, patience, and the role of interest rates.
 Explore the chapter map ⊕ Mind map
AI podcast · 22 min
Now: Opening
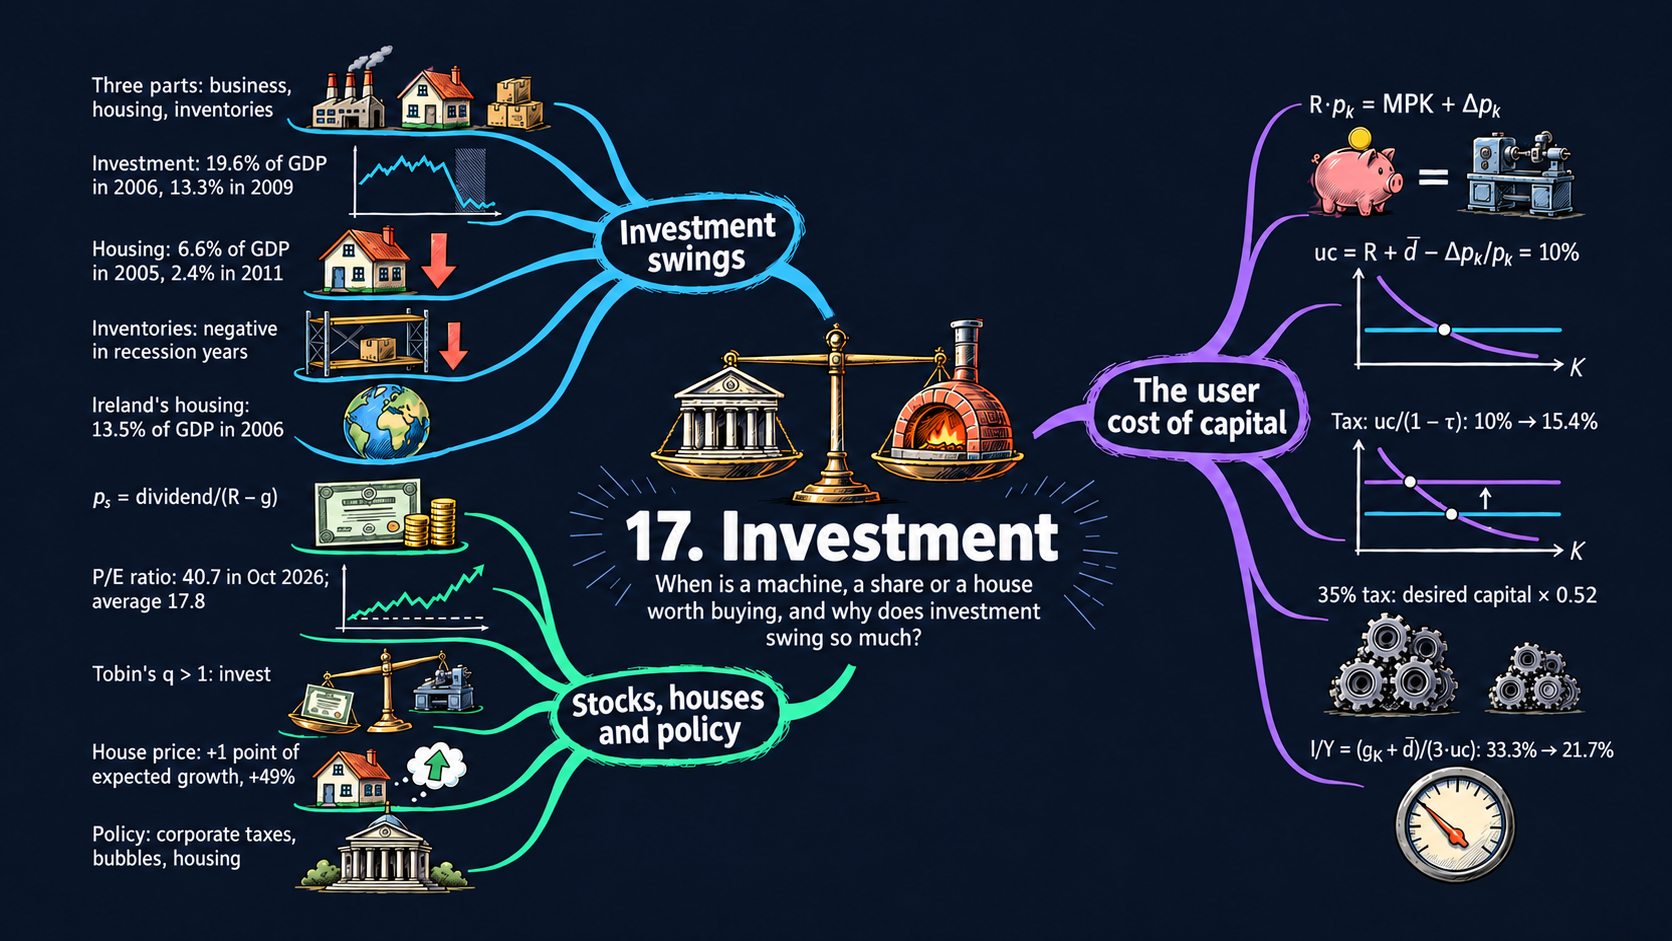
Compare the return on capital with its cost. Connect firms’ investment choices to interest rates, taxes, stock prices, and housing.
 Explore the chapter map ⊕ Mind map
AI podcast · 22 min
Now: Opening
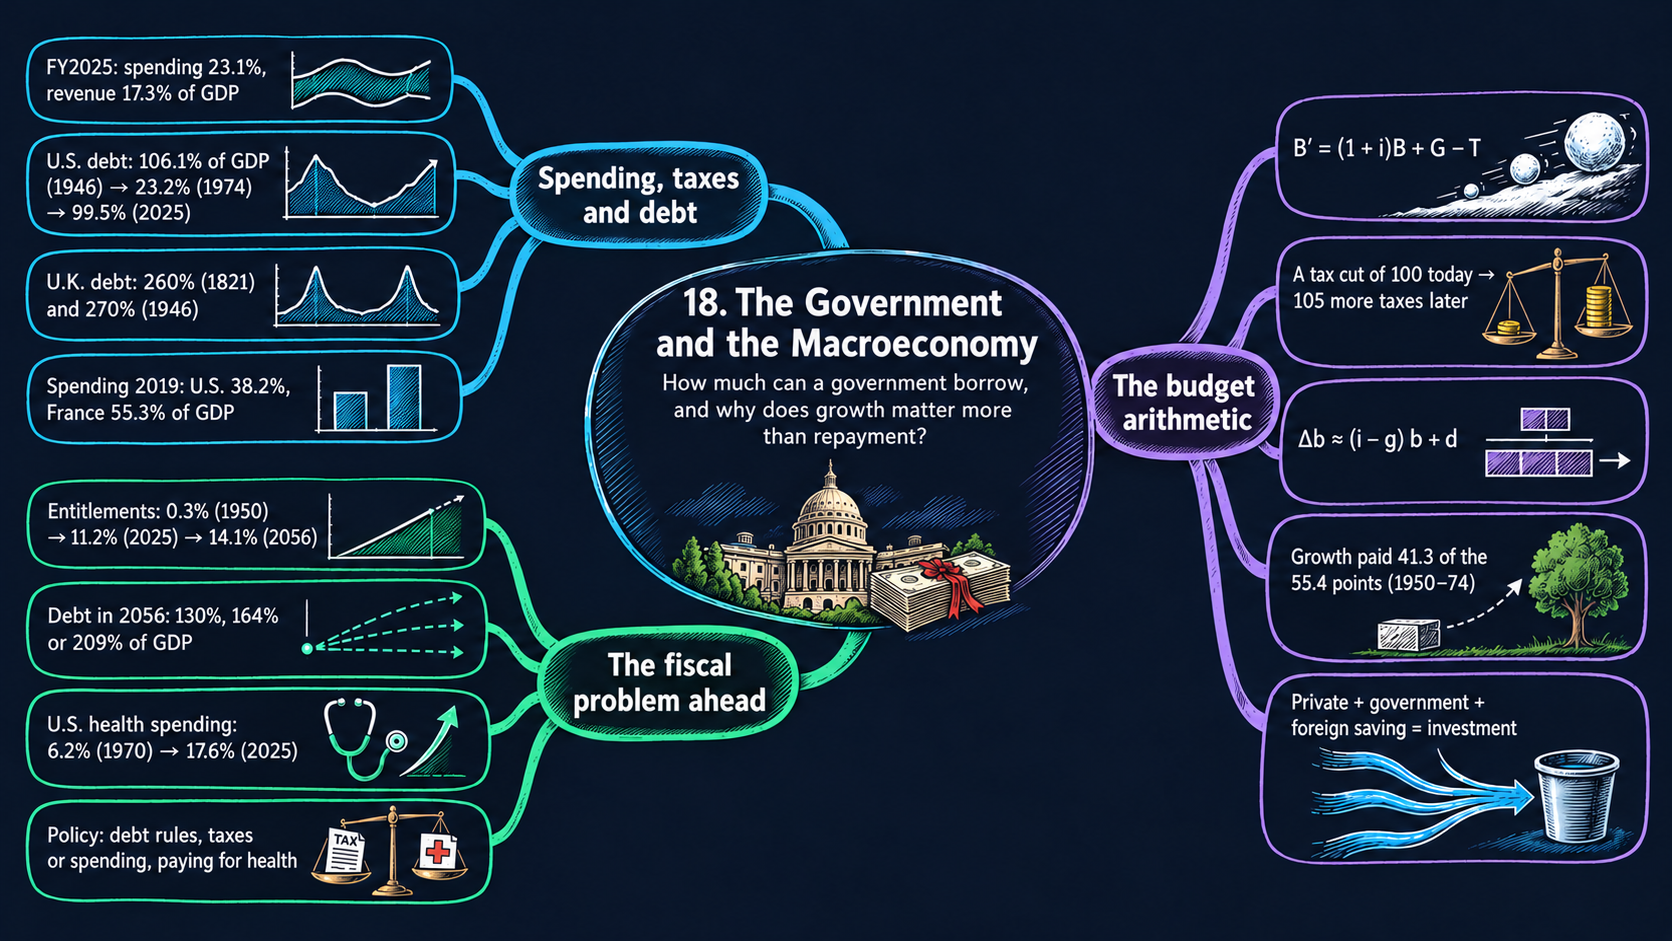
Follow government spending, taxes, and borrowing through the budget constraint. Explore debt dynamics and the choices involved in financing public spending.
 Explore the chapter map ⊕ Mind map
AI podcast · 22 min
Now: Opening
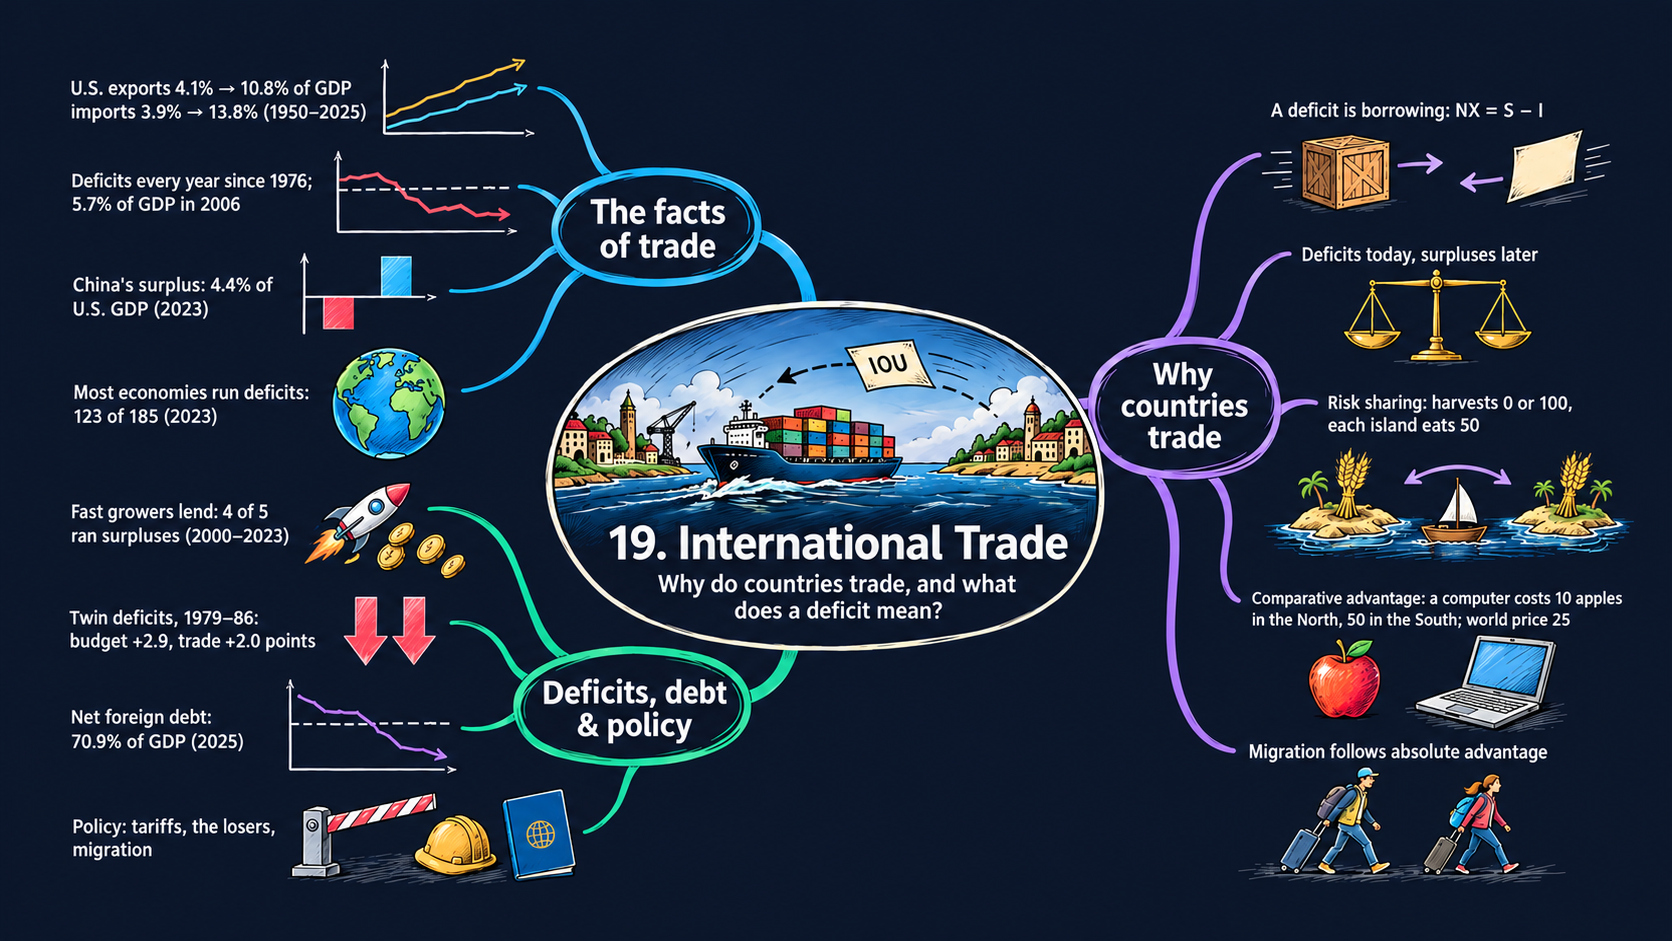
Work through comparative advantage and the gains from exchange. Connect trade balances to saving, investment, and borrowing from the rest of the world.
 Explore the chapter map ⊕ Mind map
AI podcast · 22 min
Now: Opening
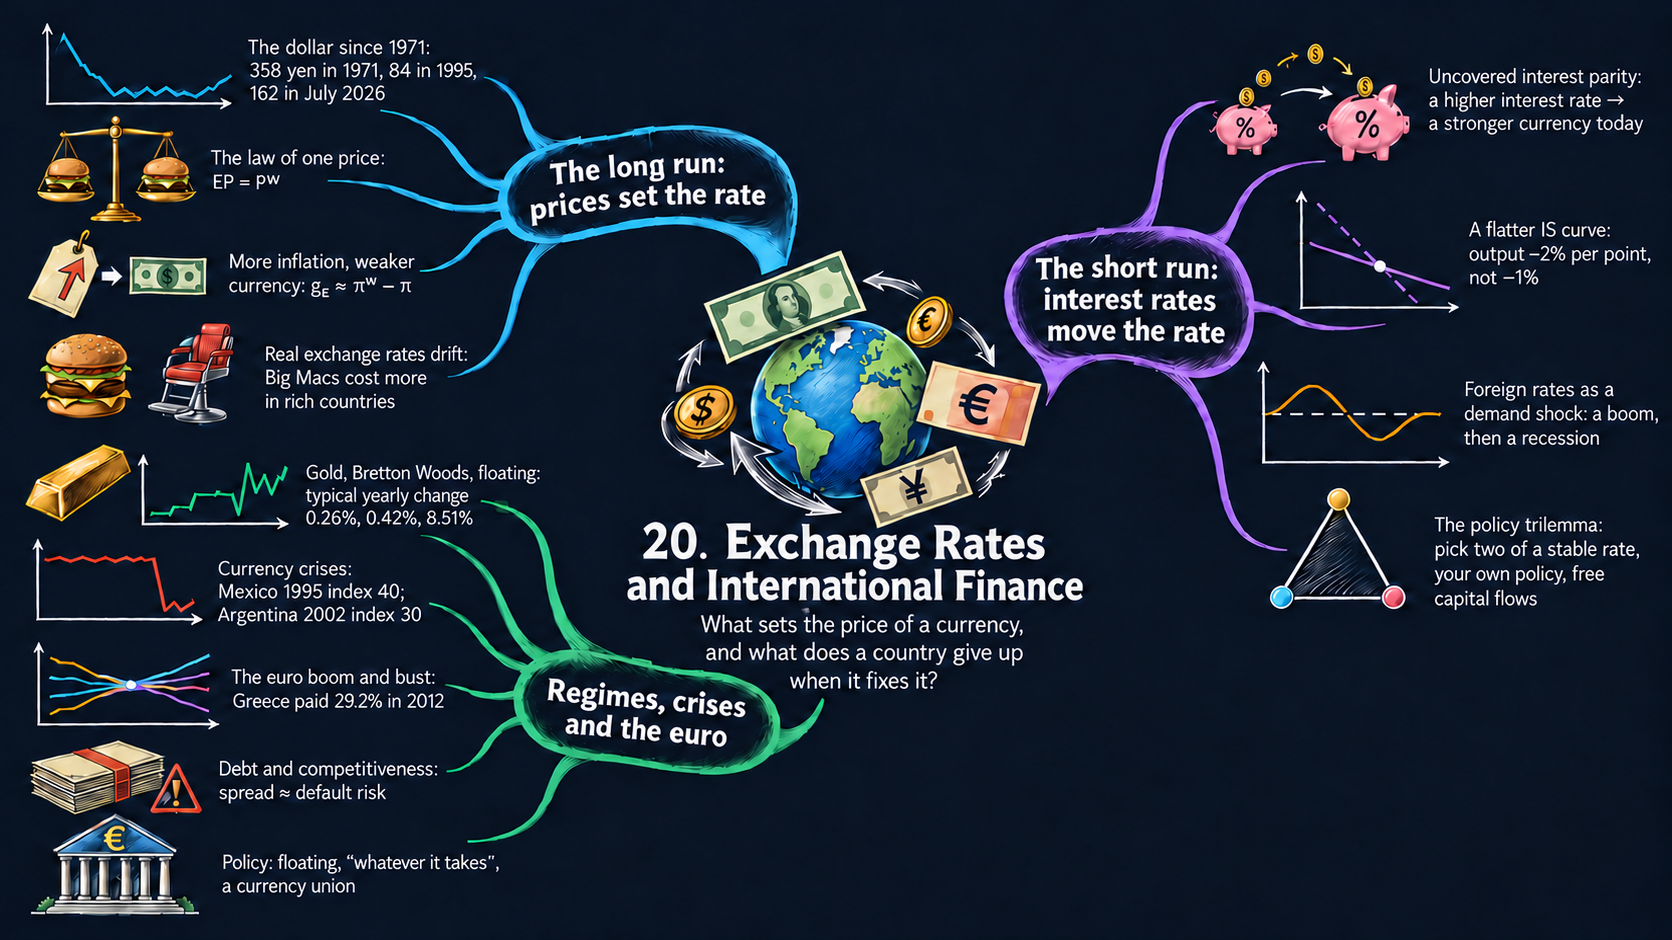
Compare purchasing power across countries and returns across currencies. Explore exchange rates, international finance, and policy in an open economy.
 Explore the chapter map ⊕ Mind map
AI podcast · 23 min
Now: Opening
Bring the book’s main lessons together. Revisit living standards, growth, inflation, and stabilization, then consider the questions macroeconomics still needs to answer.
 Explore the chapter map ⊕ Mind map
AI podcast · 22 min
Now: Opening
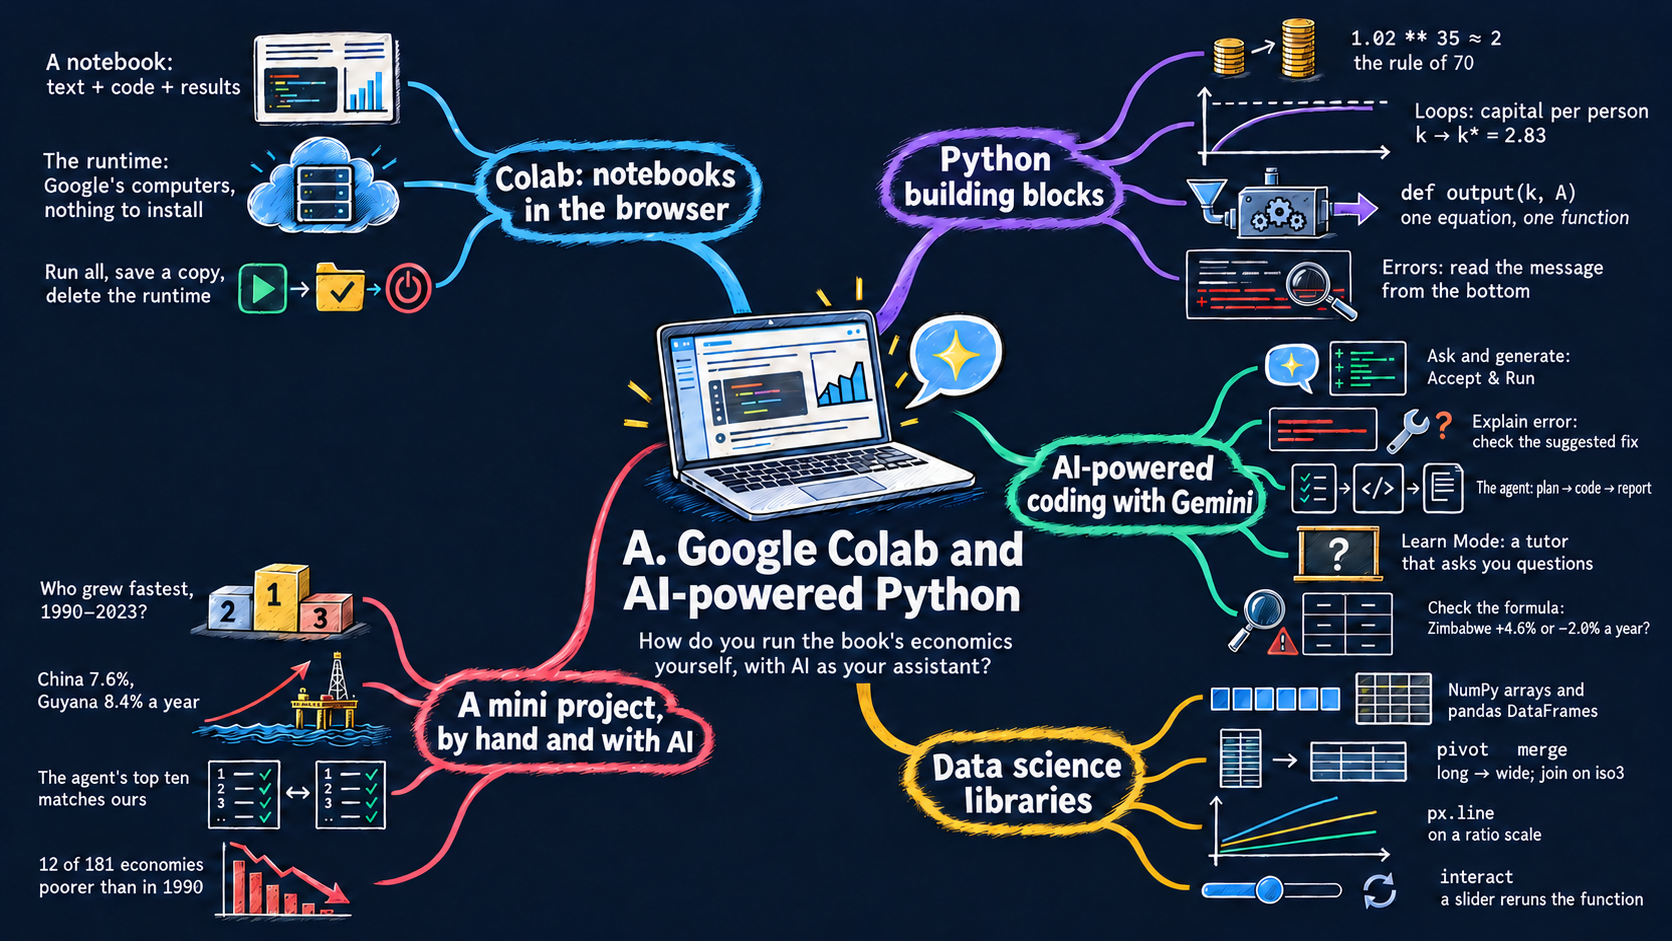
Open a notebook in Google Colab, run its code, and make it your own. Learn how to ask an AI assistant for help and check the answers it gives.
 Explore the chapter map
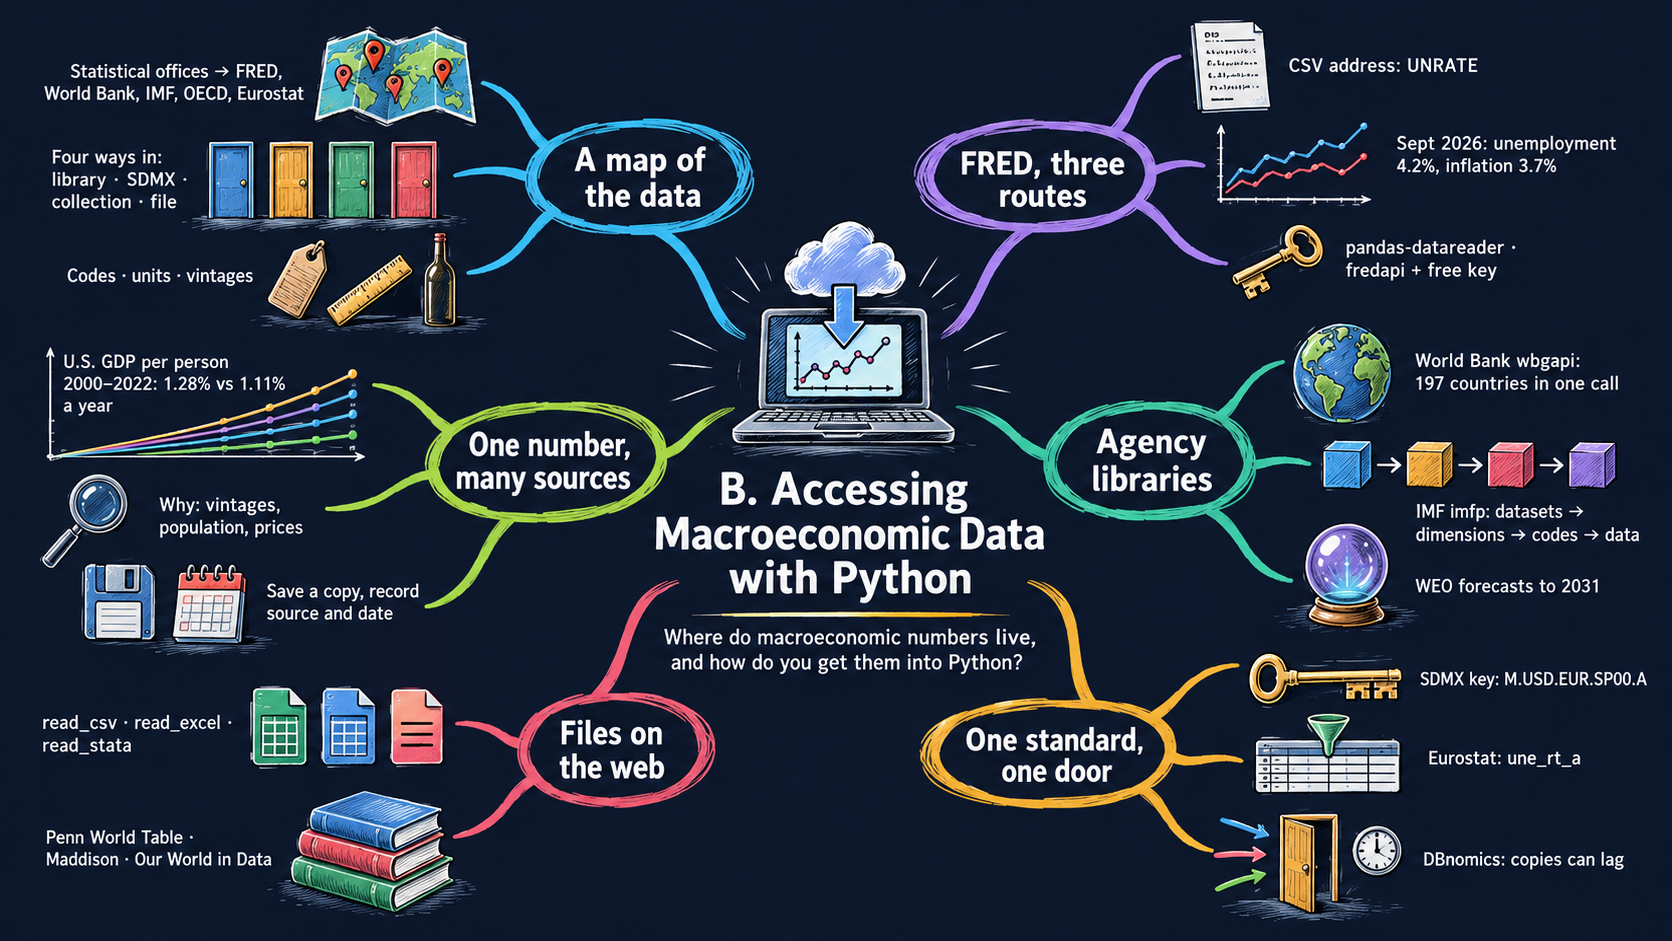
Download macroeconomic series directly with Python. Learn how to choose sources, compare definitions, and prepare data for analysis.
 Explore the chapter map
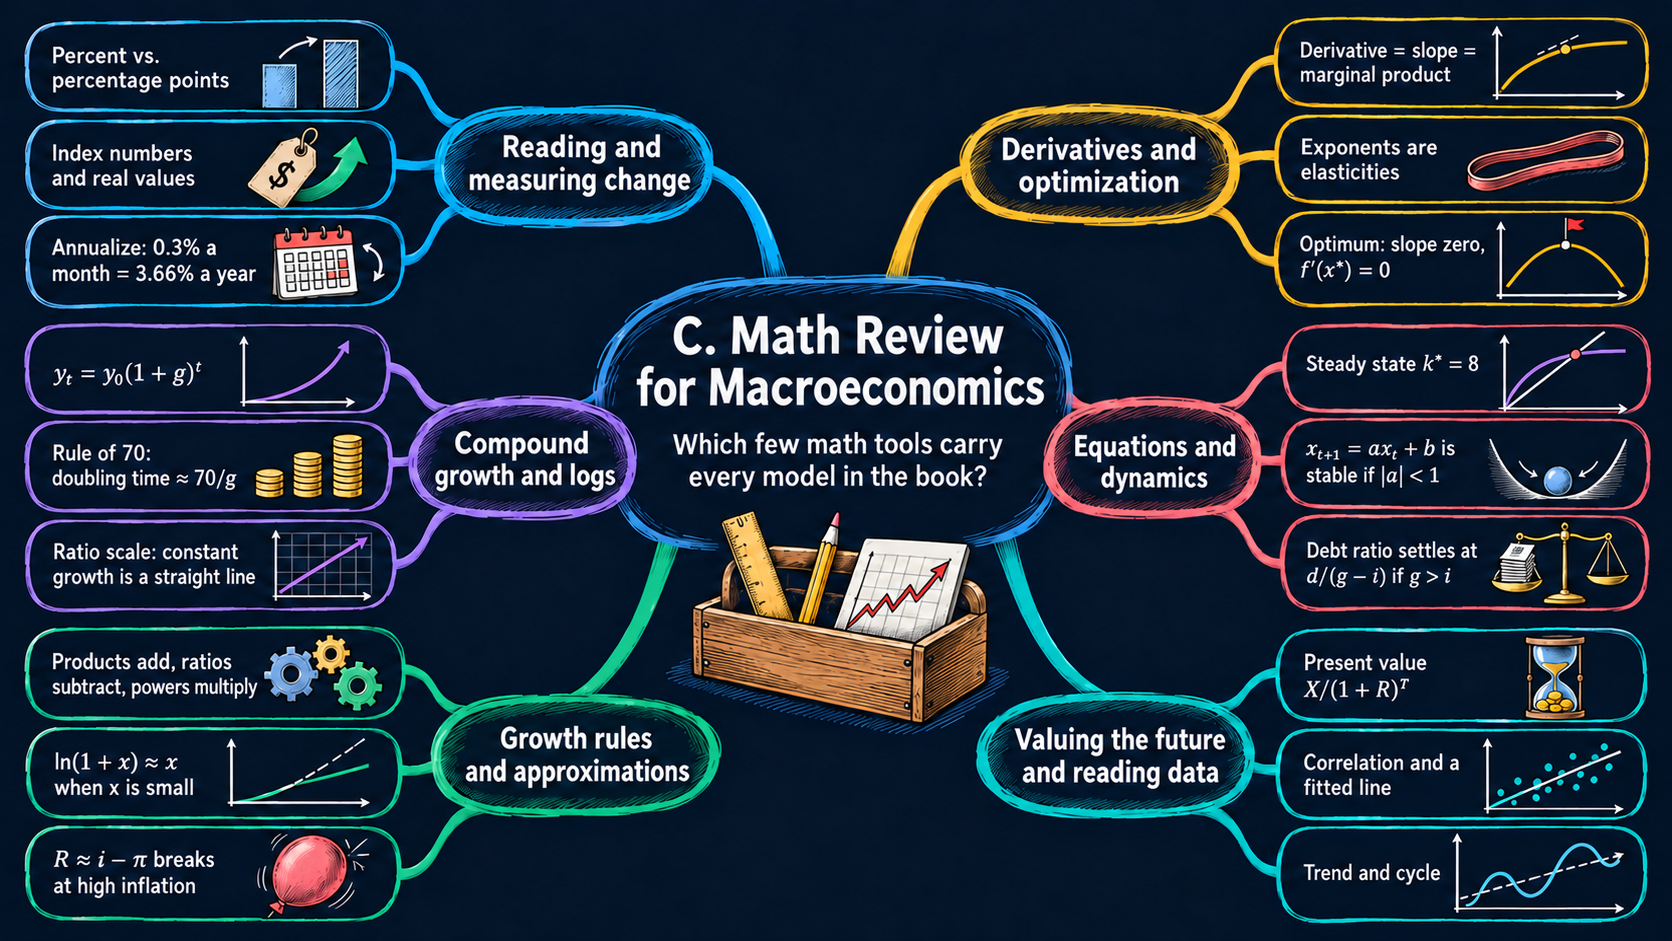
Review percentages, logarithms, growth rates, and the algebra behind the book. Connect each tool to the economic questions it helps answer.
 Explore the chapter map
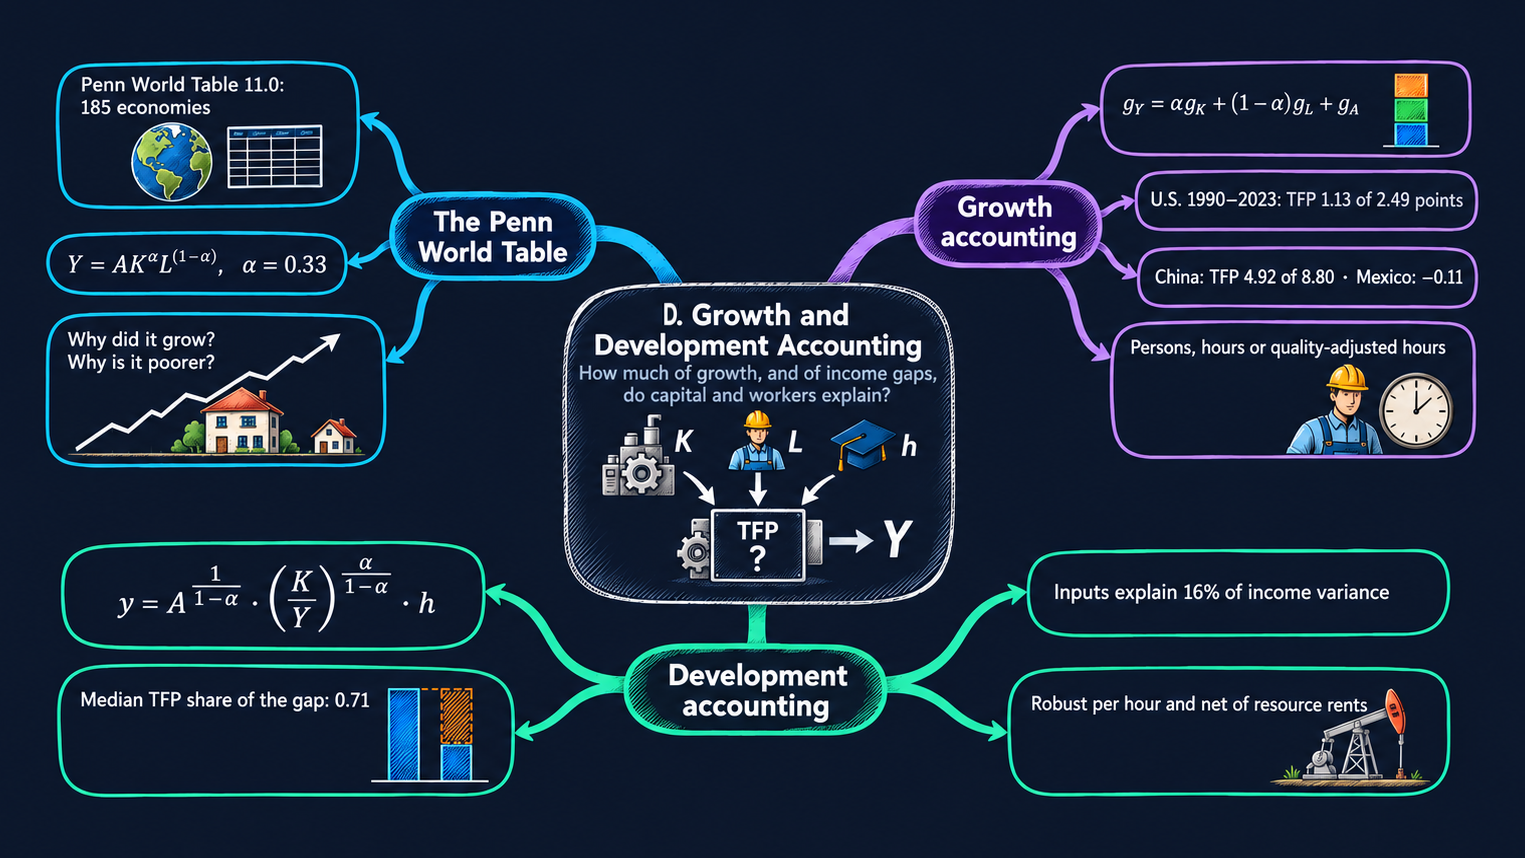
Use growth and development accounting to separate capital, labor, and productivity. Compare changes over time and differences in living standards across countries.
 Explore the chapter map
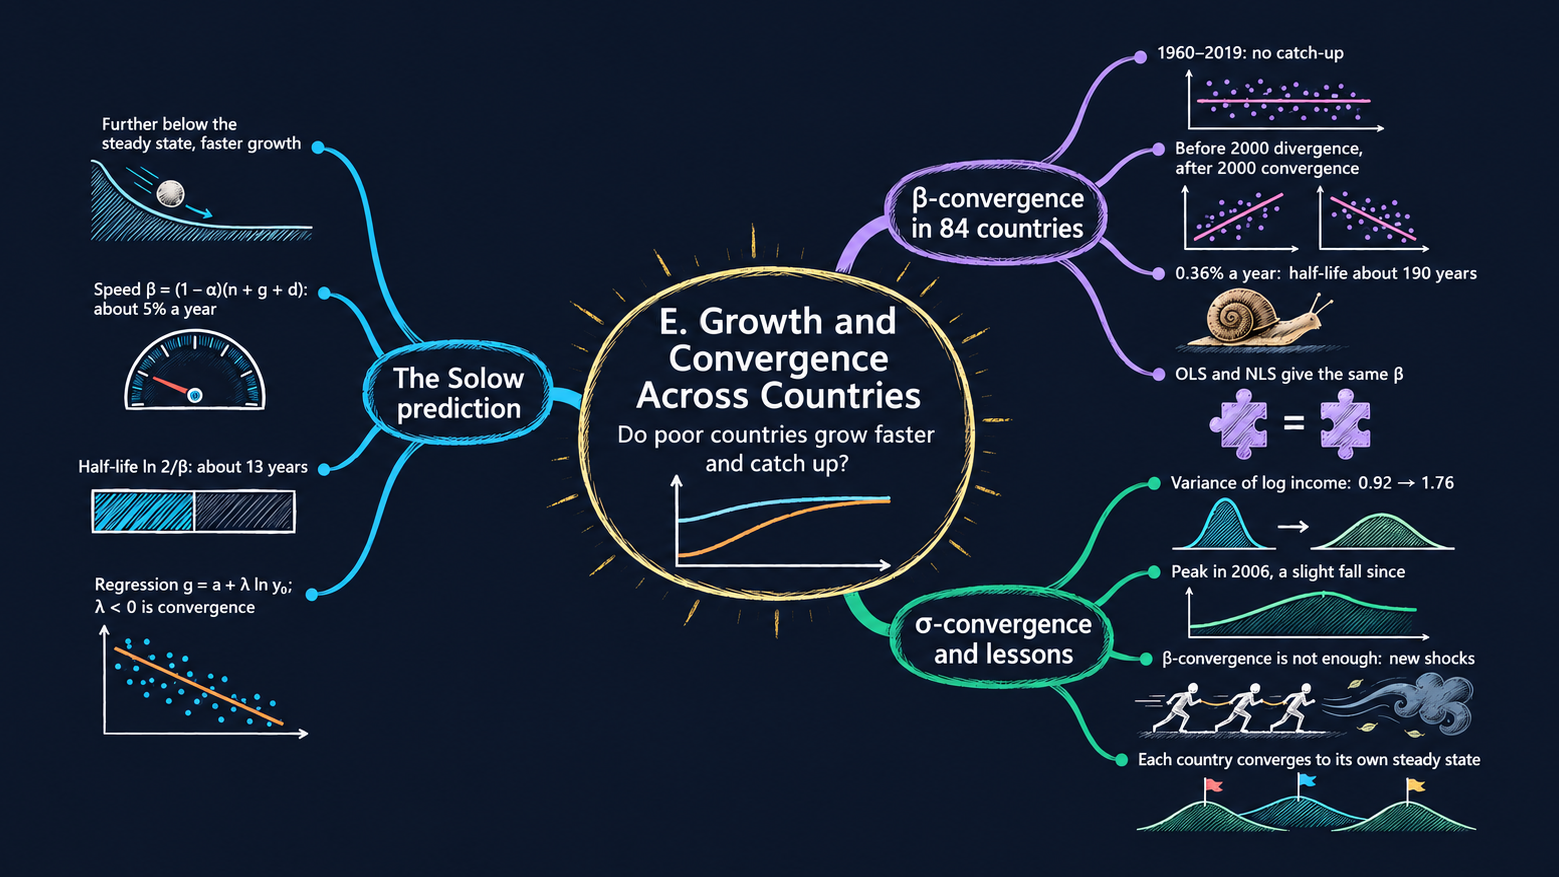
Derive convergence from the Solow model, then test it across countries. Compare growth regressions with changes in the dispersion of incomes.
 Explore the chapter map
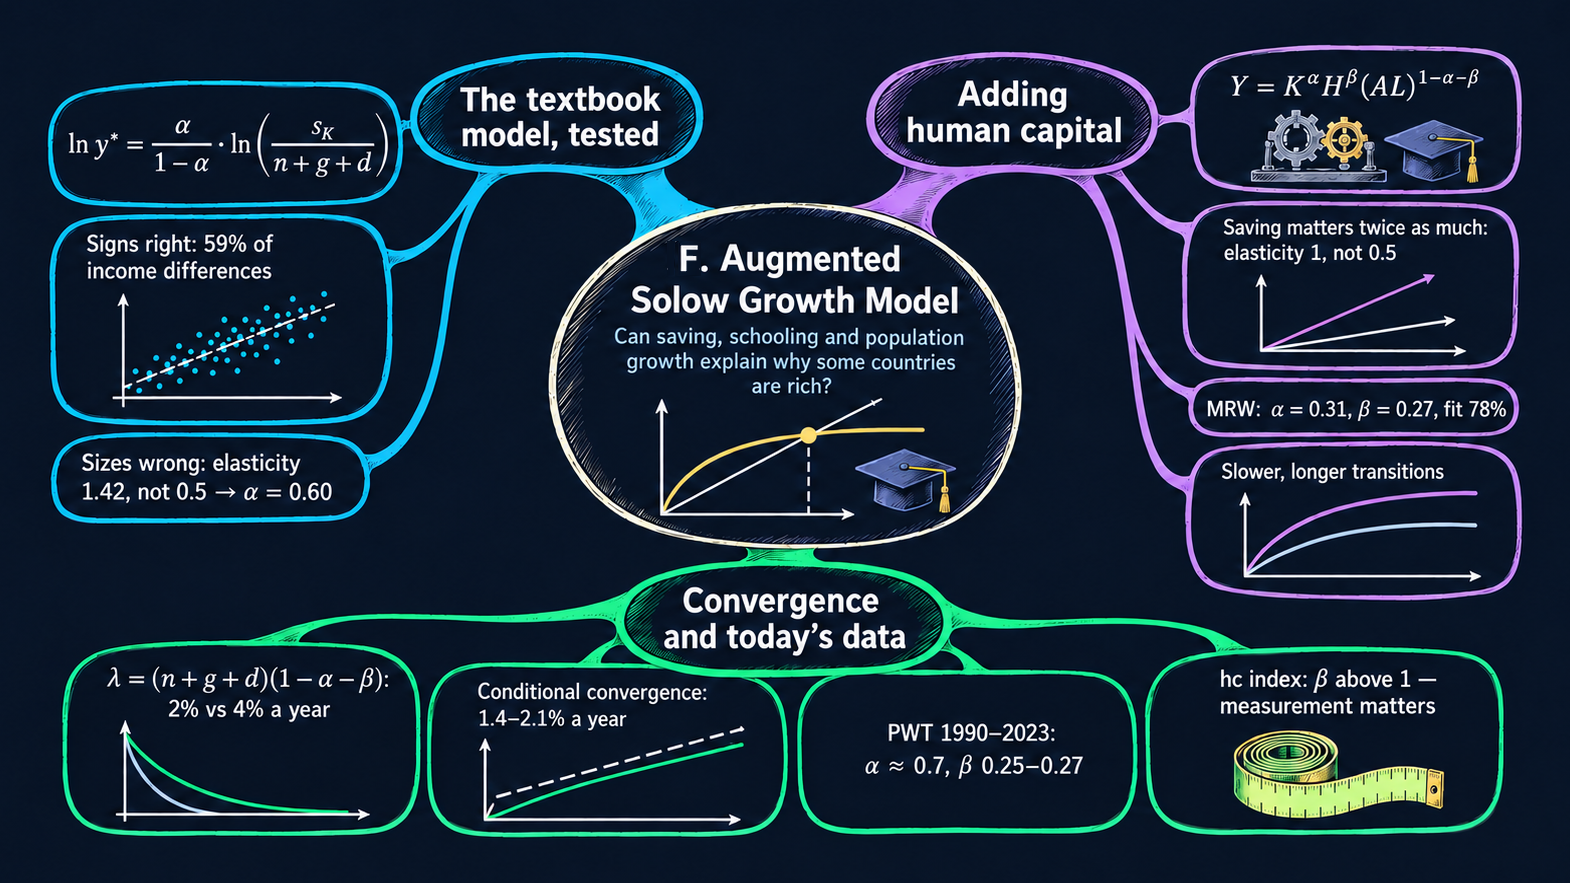
Add schooling to the Solow model. Rebuild the Mankiw–Romer–Weil analysis and compare its findings with more recent international data.
 Explore the chapter map
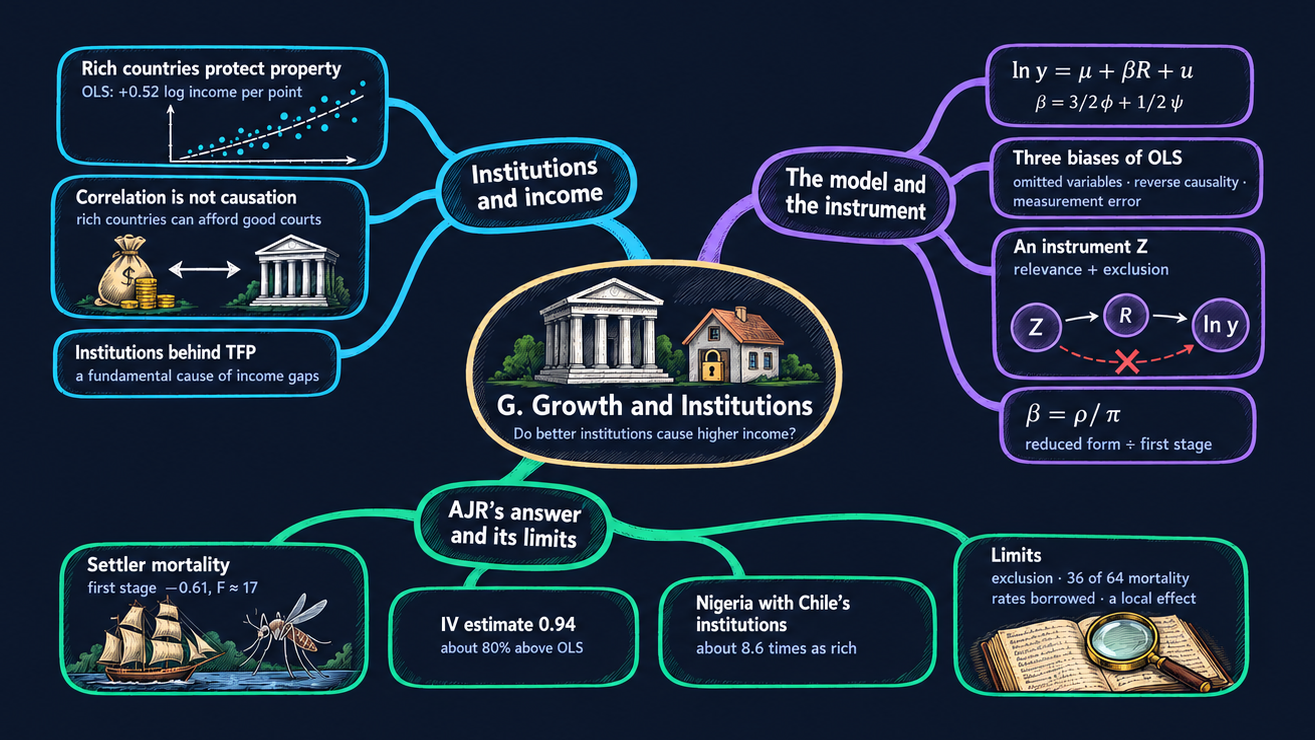
Revisit the Acemoglu–Johnson–Robinson study. Explore why correlation is not enough and how historical instruments are used to study institutions and income.
 Explore the chapter map
Use Python and Snowdrop to write, solve, simulate, and estimate dynamic models. Let the data help determine parameters and inspect the response to shocks.
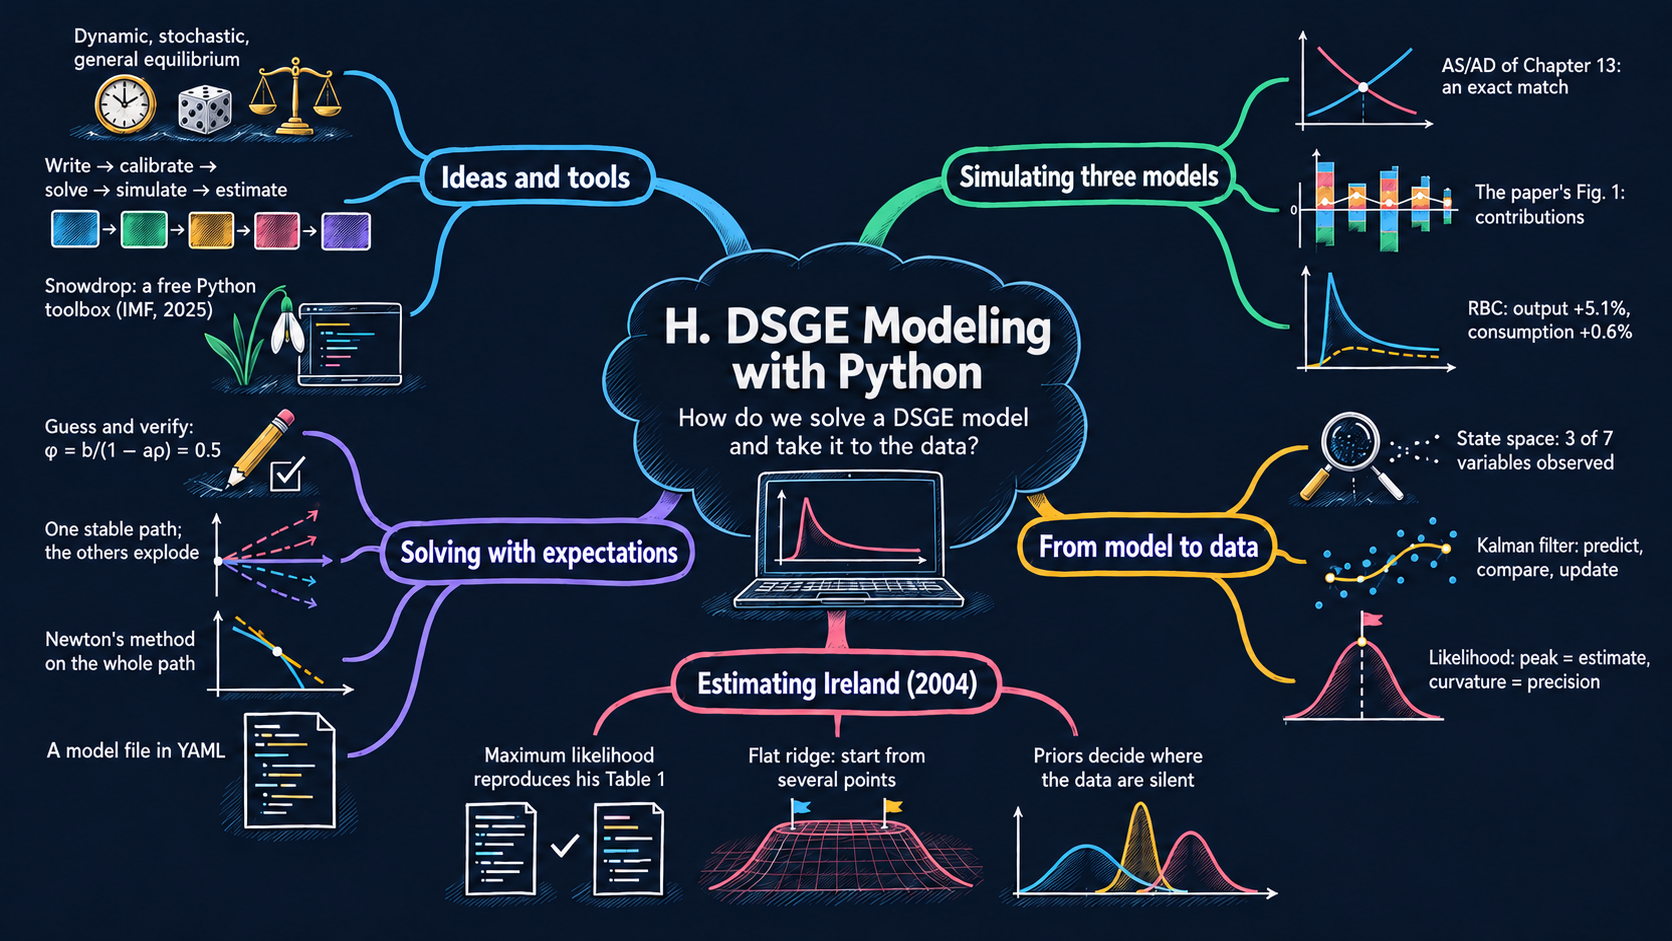 Explore the chapter map
Work with the Smets–Wouters model in Python. Recompute impulse responses and explore the roles of sticky wages, sticky prices, and monetary policy.
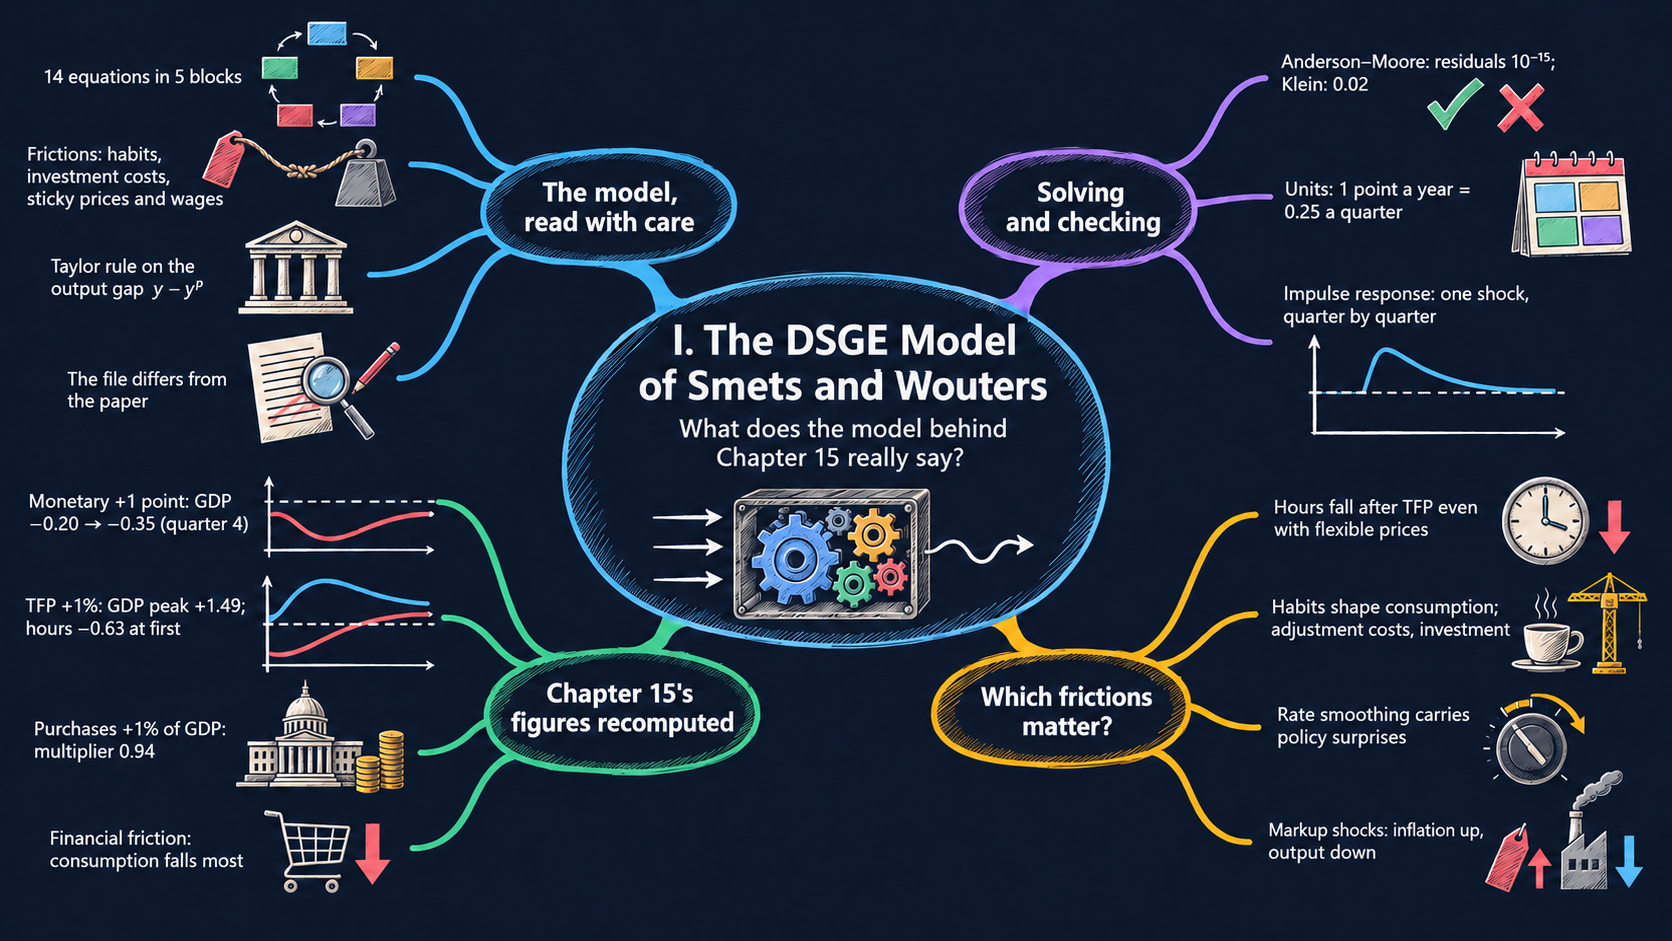 Explore the chapter map
No matching chapters or appendices. Try another search or topic.
Mind maps and lecture slides accompany every chapter and appendix. AI-generated podcasts accompany all 21 chapters.